. 2021 May 1;94(1121):20200685.
doi: 10.1259/bjr.20200685. Epub 2021 Apr 16.

T1 mapping for the diagnosis of early chronic pancreatitis: correlation with Cambridge classification system

Affiliations

T1 mapping for the diagnosis of early chronic pancreatitis: correlation with Cambridge classification system

Monica Cheng et al. Br J Radiol. .

Abstract

Objective: This study aims to determine if T1 relaxation time of the pancreas can detect parenchymal changes in early chronic pancreatitis (CP).

Methods: This study retrospectively analyzed 42 patients grouped as no CP (Cambridge 0; n = 21), equivocal (Cambridge 1; n = 12) or mild CP (Cambridge 2; n = 9) based on magnetic resonance cholangiopancreatography findings using the Cambridge classification as the reference standard. Unenhanced T1 maps were acquired using a three-dimensional dual flip-angle gradient-echo technique on the same 1.5 T scanner with the same imaging parameters.

Results: There was no significant difference between the T1 relaxation times of Cambridge 0 and 1 group (p = 0.58). There was a significant difference (p = 0.0003) in the mean T1 relaxation times of the pancreas between the combined Cambridge 0 and 1 (mean = 639 msec, 95% CI: 617, 660) and Cambridge 2 groups (mean = 726 msec, 95% CI: 692, 759). There was significant difference (p = 0.0009) in the mean T1 relaxation times of the pancreas between the Cambridge 0 (mean = 636 msec, 95% CI: 606, 666) and Cambridge 2 groups (mean = 726 msec, 95% CI: 692,759) as well as between Cambridge 1 (mean = 643 msec, 95% CI: 608, 679) and Cambridge 2 groups (mean = 726 msec, 95% CI: 692,759) (p = 0.0017). Bland-Altman analysis showed measurements of one reader to be marginally higher than the other by 15.7 msec (2.4%, p = 0.04).

Conclusion: T1 mapping is a practical method capable of quantitatively reflecting morphologic changes even in the early stages of chronic pancreatitis, and demonstrates promise for future implementation in routine clinical imaging protocols.

Advances in knowledge: T1 mapping can distinguish subtle parenchymal changes seen in early stage CP, and demonstrates promise for implementation in routine imaging protocols for the diagnosis of CP.


Figures

Figure 1.
Figure 1.
Comparison of T1 relaxation times in three patient cohorts. This box-and-whisker chart illustrates that there was a significant difference (p = 0.0009) in the mean T1 relaxation times of the pancreas between the Cambridge 0 (normal) and Cambridge = 2 (mild CP) groups. Similarly, there was a significant difference (p = 0.0017) in the mean T1 relaxation times of the pancreas between the Cambridge 1 (equivocal) and Cambridge 2 (mild CP) groups. CP, chronic pancreatitis.
Figure 2.
Figure 2.
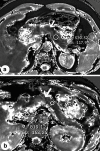
T1 mapping of pancreas. (A) shows an axial T1 map in a 33-year-old female with a history of alcoholic hepatitis and hepatic fibrosis being screened for hepatocellular carcinoma. Region of interest measurements reveals the mean T1 relaxation time in the pancreatic body to be 539 msec. Cambridge score was 0 (normal). (B) is an axial T1 map in a 38-year-old female with a history of non-specific colitis who was evaluated for epigastric pain suspected of pancreatic origin. Pancreatic parenchyma is grossly unremarkable however the Cambridge score was 2 (mild CP). Region of interest measurements reveals the T1 relaxation time in the pancreatic body to be 819 msec. CP, chronic pancreatitis.
Figure 3.
Figure 3.
Bland–Altman plot displays the scatter diagram of the differences plotted against the average measurements of two independent readers. There was borderline normal distribution (p = 0.0429) and line of normality (dashed line at 0) is within the 95% CI of the arithmetic mean (bias) of 15.7 therefore, the limits of agreement (two dashed lines) are defined as the mean difference ±1.96 SD of differences. All of the measurement differences between the two readers were within the ±1.96 SD lines. Arithmetic mean (bias): 15.7187 (95% CI: 0.5362 to 30.9013) (p = 0.0429). Lower limit: −66.8181 (95% CI: −93.0393 to −40.5969). Upper limit: 98.2556 (95% CI:72.0344 to 124.4768).

References

    1. Kleeff J, Whitcomb DC, Shimosegawa T, Esposito I, Lerch MM, Gress T, et al. . Chronic pancreatitis. Nat Rev Dis Primers 2017; 3: 17060. doi: 10.1038/nrdp.2017.60 - DOI - PubMed
    1. Singh VK, Yadav D, Garg PK. Diagnosis and management of chronic pancreatitis: a review. JAMA 2019; 322: 2422–34. doi: 10.1001/jama.2019.19411 - DOI - PubMed
    1. Dimastromatteo J, Brentnall T, Kelly KA. Imaging in pancreatic disease. Nat Rev Gastroenterol Hepatol 2017; 14: 97–109. doi: 10.1038/nrgastro.2016.144 - DOI - PubMed
    1. Conwell DL, Lee LS, Yadav D, Longnecker DS, Miller FH, Mortele KJ, et al. . American pancreatic association practice guidelines in chronic pancreatitis: evidence-based report on diagnostic guidelines. Pancreas 2014; 43: 1143–62. doi: 10.1097/MPA.0000000000000237 - DOI - PMC - PubMed
    1. Tirkes T, Lin C, Cui E, Deng Y, Territo PR, Sandrasegaran K, et al. . Quantitative Mr evaluation of chronic pancreatitis: extracellular volume fraction and MR relaxometry. AJR Am J Roentgenol 2018; 210: 533–42. doi: 10.2214/AJR.17.18606 - DOI - PMC - PubMed