. 2021 Apr 1;62(4):22.
doi: 10.1167/iovs.62.4.22.

Light Environment Influences Developmental Programming of the Metabolic and Visual Systems in Mice

Affiliations

Light Environment Influences Developmental Programming of the Metabolic and Visual Systems in Mice

Danielle A Clarkson-Townsend et al. Invest Ophthalmol Vis Sci. .

Abstract

Purpose: Light is a salient cue that can influence neurodevelopment and the immune system. Light exposure out of sync with the endogenous clock causes circadian disruption and chronic disease. Environmental light exposure may contribute to developmental programming of metabolic and neurological systems but has been largely overlooked in Developmental Origins of Health and Disease (DOHaD) research. Here, we investigated whether developmental light exposure altered programming of visual and metabolic systems.

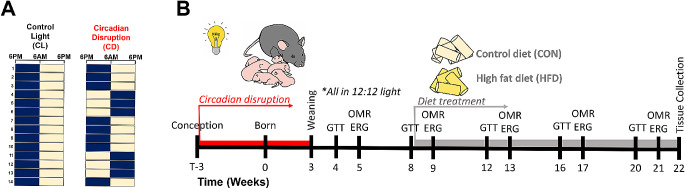
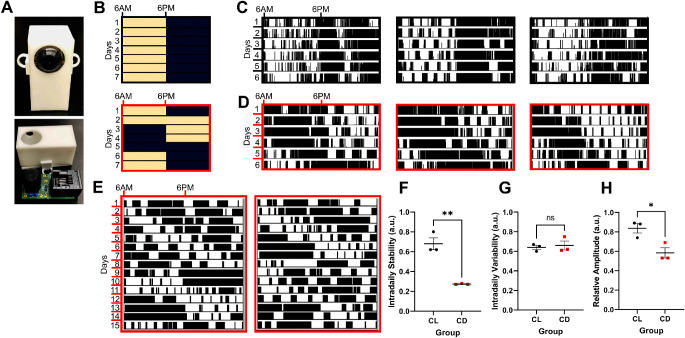
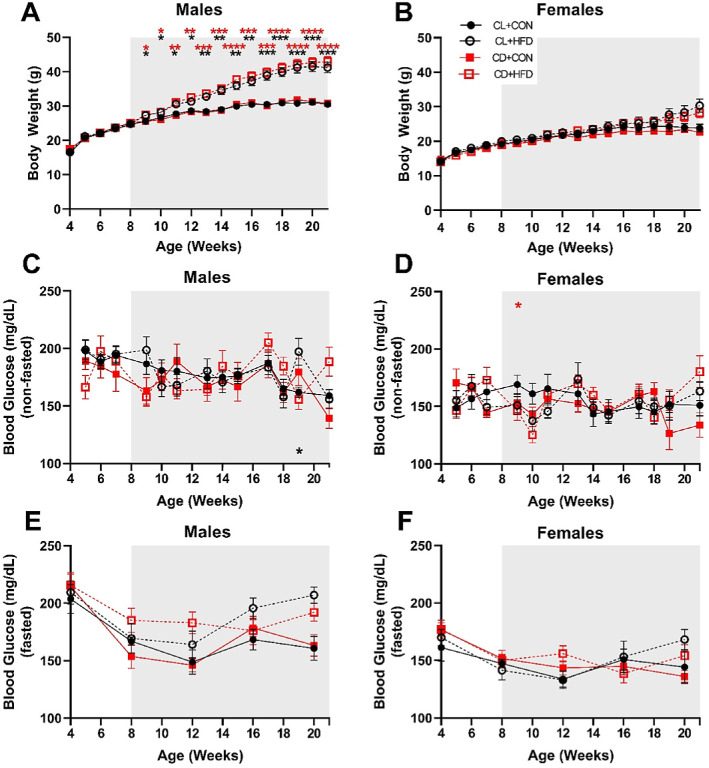
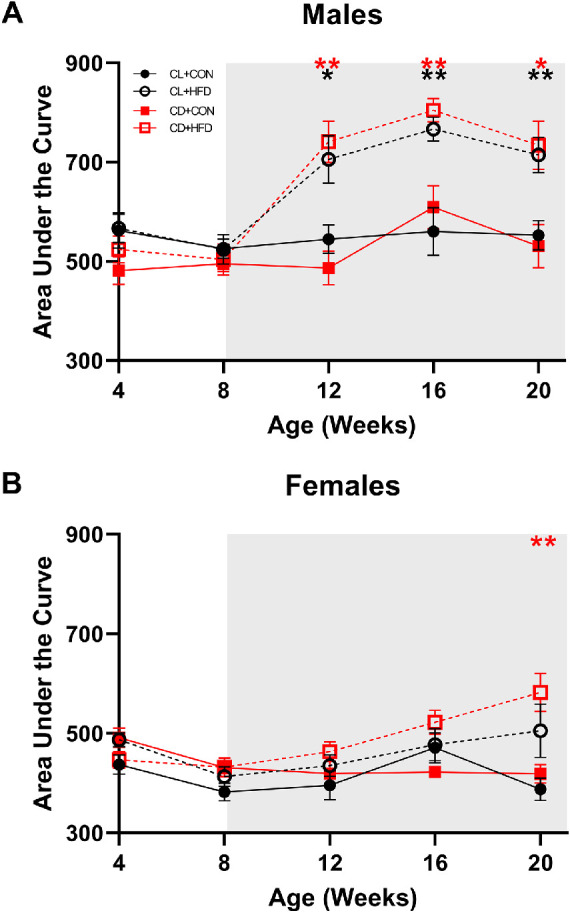
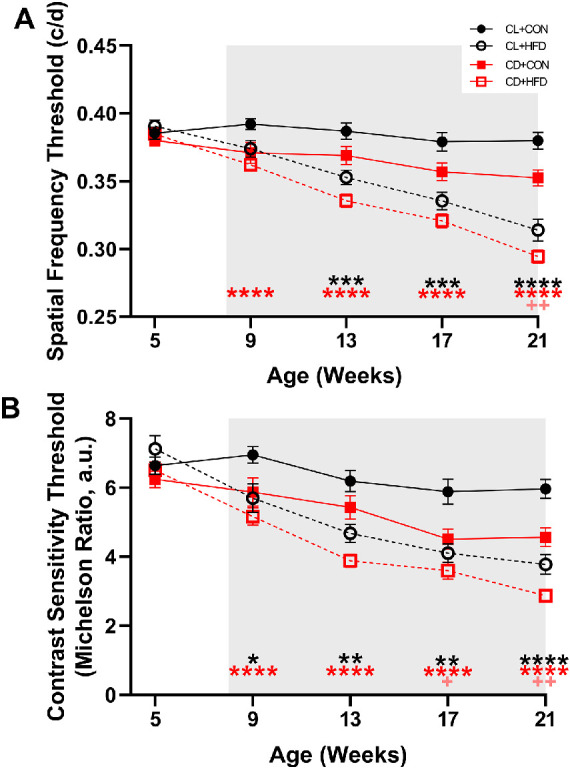
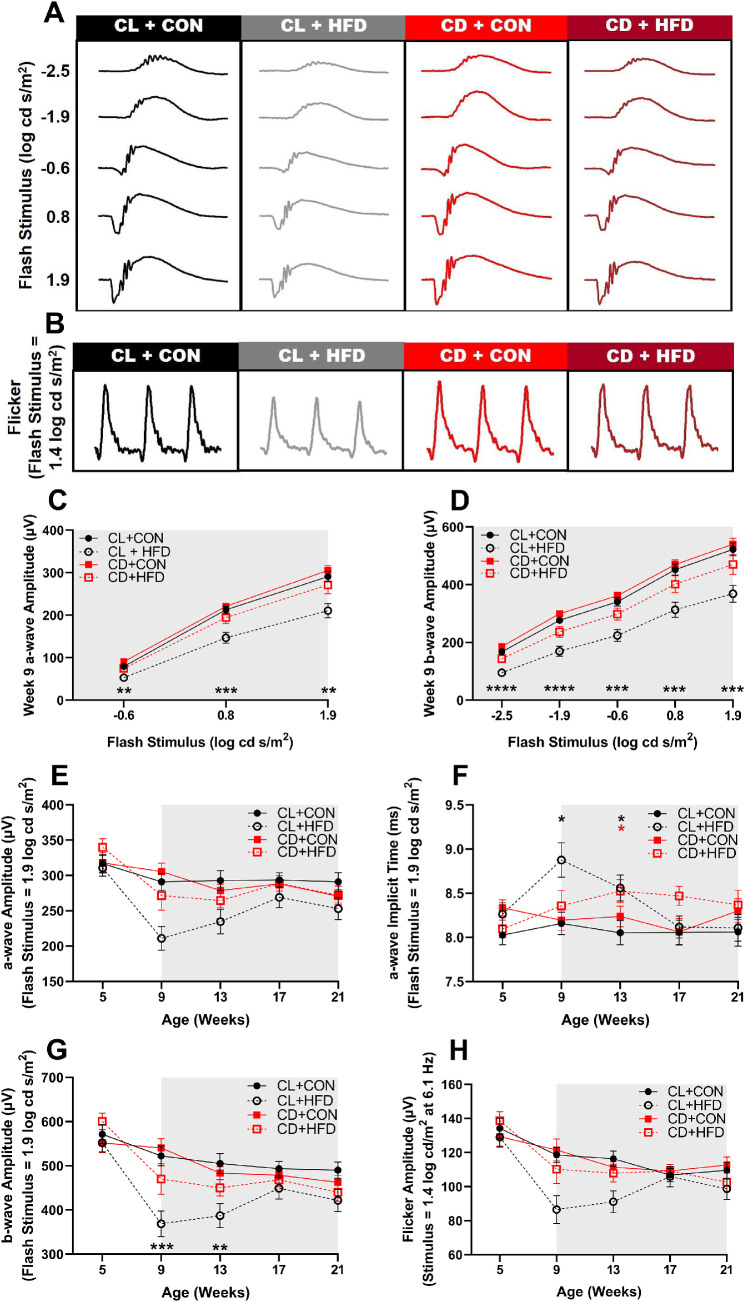
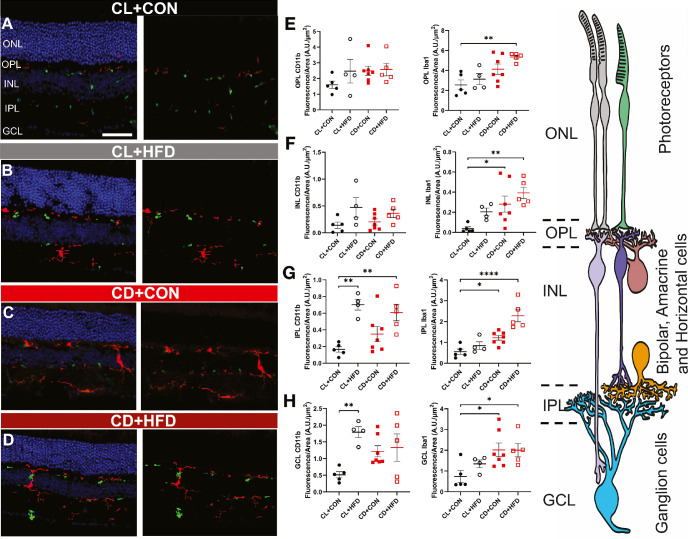
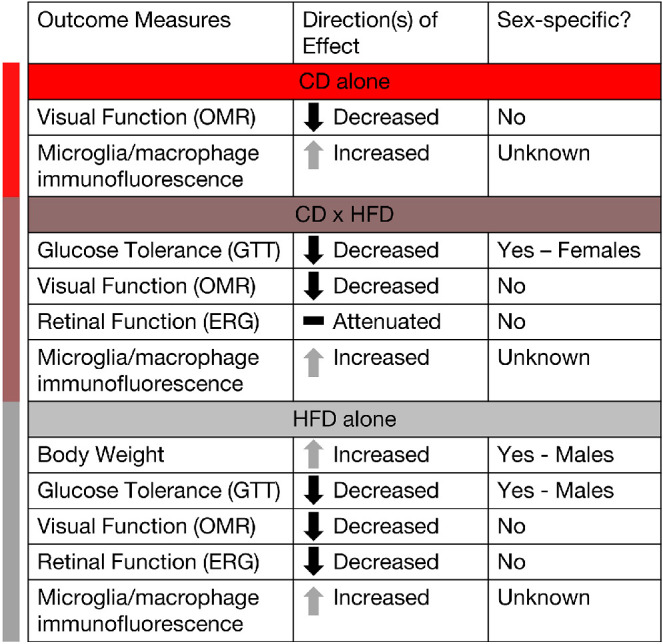
Methods: Pregnant mice and pups were exposed to control light (12:12 light:dark) or weekly light cycle inversions (circadian disruption [CD]) until weaning, after which male and female offspring were housed in control light and longitudinally measured to evaluate differences in growth (weight), glucose tolerance, visual function (optomotor response), and retinal function (electroretinogram), with and without high fat diet (HFD) challenge. Retinal microglia and macrophages were quantified by positive Iba1 and CD11b immunofluorescence.

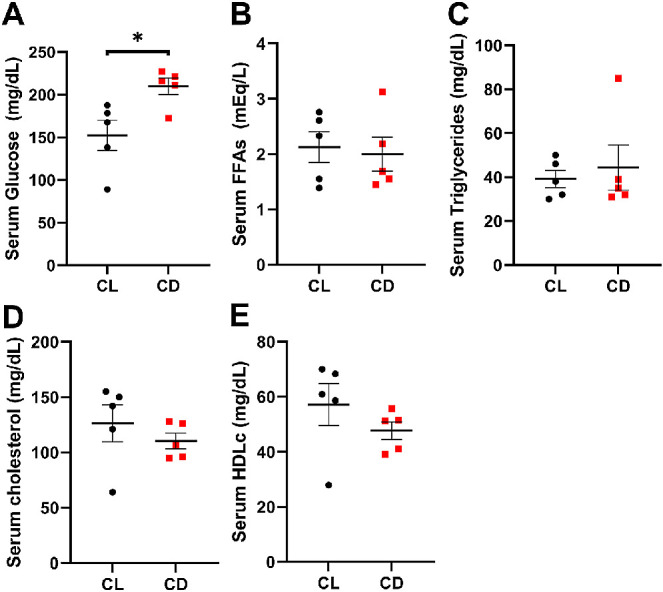
Results: CD exposure caused impaired visual function and increased retinal immune cell expression in adult offspring. When challenged with HFD, CD offspring also exhibited altered retinal function and sex-specific impairments in glucose tolerance.

Conclusions: Overall, these findings suggest that the light environment contributes to developmental programming of the metabolic and visual systems, potentially promoting a pro-inflammatory milieu in the retina and increasing the risk of visual disease later in life.


Conflict of interest statement

Disclosure: D.A. Clarkson-Townsend, None; K.L. Bales, None; C.J. Marsit, None; M.T. Pardue, None

Figures

Figure 1.
Figure 1.
Overall experimental design and timeline. (A) Dams and offspring (both sexes) were developmentally exposed to control light (CL) treatment (12:12 lights on at 6 AM and off at 6 PM) or circadian disruption (CD) treatment (inversion of photoperiod every 3–4 days). The navy blue and yellow boxes each represent a time period of 12 hours, with navy representing lights off and yellow representing lights on; each row is a new day. (B) Diagram of the experimental timeline. Female breeders and their pups were exposed to CL or CD light conditions during development, as represented by the lightbulb symbol and female with pups. At weaning (3 weeks age), offspring were all housed in control light conditions and fed standard rodent chow ad libitum. At 8 weeks of age, immediately following glucose tolerance test, offspring were fed with either high fat diet (HFD) or ingredient-matched control diet (CON) ad libitum, represented by the pale yellow and bright yellow cylinders. Glucose tolerance testing (GTT), visual function using optomotor response (OMR), and retinal function using electroretinogram (ERG) were longitudinally tested from 4 to 21 weeks of age. Tissues were collected for analysis at 22 weeks of age.
Figure 2.
Figure 2.
Mice exposed to circadian disruption (CD) light conditions have altered activity rhythms. (A) Picture of the custom-built infrared motion sensor (PIR), showing (above) the sensor as encased in a 3D-printed plastic shell and (below) removed from the case showing the circuit board and components. (B) Representative control light (CL) cycle (black outline), with lights on (pale yellow shading) at 6 AM and lights off (navy blue shading) at 6 PM, and CD light cycle (red outline), with light inversions twice weekly (note that this is the same schedule as shown in Figure 1, but plotted with different start time). (C) Representative single-plotted actograms from 3 cages of female mice exposed to CL over a 6-day period, with vertical black lines indicating activity and each row representing a 24-hour period. (D) Representative single-plotted actograms from 3 cages of female mice exposed to CD over a 6-day period, with black lines indicating activity and each row a 24-hour period. (E) Representative actograms from running wheels of females exposed to CD over a 15-day period, with black lines indicating activity and each row a 24-hour period. (F) Intradaily stability (t = 6.77, df = 4, P = 0.003), (G) intradaily variability (t = 0.40, df = 4, P = 0.71), and (H) relative amplitude (t = 3.52, df = 4, P = 0.025) as calculated from the representative actograms in C and D, presented as mean ± SEM and analyzed with student's 2-tailed unpaired t-tests, *P < 0.05 and **P < 0.01.
Figure 3.
Figure 3.
Circadian disruption increases serum glucose levels. At weaning, dams in the CD group had higher serum (A) glucose (t = 2.836, df = 8, P = 0.022) but similar levels of (B) free fatty acids (FFAs; t = 0.3135, df = 8, P = 0.762), (C) triglycerides (t = 0.4747, df = 8, P = 0.648), (D) cholesterol (t = 0.8841, df = 8, P = 0.402), and (E) high density lipoprotein (HDLc; t = 1.141, df = 8, P = 0.287) compared to dams in the CL group. Data are presented as mean ± SEM and analyzed with Student's 2-tailed unpaired t-tests, *P < 0.05, n = 5 per group.
Figure 4.
Figure 4.
Only male mice gained weight after HFD exposure. (A) Male HFD groups developed significantly higher body weight starting at 9 weeks, 1 week after start of diet treatment (mixed-effects analysis, F(51, 559) = 22.77, P < 0.0001). (B) Female mice showed an interaction between time and treatment (mixed-effects analysis, F(51, 549) = 3.28, P < 0.0001), but no significant differences between treatment groups. (C) CL + HFD males had significantly higher blood glucose (non-fasted) at 19 weeks (mixed-effects analysis, F(36, 386) = 1.74, P = 0.006). (D) CD + HFD females had significantly lower blood glucose (non-fasted) at 10 weeks (mixed-effects analysis, F(36, 385) = 1.63, P = 0.015). There were no differences between groups in blood glucose levels after fasting for 6 hours (prior to GTT) in (E) males (mixed-effects analysis, F(12, 132) = 1.56, P = 0.11) or (F) females (mixed-effects analysis, F(12, 128) = 1.35, P = 0.20). Data are presented as mean ± SEM and analyzed by mixed models with post-hoc Dunnett tests. *P < 0.05, **P < 0.01, ***P < 0.001, and ****P < 0.0001 versus the CL + CON group. Black asterisks indicate the CL + HFD group and red asterisks indicate the CD + HFD group. Grey shading indicates period of diet treatment. For males, CL + CON n = 8 to 10, CL + HFD n = 9 to 10, CD + CON n = 7 to 9, and CD + HFD n = 8 to 10 at each timepoint; for females, CL + CON n = 8 to 9, CL + HFD n = 5 to 9, CD + CON n = 9 to 10, and CD + HFD n = 7 to 11 at each timepoint.
Figure 5.
Figure 5.
Males on HFD have higher area under the curve (AUC) values of glucose tolerance testing and at earlier timepoints than females. (A) Male AUC values; CD + HFD and CL + HFD groups had higher AUC values at 12, 16, and 20 weeks of age compared to the CL + CON group (mixed-effects, group*time: F(12, 132) = 4.13, P < 0.0001, P < 0.05). (B) Female AUC values; CD + HFD group had higher AUC values at 20 weeks of age compared to the CL + CON group (mixed-effects, group*time: F(12, 126) = 3.07, P < 0.001, P < 0.05). Data are presented as mean ± SEM and analyzed by mixed models with Dunnett tests. *P < 0.05, **P < 0.01, ***P < 0.001, and ****P < 0.0001 versus CL + CON group. Black asterisks indicate the CL + HFD group and red asterisks indicate the CD + HFD group. Grey shading indicates period of diet treatment. For males, CL + CON n = 9 to 10, CL + HFD n = 9 to 10, CD + CON n = 8 to 9, and CD + HFD n = 9 to 10 at each timepoint; for females, CL + CON n = 8 to 9, CL + HFD n = 6 to 9, CD + CON n = 7 to 10, and CD + HFD n = 7 to 11 at each timepoint.
Figure 6.
Figure 6.
HFD and developmental circadian disruption reduced visual function. (A) Spatial frequency thresholds decreased after the induction of HFD (mixed-effects, group*time: F(12, 275) = 14.33, P < 0.0001) in the CD + HFD group (P < 0.05), whereas the CL + HFD group developed decreased spatial frequency slightly later (P < 0.05) and the CD + CON group had decreased visual frequency at 20 weeks of age (P < 0.05). (B) Contrast sensitivity thresholds decreased after exposure to HFD (mixed-effects, group*time: F(12, 275) = 8.23, P < 0.0001) in the CD + HFD and CL + HFD groups (P < 0.05), whereas the CD + CON group had decreased contrast sensitivity at 17 and 21 weeks of age compared to the CL + CON group (P < 0.05). Data are presented as mean ± SEM and analyzed by mixed models with Dunnett tests. *P < 0.05, **P < 0.01, ***P < 0.001, and ****P < 0.0001 versus the CL + CON group. Black asterisks indicate the CL + HFD group, red asterisks indicate the CD + HFD group, and pink crosses indicate the CD + CON group. Grey shading indicates period of diet treatment. For each timepoint, CL + CON n = 17 to 19, CL + HFD n = 14 to 19, CD + CON n = 17 to 19, and CD + HFD n = 16 to 21.
Figure 7.
Figure 7.
Transient deficits in retinal function after acute HFD treatment. Representative ERG waveforms at 9 weeks of age (1 week after HFD) in response to (A) a series of scotopic stimuli and (B) photopic flicker stimuli showing visible amplitude deficits in the CL + HFD group. (C) Intensity response curve of a-wave amplitudes at 9 weeks of age (2-way ANOVA, F(6, 140) = 4.03, P < 0.001) show decreased amplitudes in the CL + HFD group. (D) Intensity response curve of b-wave amplitudes at 9 weeks of age (2-way ANOVA, F(12, 280) = 2.52, P < 0.005) shows decreased amplitudes in the CL + HFD group. (E) The a-wave amplitudes (mixed-effects, group*time: F(12, 260) = 1.69, P = 0.069) over time and (F) implicit times (mixed-effects, group*time: F(12, 260) = 1.96, P < 0.05) with delays in the CL + HFD and the CD + HFD groups. (G) The b-wave scotopic (−2.5, −1.9, −0.6, 0.8, and 1.9 log cd s/m2) amplitudes (mixed-effects, group*time: F(12, 260) = 2.32, P < 0.01) and (H) flicker amplitudes (mixed-effects, group*time: F(12, 255) = 1.70, P = 0.067) over time. Data are presented as mean ± SEM and analyzed by 2-way ANOVAs or mixed models with Dunnett tests. *P < 0.05, **P < 0.01, ***P < 0.001, and ****P < 0.0001 versus the CL + CON group. Black asterisks indicate the CL + HFD group and red asterisks indicate the CD + HFD group. Grey shading indicates period of diet treatment. For each timepoint, CL + CON n = 16 to 19, CL + HFD n = 14 to 19, CD + CON n = 15 to 19, and CD + HFD n = 15 to 21.
Figure 8.
Figure 8.
Both CD and HFD cause increased retinal immune activation, as measured by CD11b (green) and Iba1 (red). Representative retinal immunofluorescence microscopy results, with (left) and without (right) DAPI staining (blue), showing retinal layers of the (A) CL + CON group, the (B) CL + HFD group, the (C) CD + CON group, and the (D) CD + HFD group show increased retinal expression of CD11b in CL + HFD, CD + CON, and CD + HFD groups and increased retinal expression of Iba1 in the CD + CON and CD + HFD groups. Measured fluorescence by retinal layer, showing no difference in (E) CD11b staining in the OPL (1-way ANOVA, F(3, 17) = 1.23, P = 0.33) but increased Iba1 staining in the OPL (1-way ANOVA, F(3, 17) = 6.25, P = 0.0047) in the CD + HFD group. (F) In the INL, there was also no difference in CD11b expression (1-way ANOVA, F(3, 17) = 2.52, P = 0.092), but Iba1 expression was increased (1-way ANOVA, F(3, 17) = 5.36, P = 0.022) in the CD + CON and CD + HFD groups. In the IPL, (G) CD11b increased (1-way ANOVA, F(3, 17) = 8.06, P = 0.0015) in both HFD groups while Iba1 increased (1-way ANOVA, F(3, 17) = 15.87, P < 0.0001) in both CD groups. Likewise, in the GCL, (H) CD11b was increased (1-way ANOVA, F(3, 17) = 4.34, P = 0.019) in the CL + HFD group and Iba1 was increased (1-way ANOVA, F(3, 17) = 3.89, P = 0.023) in both CD groups. (I) Drawing representing the retinal layers. Images from the CL + CON group (n = 5 mice), CL + HFD group (n = 4 mice), CD + CON group (n = 7 mice), and CD + HFD group (n = 5 mice) include both sexes. Data are presented as mean ± SEM and analyzed by 1-way ANOVAs with Dunnett tests. *P < 0.05, **P < 0.01, ***P < 0.001, and ****P < 0.0001 versus the CL + CON group. Scale bar = 12 µm.
Figure 9.
Figure 9.
Summary figure highlighting the influence of developmental light treatment and/or later HFD treatment on visual and metabolic outcomes and whether outcomes differed by sex.

Similar articles

Cited by

References

    1. Barker DJP. The developmental origins of adult disease. J Am Coll Nutr . 2004; 23(Suppl 6): 588S–595S. - PubMed
    1. McMillen IC, Robinson JS.. Developmental origins of the metabolic syndrome: prediction, plasticity, and programming. Physiol Rev . 2005; 85(2): 571–633. - PubMed
    1. Varcoe TJ, Gatford KL, Kennaway DJ.. Maternal circadian rhythms and the programming of adult health and disease. Am J Physiol Regul Integr Comp Physiol . 2018; 314(2): R231–R241. - PubMed
    1. Jackson CR, Capozzi M, Dai H, McMahon DG.. Circadian perinatal photoperiod has enduring effects on retinal dopamine and visual function. J Neurosci . 2014; 34(13): 4627. - PMC - PubMed
    1. Fonken LK, Nelson RJ.. Effects of light exposure at night during development. Curr Opin Behav Sci . 2016; 7: 33–39.

Publication types