. 2021 Apr 16;17(4):e1008909.
doi: 10.1371/journal.pcbi.1008909. eCollection 2021 Apr.

Identification of long regulatory elements in the genome of Plasmodium falciparum and other eukaryotes

Affiliations

Identification of long regulatory elements in the genome of Plasmodium falciparum and other eukaryotes

Christophe Menichelli et al. PLoS Comput Biol. .

Abstract

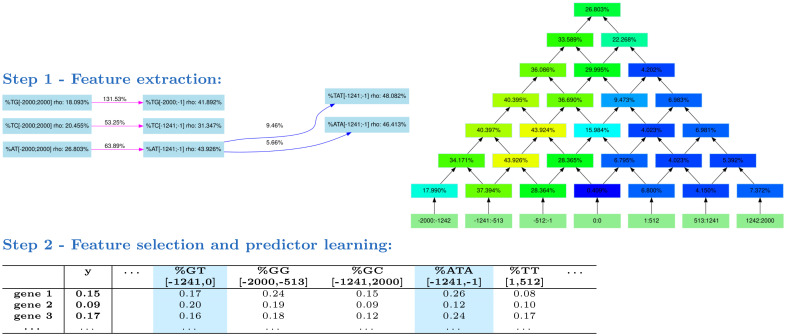
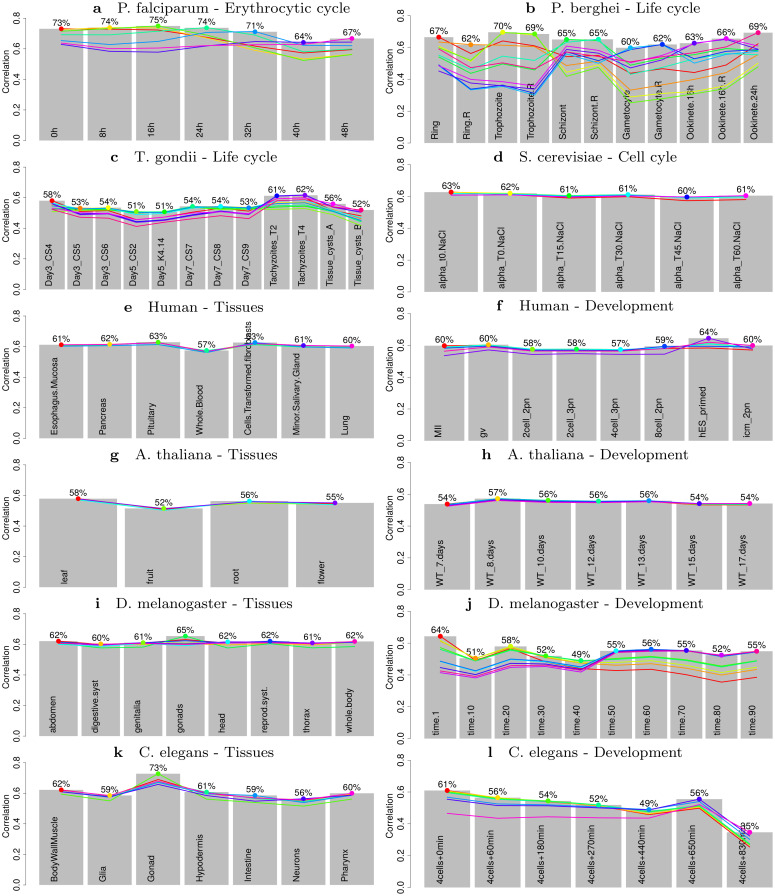
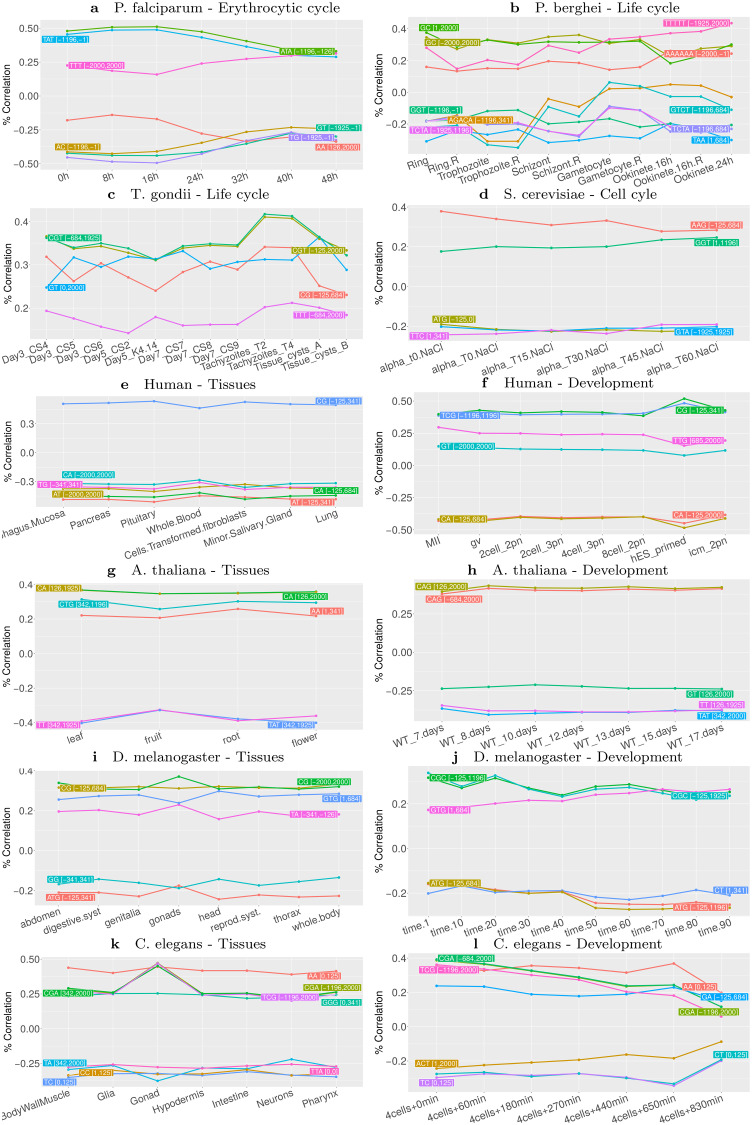
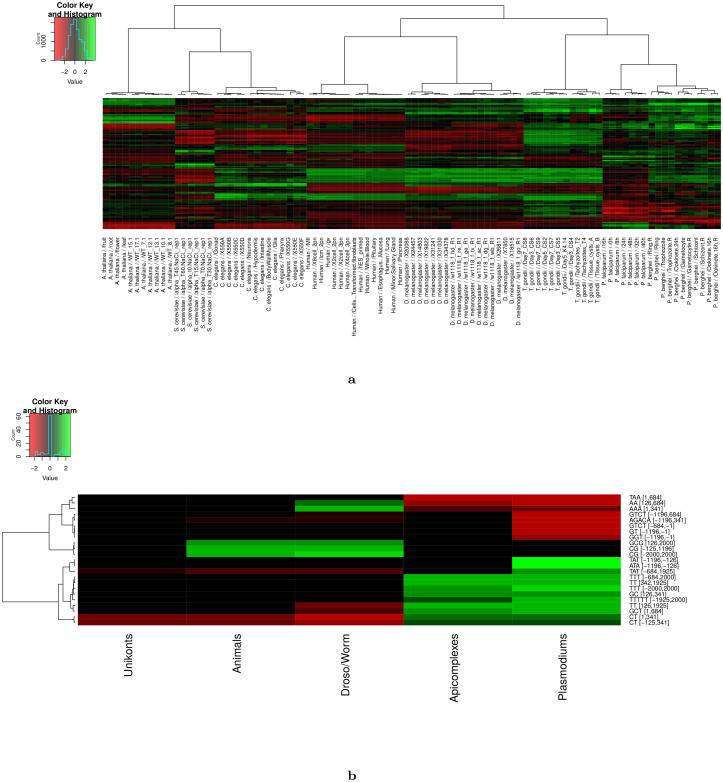
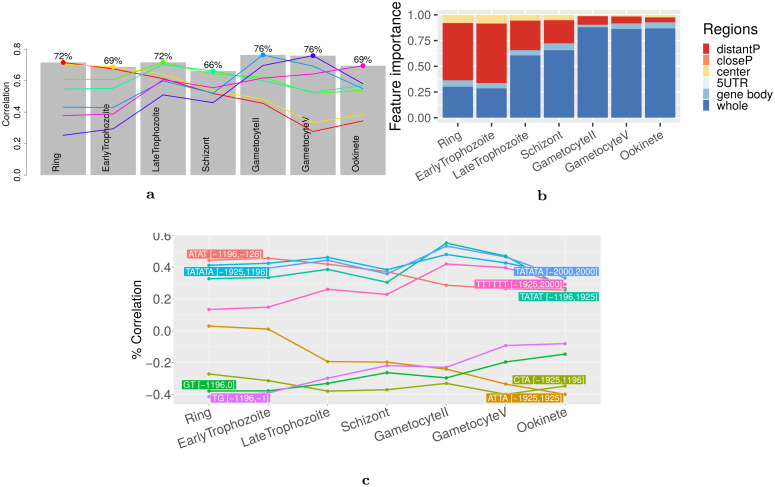
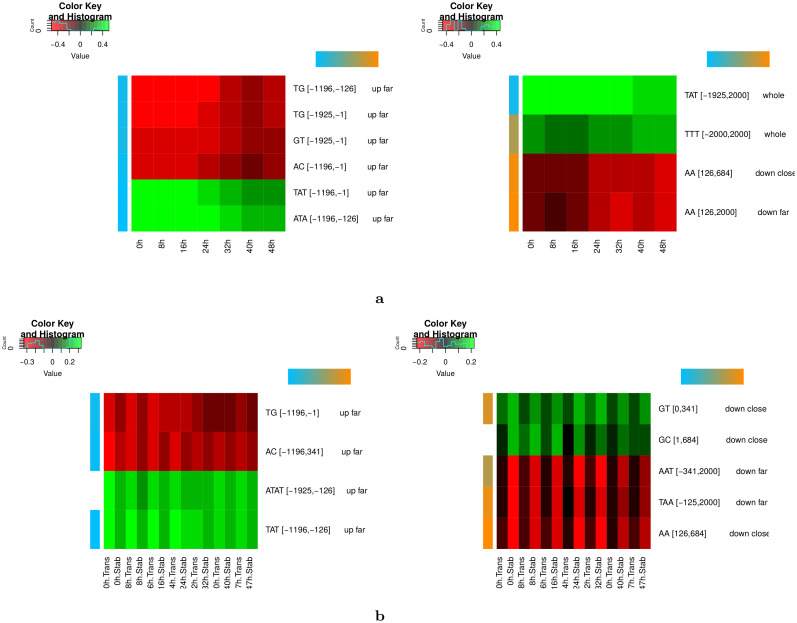
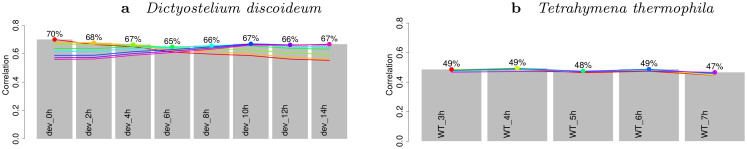
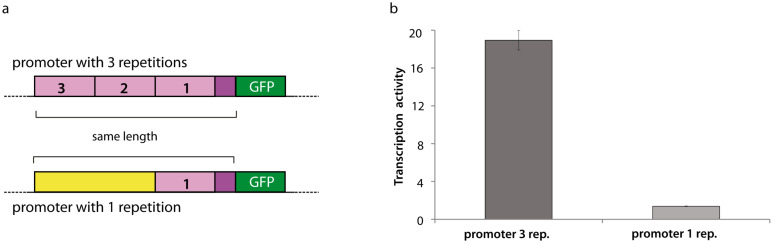
Long regulatory elements (LREs), such as CpG islands, polydA:dT tracts or AU-rich elements, are thought to play key roles in gene regulation but, as opposed to conventional binding sites of transcription factors, few methods have been proposed to formally and automatically characterize them. We present here a computational approach named DExTER (Domain Exploration To Explain gene Regulation) dedicated to the identification of candidate LREs (cLREs) and apply it to the analysis of the genomes of P. falciparum and other eukaryotes. Our analyses show that all tested genomes contain several cLREs that are somewhat conserved along evolution, and that gene expression can be predicted with surprising accuracy on the basis of these long regions only. Regulation by cLREs exhibits very different behaviours depending on species and conditions. In P. falciparum and other Apicomplexan organisms as well as in Dictyostelium discoideum, the process appears highly dynamic, with different cLREs involved at different phases of the life cycle. For multicellular organisms, the same cLREs are involved in all tissues, but a dynamic behavior is observed along embryonic development stages. In P. falciparum, whose genome is known to be strongly depleted of transcription factors, cLREs are predictive of expression with an accuracy above 70%, and our analyses show that they are associated with both transcriptional and post-transcriptional regulation signals. Moreover, we assessed the biological relevance of one LRE discovered by DExTER in P. falciparum using an in vivo reporter assay. The source code (python) of DExTER is available at https://gite.lirmm.fr/menichelli/DExTER.


Conflict of interest statement

The authors have declared that no competing interests exist.

Figures

Fig 1
Fig 1. The DExTER method.
In step 1, DExTER attempts to identify pairs of (k-mer,region) for which the frequency of the k-mer in the defined region is correlated with gene expression. DExTER starts with a 2-mer and compute a lattice (right) representing different regions. The top of the lattice represents the whole sequence, while lower nodes represent smaller regions. At each position, the correlation between 2-mer frequency and gene expression is computed, and regions with highest correlation are identified. For example, in the depicted lattice (which is the lattice associated with k-mer AT) the correlation between gene expression and AT frequency in region [-1241,-1] is 43.926%, while the correlation between expression and the AT frequency in region [513, 1241] is only 4.150%. Then, the 2-mer is extended to 3-mers, and the correlation with expression are computed in the best regions. If the correlation increases, the whole process is repeated with increasing k-mers. Otherwise, DExTER starts a new exploration from a different 2-mer, until every 2-mer has been explored. This way, different variables (i.e. pairs of (k-mers-regions)) are iteratively built (see an extract of the exploration graph on the left). In step 2, the frequency of all variables identified in step 1 are gathered into one long table. Then, a linear model predicting gene expression from a linear combination of the variables is learned. A special penalty function (LASSO) is used during training, for selecting only the best variables in the model (blue columns). If several gene expression data are available for one species (i.e. several y vectors), then step 1 is ran independently on each data, and all identified variables are gathered into a single table. Then, a linear model is learned for each data, but the different models are learned simultaneously with another penalty function that tends to select the same variables for the different data (group LASSO for multitask learning, see Materials and methods).
Fig 2
Fig 2. Accuracy of the DExTER models for predicting coding-gene expression in different species and conditions.
Grey charts represent the accuracy, measured as the correlation between predicted and observed gene expression, of the models learned on different conditions. Colored curves summarize the accuracy of a model learned on a specific condition (identified by a big dot of the same color) when used to predict the other conditions of the same series.
Fig 3
Fig 3. Lengths and frequencies of the variables identified in the different species and conditions.
The left histogram reports the distribution of k-mer lengths of the most important variables identified in all species and conditions, while the middle histogram reports the distribution of region lengths of these variables. The right histogram reports the median number of occurrences of the identified k-mers in the identified regions in all studied sequences of the different species.
Fig 4
Fig 4. Correlations between expression and k-mer frequency of the most important variables identified in the different species and conditions.
For each expression series, the 5 most important variables of each condition were identified, and their correlation to expression were computed for all conditions of the series. The name of the variables has been shortened for readability: for example the variable ATA [-1196,-126] is actually the frequency of k-mer ATA in region [-1196,-126]. Note that there are often more than 5 variables in these figures because the 5 most important variables may vary depending on conditions.
Fig 5
Fig 5. Relative importance of promoter, untranslated and coding regions for predicting gene expression in different species and conditions.
For each condition, the 30 most important variables of the model were identified and a usage statistic reflecting the importance of the variables for the prediction was computed (see Materials and methods). Then, each variable was associated with one gene region (6 different regions were considered: distal and proximal promoters, center, 5’UTR, gene body, or whole; see Materials and methods), and the usage statistics of the variables that belong to the same region were cumulated.
Fig 6
Fig 6. Conservation of long regulatory elements along evolution.
The 10 most important variables of each species and conditions were identified and collected, and their correlations with expression were computed for every species and conditions. Correlations were then normalized by conditions (i.e. correlations were divided by the standard deviation of all correlations computed for the condition) to get the same range of values for each condition. a A hierarchical clustering (Ward’s criterion) was run to classify the conditions according to these correlations. b The heatmap represents the variables whose correlation with expression is conserved at the level of at least one of five different taxa. The variables that do not show conservation of correlation at any of the 5 taxa have been removed for readability.
Fig 7
Fig 7. Importance of cLREs along the whole life of P. falciparum.
a Grey charts represent the accuracy, measured as the correlation between predicted and observed gene expression, of the models learned on different phases of P. falciparum life cycle. Colored curves summarize the accuracy of a model learned on a specific phase when used to predict gene expression of other phases. b Estimate of the importance of upstream, downstream, center and whole regions for predicting gene expression in the different phases. c Correlations between expression and k-mer frequency of the 5 most important variables identified at each phase. Because the most important variables vary depending on conditions, the total number of variables is > 5 in this figure.
Fig 8
Fig 8. Strand specificity of cLREs and links with post-transcriptional signals in P. falciparum intraerythrocytic cycle.
a Heatmaps of correlations between gene expression and most important features identified at each time point of Otto et al. (2010) data. The left heatmap corresponds to features with higher correlation in early time points (0h—16h), while the right heatmap corresponds to features with higher correlation with late time points (24h—48h). The strand specificity of each variable is represented with a color code that goes from blue (no strand specificity) to orange (high strand specificity). b Heatmaps of correlations between gene expression and most important features identified at each time point of Painter et al. (2018) data. The left heatmap corresponds to features with higher correlation with transcription data, while the right heatmap corresponds to features with higher correlation with stabilization data.
Fig 9
Fig 9. DExTER accuracy on D. discoideum and T. thermophila, two other genomes with high AT content.
Grey charts represent the accuracy (y-axes), measured as the correlation between predicted and observed gene expression, of the models learned on different conditions (x-axes). Colored curves summarize the accuracy of a model learned on a specific condition (identified by a big dot of the same color) when used to predict the other conditions of the series.
Fig 10
Fig 10. In vivo experimental validation in P. falciparum.
a Schematic of the chimeric promoters used in our report assay to monitor promoter activity. b Transcriptional activity quatification by qPCR analysis of RNA collected at ring stages parasites. Here, one representative transgenic parasite clone. See Materials and methods for details.

Similar articles

Cited by

References

    1. Toenhake CG, Fraschka SAK, Vijayabaskar MS, Westhead DR, van Heeringen SJ, Bártfai R. Chromatin Accessibility-Based Characterization of the Gene Regulatory Network Underlying Plasmodium falciparum Blood-Stage Development. Cell Host & Microbe. 2018. April;23(4):557–569.e9. 10.1016/j.chom.2018.03.007 - DOI - PMC - PubMed
    1. Flueck C, Bartfai R, Niederwieser I, Witmer K, Alako BTF, Moes S, et al.. A major role for the Plasmodium falciparum ApiAP2 protein PfSIP2 in chromosome end biology. PLoS pathogens. 2010. February;6(2):e1000784. 10.1371/journal.ppat.1000784 - DOI - PMC - PubMed
    1. Kafsack BFC, Rovira-Graells N, Clark TG, Bancells C, Crowley VM, Campino SG, et al.. A transcriptional switch underlies commitment to sexual development in malaria parasites. Nature. 2014. March;507(7491):248–252. 10.1038/nature12920 - DOI - PMC - PubMed
    1. Modrzynska K, Pfander C, Chappell L, Yu L, Suarez C, Dundas K, et al.. A Knockout Screen of ApiAP2 Genes Reveals Networks of Interacting Transcriptional Regulators Controlling the Plasmodium Life Cycle. Cell Host & Microbe. 2017. January;21(1):11–22. Available from: https://www.ncbi.nlm.nih.gov/pmc/articles/PMC5241200/. 10.1016/j.chom.2016.12.003 - DOI - PMC - PubMed
    1. Santos JM, Josling G, Ross P, Joshi P, Orchard L, Campbell T, et al.. Red Blood Cell Invasion by the Malaria Parasite Is Coordinated by the PfAP2-I Transcription Factor. Cell Host & Microbe. 2017. June;21(6):731–741.e10. 10.1016/j.chom.2017.05.006 - DOI - PMC - PubMed

Publication types

LinkOut - more resources