. 2021 Apr 16;16(4):e0250285.
doi: 10.1371/journal.pone.0250285. eCollection 2021.

Impact of smoke-free ordinance strength on smoking prevalence and lung cancer incidence

Affiliations

Impact of smoke-free ordinance strength on smoking prevalence and lung cancer incidence

Ryan H Nguyen et al. PLoS One. .

Abstract

Background: Smoke-free ordinances (SFO) have been shown to be effective public health interventions, but there is limited data on the impact SFO on lung cancer outcomes. We explored the effect of county-level SFO strength with smoking prevalence and lung cancer incidence in Indiana.

Methods: We obtained county-level lung cancer incidence from the Indiana State Cancer Registry and county-level characteristics from the Indiana Tobacco Prevention and Cessation Commission's policy database between 1995 and 2016. Using generalized estimating equations, we performed multivariable analyses of smoking prevalence and age-adjusted lung cancer rates with respect to the strength of smoke-free ordinances at the county level over time.

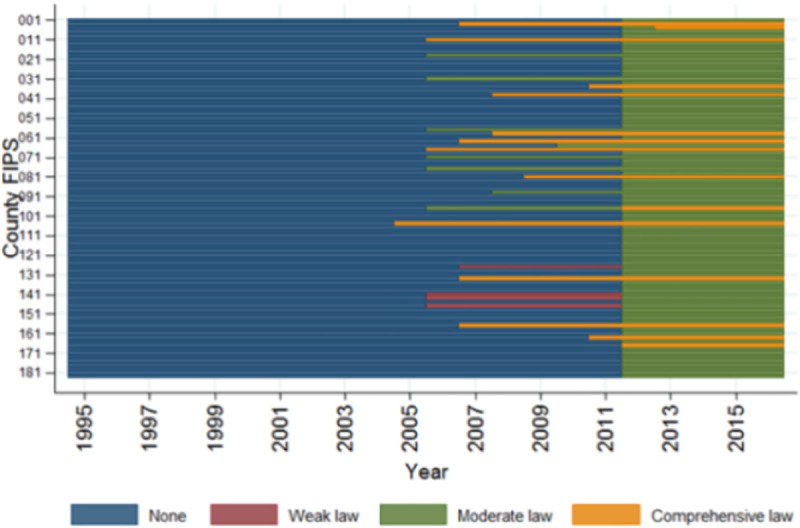
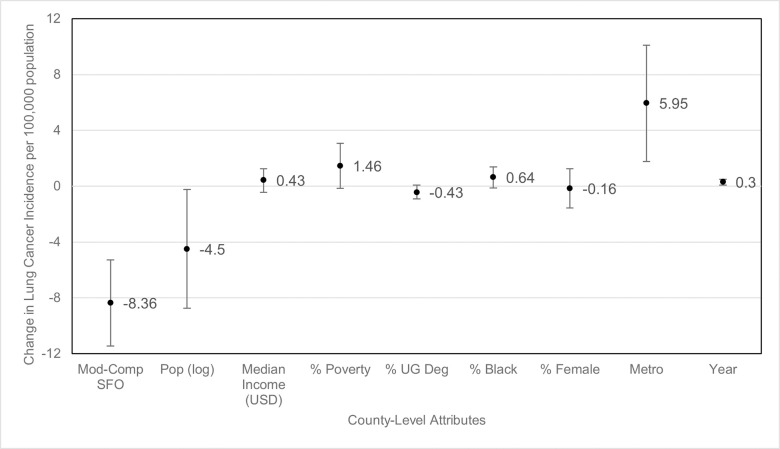
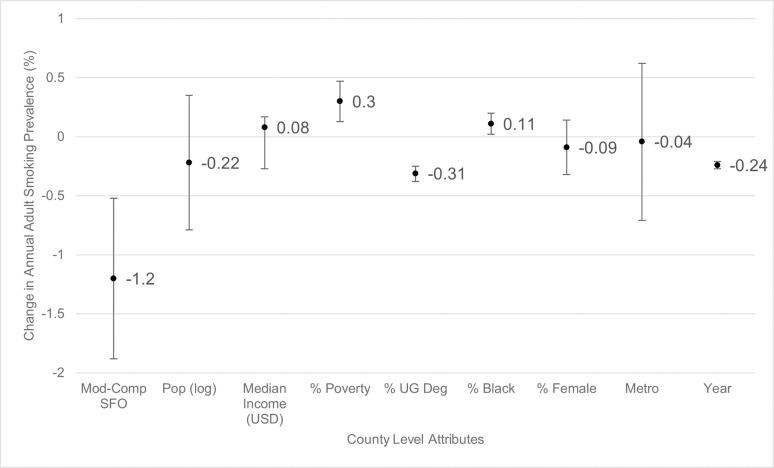
Results: Of Indiana's 92 counties, 24 had a SFO by 2011. In 2012, Indiana enacted a state-wide SFO enforcing at least moderate level SFO protection. Mean age-adjusted lung cancer incidence per year was 76.8 per 100,000 population and mean smoking prevalence per year was 25% during the study period. Counties with comprehensive or moderate SFO had a smoking prevalence 1.2% (95% CI [-1.88, -0.52]) lower compared with counties with weak or no SFO. Counties that had comprehensive or moderate SFO also had an 8.4 (95% CI [-11.5, -5.3]) decrease in new lung cancer diagnosis per 100,000 population per year compared with counties that had weak or no SFO.

Conclusion: Counties with stronger smoke-free air ordinances were associated with decreased smoking prevalence and fewer new lung cancer cases per year. Strengthening SFO is paramount to decreasing lung cancer incidence.


Conflict of interest statement

No authors have competing interests.

Figures

Fig 1
Fig 1. Transitions of Indiana municipal smoke-free ordinances, 1995–2016.
FIPS = federal information processing standard code which identifies counties.
Fig 2
Fig 2. Change in lung cancer incidence by county-level attributes.
Mod-Comp SFO = moderate-to-comprehensive smoke-free ordinance, pop (log) = population log, % UG Deg = percent with undergraduate degree. Circles represent estimated change in lung cancer incidence and bars represent 95% confidence intervals. “Moderate to comprehensive smoke-free ordinances” change is calculated relative to none or weak smoke-free ordinance counties. “Population (log)” change is calculated based on each 10% increase in population. For continuous predictor values, circles represent estimated change based on 1% increase in corresponding characteristic (e.g., for each 1% in poverty, the lung cancer incidence increases by 0.3%) except for “Median Income (USD)” which is estimated as change based on an increase of $1,000 and “year,” for which change is estimated based on an increase of 1 year. For “metro”, change is calculated as counties classified as metropolitan versus rural.
Fig 3
Fig 3. Change in smoking prevalence by county-level attributes.
Mod-Comp SFO = moderate-to-comprehensive smoke-free ordinance, pop (log) = population log, % UG Deg = percent with undergraduate degree. Circles represent estimated change in smoking prevalence and bars represent 95% confidence intervals. “Moderate to comprehensive smoke-free ordinances” change is calculated relative to none or weak smoke-free ordinance counties. “Population (log)” change is calculated based on each 10% increase in population. For continuous predictor values, circles represent estimated change based on 1% increase in corresponding characteristic (e.g., for each 1% in poverty, the smoking prevalence increases by 0.3%) except for “Median Income (USD)” which is estimated as change based on an increase of $1,000 and “year,” for which change is estimated based on an increase of 1 year. For “metro”, change is calculated as counties classified as metropolitan versus rural.

Similar articles

Cited by

References

    1. Siegel RL, Miller KD, Jemal A. Cancer statistics, 2015. CA: a cancer journal for clinicians. 2015;65(1):5–29. Epub 2015/01/07. 10.3322/caac.21254 . - DOI - PubMed
    1. National Center for Chronic Disease P, Health Promotion Office on S, Health. Reports of the Surgeon General. The Health Consequences of Smoking-50 Years of Progress: A Report of the Surgeon General. Atlanta (GA): Centers for Disease Control and Prevention (US); 2014.
    1. Lortet-Tieulent J, Goding Sauer A, Siegel RL, Miller KD, Islami F, Fedewa SA, et al.. State-Level Cancer Mortality Attributable to Cigarette Smoking in the United States. JAMA internal medicine. 2016;176(12):1792–8. Epub 2016/10/25. 10.1001/jamainternmed.2016.6530 . - DOI - PubMed
    1. Xu X, Bishop EE, Kennedy SM, Simpson SA, Pechacek TF. Annual healthcare spending attributable to cigarette smoking: an update. American journal of preventive medicine. 2015;48(3):326–33. Epub 2014/12/17. 10.1016/j.amepre.2014.10.012 - DOI - PMC - PubMed
    1. Centers for Disease Control and Prevention NCfCDPaHP, Division of Population Health. BRFSS Prevalence & Trends Data. 2015.

Substances