. 2021 May;15(3):101-109.
doi: 10.1049/syb2.12018. Epub 2021 Apr 16.

Bifurcation analyses and potential landscapes of a cortex-basal ganglia-thalamus model

Affiliations

Bifurcation analyses and potential landscapes of a cortex-basal ganglia-thalamus model

Chenri Yan et al. IET Syst Biol. 2021 May.

Abstract

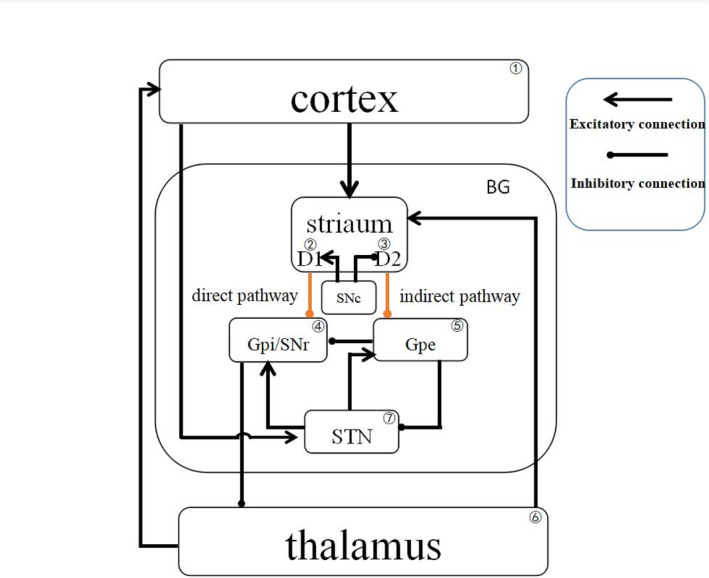
The dynamics of cortical neuronal activity plays important roles in controlling body movement and is regulated by connection weights between neurons in a cortex-basal ganglia-thalamus (BGCT) loop. Beta-band oscillation of cortical activity is closely associated with the movement disorder of Parkinson's disease, which is caused by an imbalance in the connection weights of direct and indirect pathways in the BGCT loop. In this study, the authors investigate how the dynamics of cortical activity are modulated by connection weights of direct and indirect pathways in the BGCT loop under low dopamine levels through bifurcation analyses and potential landscapes. The results reveal that cortical activity displays rich dynamics under different connection weights, including one, two, or three stable steady states, one or two stable limit cycles, and the coexistence of one stable limit cycle with one stable steady state or two stable ones. For a low dopamine level, cortical activity exhibits oscillation for larger connection weights of direct and indirect pathways. The stability of these stable dynamics is explored by the potential landscapes.


Figures

FIGURE 1
FIGURE 1
An illustration of the cortex–basal ganglia–thalamus loop regulated by dopamine from the substantia nigra pars compacta (SNc). Three loops are included, that is, the superdirect loop of Ctx‐STN‐GPi‐TH‐Ctx, the direct loop of Ctx‐D1‐GPi‐TH‐Ctx, and the indirect loop of Ctx‐D2‐GPe‐STN‐GPi‐TH‐Ctx. Arrow‐headed and solid‐circle‐headed solid lines represent excitatory and inhibitory connections, respectively
FIGURE 2
FIGURE 2
(a)–(f) Typical codimension‐one bifurcation diagrams of cortical activity versus T 42 at given T 53. In all diagrams, red solid lines and black dashed lines represent stable and unstable equilibria, respectively. The green open circles are the maxima and minima of stable limit cycles. F i (i = 1–5) are the fold bifurcation points of the equilibria. H i (i = 1–4) represents the Hopf bifurcation points
FIGURE 3
FIGURE 3
Codimension‐two bifurcation diagram with respect to the parameters T 42 and T 53. The parameter plane (T 42, T 53) is divided into 12 regions by codimension‐one bifurcation curves f i (i = 1–5) and h i (i = 1–4). f i is the fold bifurcation point of the equilibria, h i is the supercritical Hopf bifurcation point, and CP i is the Cusp point of codimension‐two bifurcation
FIGURE 4
FIGURE 4
(a)–(l) Phase diagrams of regions I–XII in Figure 3. The red solid dots and black circles represent stable and unstable equilibria, respectively; The blue solid lines denote stable limit cycles
FIGURE 5
FIGURE 5
(a)–(l) Typical time series of cortical activity in regions I–XII of Figure 3. Stable dynamics in each region are given through changing initial values. Parameters T 42 and T 53 are the same as those in Figure 4
FIGURE 6
FIGURE 6
(a)–(l) The potential landscapes for 12 regions in Figure 3. Arrows with S point to the stable steady states, and irregular closed rings represent stable limit cycles. The parameters in each region are the same as those in Figure 4 and D = 1 × 10⁻⁶
FIGURE 7
FIGURE 7
Codimension‐two bifurcation diagram with respect to the parameters T 45 and T 47. The parameter plane (T 45, T 47) is divided into six regions by curves f i (i = 1∼6) and h i (i = 1∼2). f i is the fold bifurcation point of the equilibria, h i is the supercritical Hopf bifurcation point, and CP i is the Cusp point of codimension‐two bifurcation

References

    1. Andrĺę, P. , Hazrati, L.N. : Functional anatomy of the basal ganglia. I. The cortico‐basal ganglia‐thalamo‐cortical loop. Brain Res. Rev. 20(1), 91–127 (1995) - PubMed
    1. Mallet, N. , et al.: Cortical inputs and GABA interneurons imbalance projection neurons in the striatum of parkinsonian rats. J. Neurosci. 26(14), 3875–3884 (2006) - PMC - PubMed
    1. Brown, P. : Abnormal oscillatory synchronisation in the motor system leads to impaired movement. Curr. Opin. Neurobiol. 17(6), 656–664 (2007) - PubMed
    1. Albin, R.L. , Young, A.B. , Penney, J.B. : The functional anatomy of basal ganglia disorders. Trends Neurosci. 12(10), 366–375 (1989) - PubMed
    1. Terman, D. , et al.: Activity patterns in a model for the subthalamopallidal network of the basal ganglia. J. Neurosci. 22(7), 2963–2976 (2002) - PMC - PubMed

Publication types

LinkOut - more resources