. 2021 Jun:107:101-115.
doi: 10.1016/j.ijid.2021.04.015. Epub 2021 Apr 13.

Excess deaths associated with the Iranian COVID-19 epidemic: A province-level analysis

Affiliations

Excess deaths associated with the Iranian COVID-19 epidemic: A province-level analysis

Mahan Ghafari et al. Int J Infect Dis. 2021 Jun.

Abstract

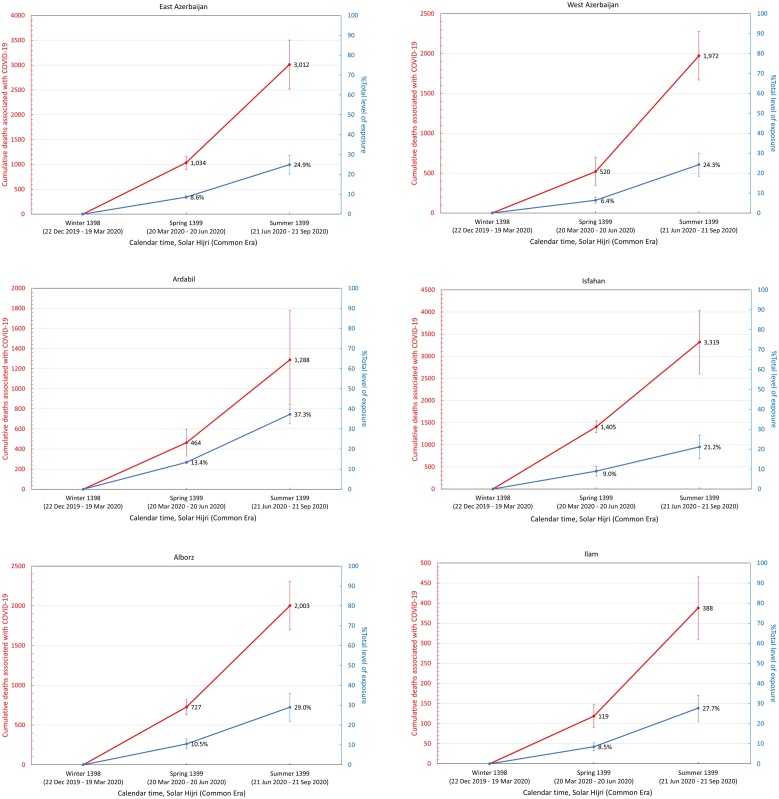
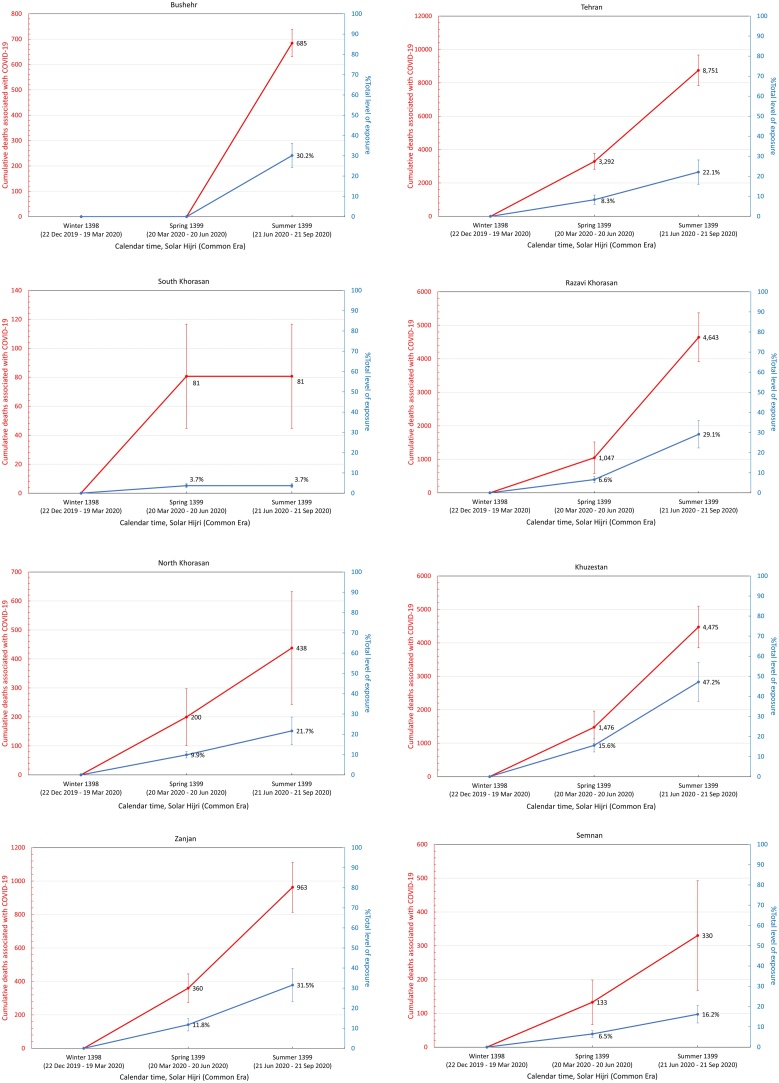
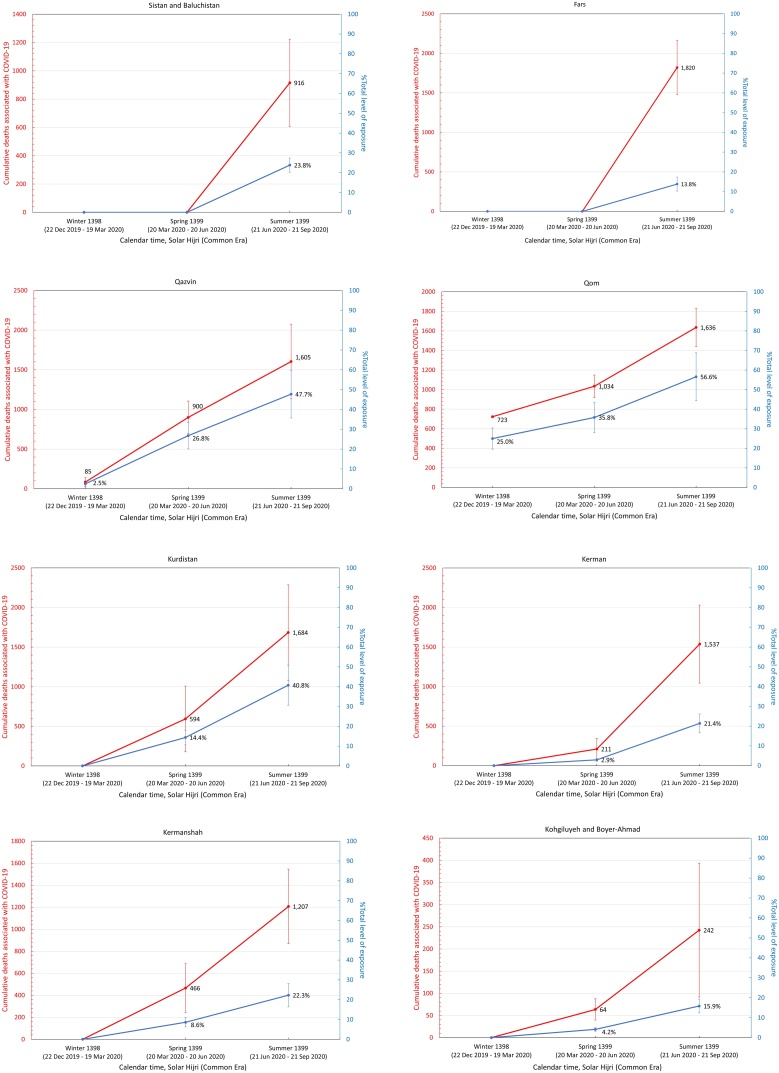
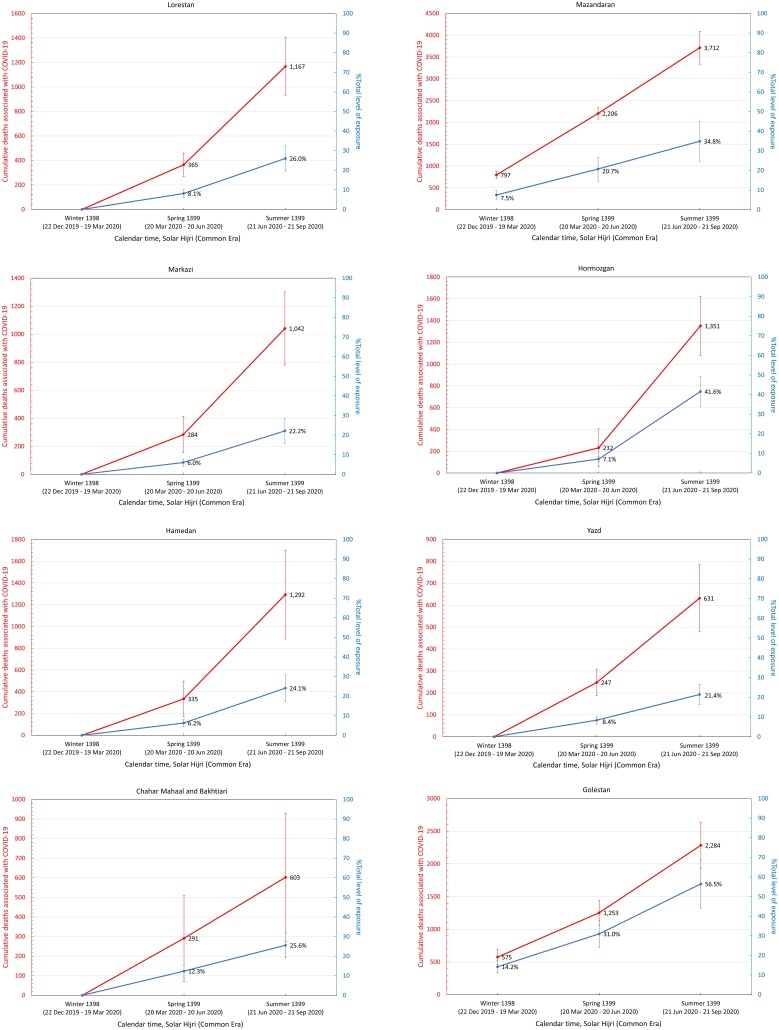
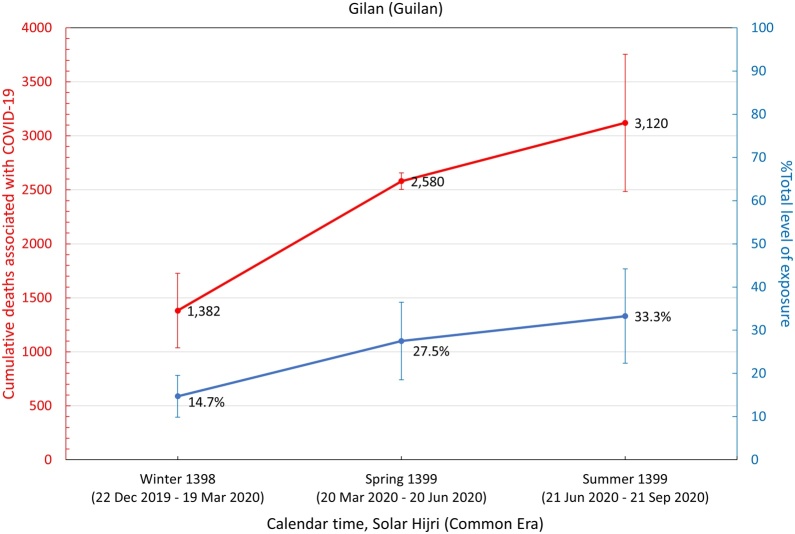
Objective: There has been no province-level data on the number of coronavirus disease 2019 (COVID-19)-related deaths in Iran since the start of the pandemic. This study was performed to estimate the number of COVID-19 deaths and population-level exposure per province using seasonal all-cause mortality data.

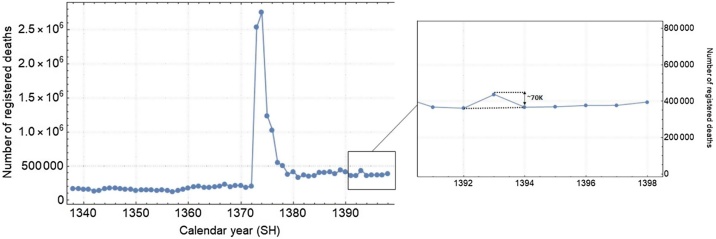
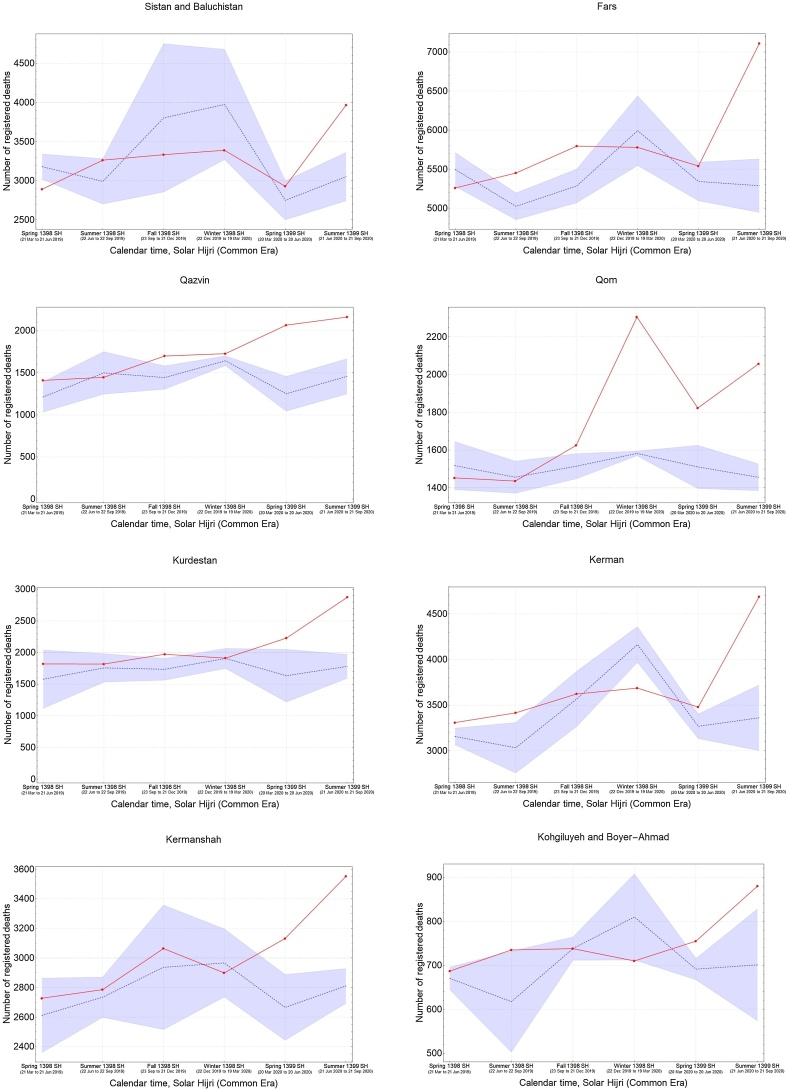
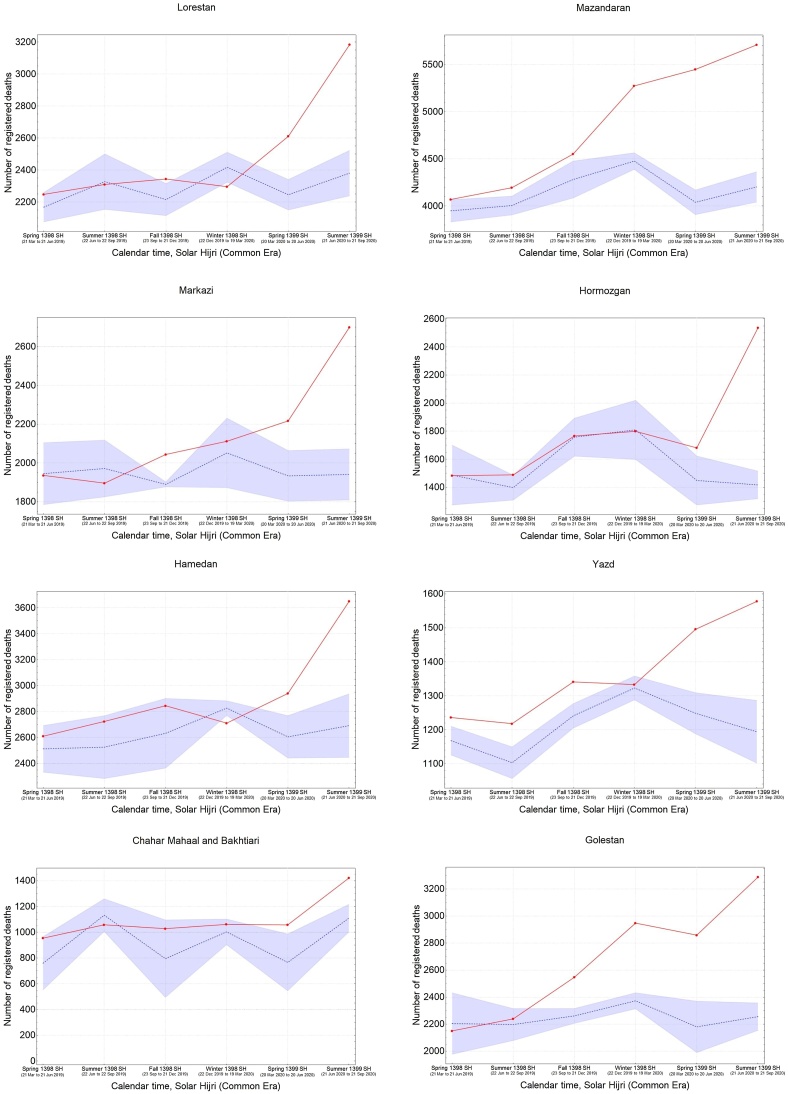
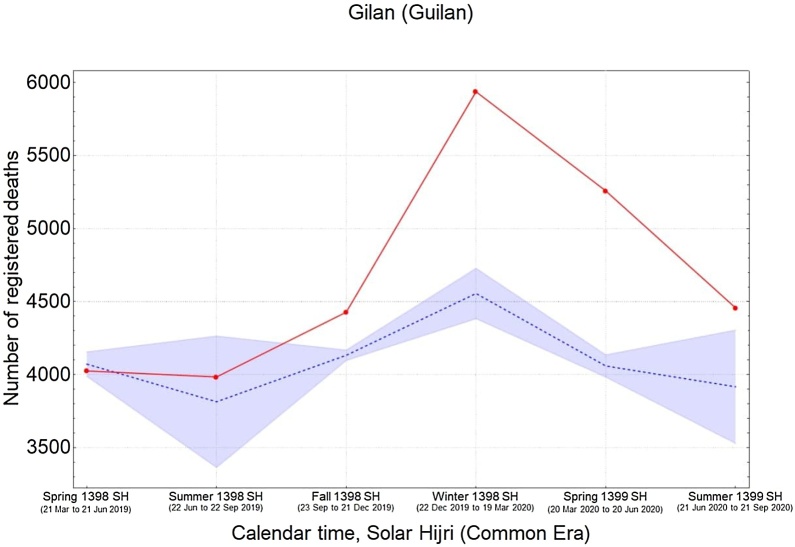
Methods: Time-series data were collected from the National Organization for Civil Registration on the seasonal all-cause mortality from spring 2015 to summer 2020 (from March 21, 2015 to September 21, 2020), in accordance with the Solar Hijri (SH) calendar, to estimate the expected number of seasonal deaths for each province using a piecewise linear regression model. A population-weighted infection fatality ratio was then applied to estimate the level of exposure per province during this period.

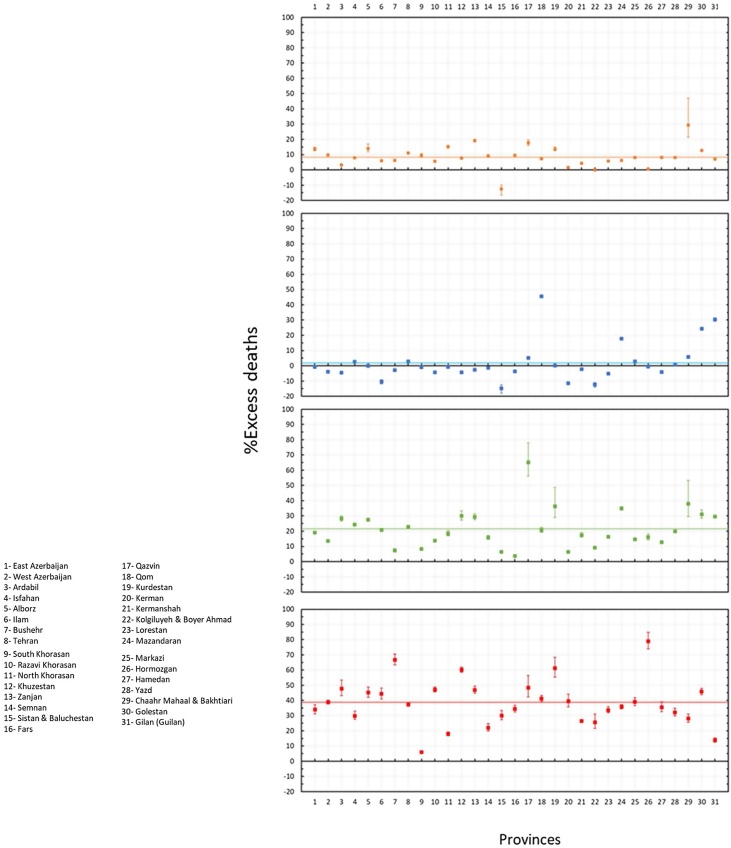
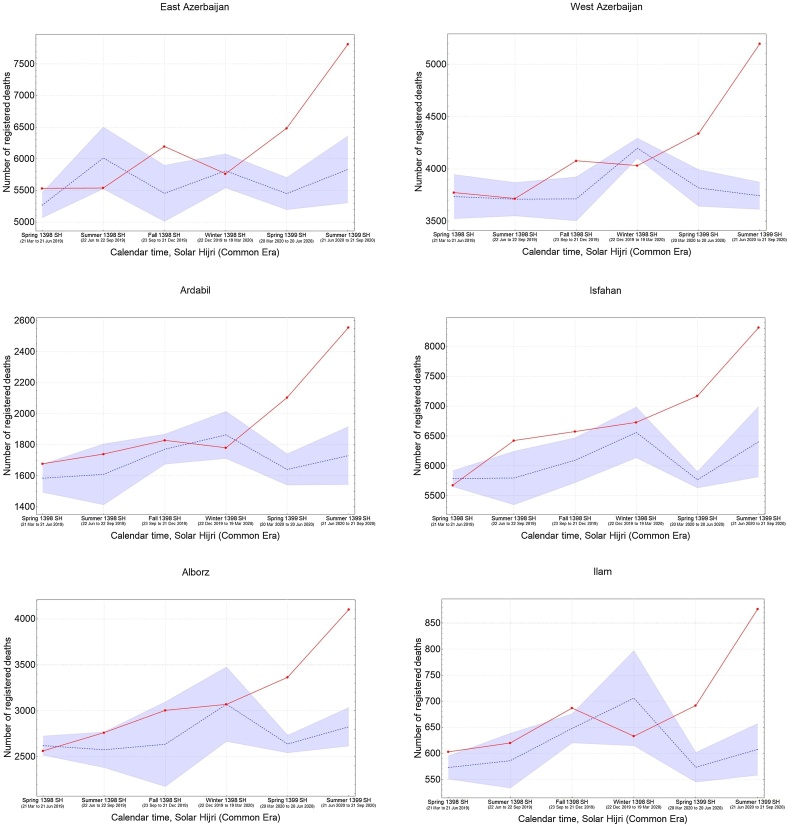
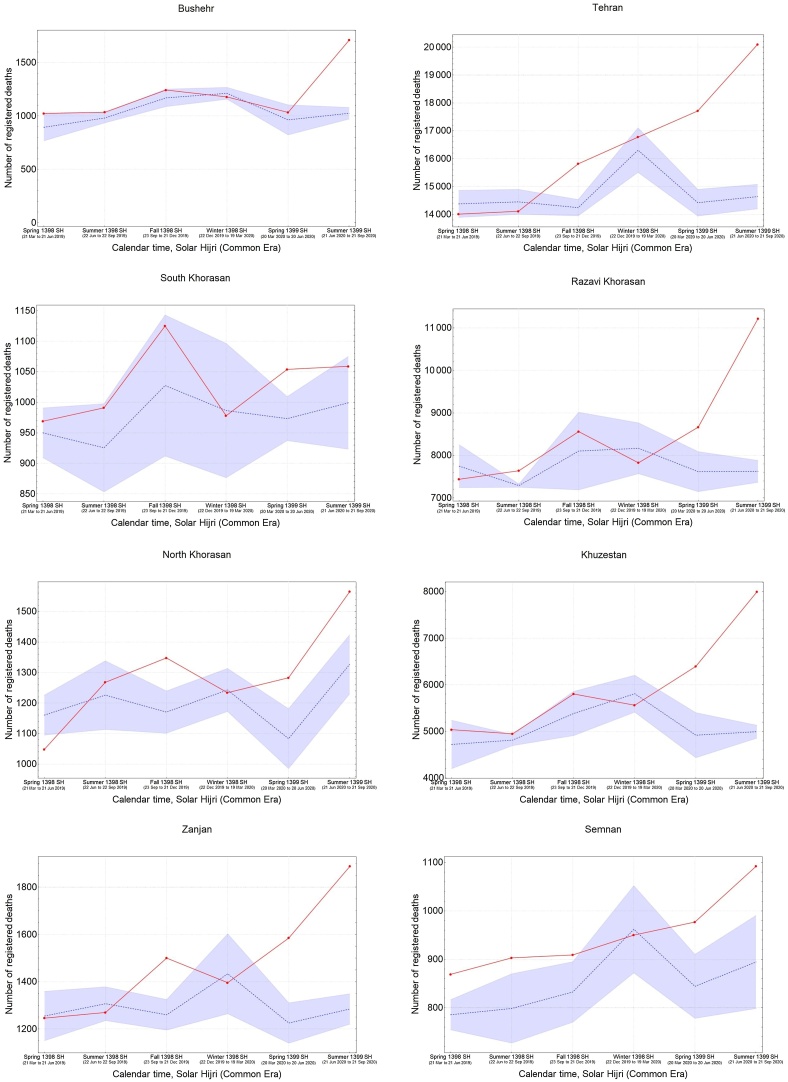
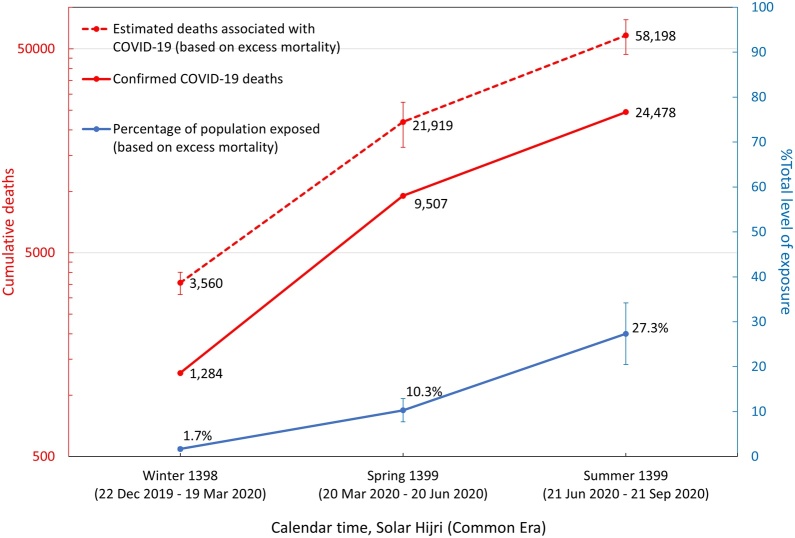
Results: From the start of winter to the end of summer (from December 22, 2019 to September 21, 2020), there were a total of 58 900 (95% confidence interval 46 900-69 500) excess deaths across all 31 provinces, with 27% (95% confidence interval 20-34%) estimated nationwide exposure to severe acute respiratory syndrome coronavirus 2 (SARS-CoV-2). In particular, Qom and Golestan were among the hardest-hit provinces, with nearly 57% exposure, while another 27 provinces showed significant levels of excess mortality in at least one season with >20% population-level exposure to the virus. Unexpectedly high levels of excess mortality were also detected during fall 2019 (from September 23 to December 21, 2019) across 18 provinces, unrelated and prior to the start of the COVID-19 pandemic.

Conclusions: This study quantified the pattern of spread of COVID-19 across the country and identified areas with the largest epidemic growth requiring the most immediate interventions.

Keywords: COVID-19; Excess mortality; Infection fatality ratio; Iran; SARS-CoV-2.


Figures

Figure 1
Figure 1
Annual number of registered deaths in Iran over the last 70 years (data from the National Organization for Civil Registration). The inset shows the variation in registered deaths during the more recent years; this appears to have stabilized, with the exception of year 1393 SH, in which there were approximately 70 000 deaths above baseline.
Figure 2
Figure 2
Percentage of excess deaths (compared to the background level) in the fall of 1398 SH (from September 23 to December 21, 2019), winter of 1398 SH (from December 22 to March 19, 2020), spring of 1399 SH (from March 20 to June 20, 2020), and summer of 1399 SH (from June 21 to September 21, 2020). The horizontal solid lines show the mean percentage of excess mortality in the fall (orange), winter (blue), spring (green), and summer (red).
Figure 3
Figure 3
The pattern of excess mortality from spring 1398 SH (March 21, 2019) to summer 1399 SH (September 21, 2020) in each province.
Figure 3
Figure 3
The pattern of excess mortality from spring 1398 SH (March 21, 2019) to summer 1399 SH (September 21, 2020) in each province.
Figure 3
Figure 3
The pattern of excess mortality from spring 1398 SH (March 21, 2019) to summer 1399 SH (September 21, 2020) in each province.
Figure 3
Figure 3
The pattern of excess mortality from spring 1398 SH (March 21, 2019) to summer 1399 SH (September 21, 2020) in each province.
Figure 3
Figure 3
The pattern of excess mortality from spring 1398 SH (March 21, 2019) to summer 1399 SH (September 21, 2020) in each province.
Figure 4
Figure 4
Cumulative number of COVID-19-related deaths (red) and total fraction of individuals exposed to SARS-CoV-2 (blue) in each province from winter 1398 SH to summer 1399 SH.
Figure 4
Figure 4
Cumulative number of COVID-19-related deaths (red) and total fraction of individuals exposed to SARS-CoV-2 (blue) in each province from winter 1398 SH to summer 1399 SH.
Figure 4
Figure 4
Cumulative number of COVID-19-related deaths (red) and total fraction of individuals exposed to SARS-CoV-2 (blue) in each province from winter 1398 SH to summer 1399 SH.
Figure 4
Figure 4
Cumulative number of COVID-19-related deaths (red) and total fraction of individuals exposed to SARS-CoV-2 (blue) in each province from winter 1398 SH to summer 1399 SH.
Figure 4
Figure 4
Cumulative number of COVID-19-related deaths (red) and total fraction of individuals exposed to SARS-CoV-2 (blue) in each province from winter 1398 SH to summer 1399 SH.
Figure 5
Figure 5
Estimated number of deaths and exposures to COVID-19 based on excess mortality data from winter 1398 SH to summer 1399 SH. Confirmed COVID-19 deaths were collected from the daily reports of the Ministry of Health and Medical Education.

References

    1. Andersen K.G., Rambaut A., Lipkin W.I., Holmes E.C., Garry R.F. The proximal origin of SARS-CoV-2. Nat Med. 2020;26:450–452. doi: 10.1038/s41591-020-0820-9. - DOI - PMC - PubMed
    1. Beaney T., Clarke J.M., Jain V., Golestaneh A.K., Lyons G., Salman D. Excess mortality: the gold standard in measuring the impact of COVID-19 worldwide? J R Soc Med. 2020;113(9):329–334. - PMC - PubMed
    1. Brazeau N., Verity R., Jenks S., Fu H., Whittaker C., Winskill P. 2020. Report 34: COVID-19 infection fatality ratio: estimates from seroprevalence.
    1. Buss L.F., Prete C.A., Jr., Abrahim C.M.M., Mendrone A., Jr., Salomon T., de Almeida-Neto C. Three-quarters attack rate of SARS-CoV-2 in the Brazilian Amazon during a largely unmitigated epidemic. Science. 2020;371(6526):288–292. doi: 10.1126/science.abe9728. - DOI - PMC - PubMed
    1. Checchi F., Roberts L. In: Humanitarian Policy Group, editor. Vol. 52. Humanitarian Practice Network; 2005. (Interpreting and using mortality data in humanitarian emergencies).