. 2021 Jun:49:100948.
doi: 10.1016/j.dcn.2021.100948. Epub 2021 Mar 30.

Multimodal brain predictors of current weight and weight gain in children enrolled in the ABCD study ®

Affiliations

Multimodal brain predictors of current weight and weight gain in children enrolled in the ABCD study ®

Shana Adise et al. Dev Cogn Neurosci. 2021 Jun.

Abstract

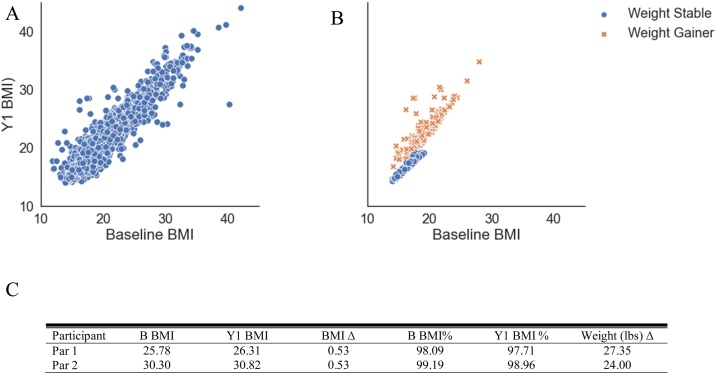
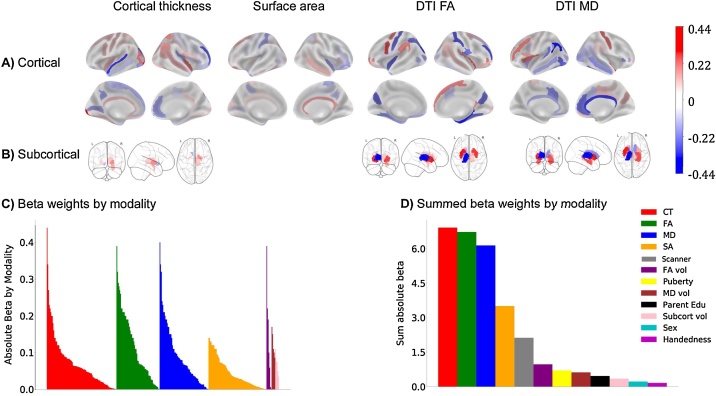
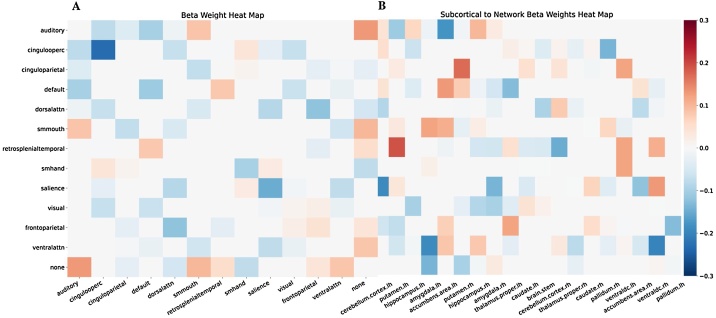
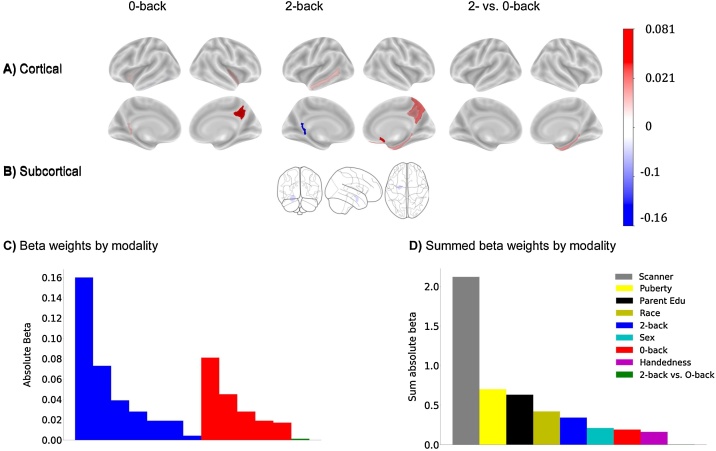
Multimodal neuroimaging assessments were utilized to identify generalizable brain correlates of current body mass index (BMI) and predictors of pathological weight gain (i.e., beyond normative development) one year later. Multimodal data from children enrolled in the Adolescent Brain Cognitive Development Study® at 9-to-10-years-old, consisted of structural magnetic resonance imaging (MRI), diffusion tensor imaging (DTI), resting state (rs), and three task-based functional (f) MRI scans assessing reward processing, inhibitory control, and working memory. Cross-validated elastic-net regression revealed widespread structural associations with BMI (e.g., cortical thickness, surface area, subcortical volume, and DTI), which explained 35% of the variance in the training set and generalized well to the test set (R2 = 0.27). Widespread rsfMRI inter- and intra-network correlations were related to BMI (R2train = 0.21; R2test = 0.14), as were regional activations on the working memory task (R2train = 0.20; (R2test = 0.16). However, reward and inhibitory control tasks were unrelated to BMI. Further, pathological weight gain was predicted by structural features (Area Under the Curve (AUC)train = 0.83; AUCtest = 0.83, p < 0.001), but not by fMRI nor rsfMRI. These results establish generalizable brain correlates of current weight and future pathological weight gain. These results also suggest that sMRI may have particular value for identifying children at risk for pathological weight gain.

Keywords: Childhood obesity; Inhibitory control; Machine-learning; Reward; Weight gain; Weight stability; fMRI.


Conflict of interest statement

The authors declare that they have no known competing financial interests or personal relationships that could have appeared to influence the work reported in this paper.

Figures

Fig. 1
Fig. 1
Distributions of weight and BMI change. A) Weight change distribution in pounds from baseline line to year 1. The red bar indicates children who lost weight and were excluded. The dashed line indicates the mean. The yellow dashed line represents one standard deviation above the mean, where the yellow box highlights the number of children who gained more than 20 pounds. B) Baseline BMI plotted against Y1 BMI coded for all children and by weight stable and weight gain children. This figure highlights that the weight gain group was distributed across all levels of baseline BMI and that not all children met the criteria for weight stable or weight gainer. C) Examples of two participants’. (For interpretation of the references to colour in this figure legend, the reader is referred to the web version of this article).
Fig. 2
Fig. 2
Beta weights from the elastic net regression for each ROI and modality associated with BMI at baseline. A) Cortical ROIs; B) Subcortical ROIs. The signs of the beta weights are in reference to each other and do not necessarily represent thickening or thinning. However, 64 % of the structural ROIs identified were negatively correlated with BMI indicating that BMI was associated with smaller cortical thickness, surface area, and lower FA and MD (data not shown). Subcortically, BMI was positively correlated with gray matter volumes and most subcortical FA and MD white matter estimates (data not shown). C) Absolute beta weights sorted by each ROI and modality from the baseline elastic net model. D) Summed average absolute beta weights from the elastic net regression indicate magnitude of each contributing structural modality. CT = cortical thickness; DTI = Diffusion tensor imaging; FA = fractional anisotropy; MD = mean diffusivity; vol = volume; Subcort = subcortical; Edu = parent reported highest education.
Fig. 3
Fig. 3
Connectivity networks that are associated with BMI. The colour bar indicates beta weighting from the elastic net regression A) Cortical to cortical network correlations; B) Cortical to subcortical network correlations. Cingulooperc = cingulo-operculum; dorsalattn = dorsal attention; smmouth = somatosensory mouth; smhand = somatosensory hand; ventralattn = ventral attention; Rh = right hemisphere; Lh = left hemisphere; None = the none network are regions that did not fit into a classified network.
Fig. 4
Fig. 4
Beta weights from the elastic net regression for each ROI for the EN-back predicting BMI at baseline. A) Cortical ROIs; B) Subcortical ROIs. The magnitudes of the beta weights are in reference to each other and do not necessarily represent increased or decreased activation, for example. C) Absolute beta weights sorted by each ROI and contrast from the baseline elastic net model. D) Summed average absolute beta weights from the elastic net regression to indicate magnitude of each contributing contrast. Edu = parent reported highest education.
Fig. 5
Fig. 5
Beta weights from the logistic elastic net regression for each ROI and structural modality predicting weight gain at the one year follow up. A) Cortical ROIs; B) Subcortical ROIs. The magnitudes of the beta weights are in reference to each other and do not necessarily represent thickening or thinning, for example. C) Absolute beta weights sorted by each ROI and modality from the weight gain at year 1 prediction elastic net model. D) Summed average absolute beta weights from the elastic net regression to indicate magnitude of each contributing structural modality. CT = cortical thickness; SA = Surface area; DTI = Diffusion tensor imaging; FA = Fractional anisotropy; MD = Mean diffusivity; vol = Volume. Edu = Parent highest reported edcatuon.

References

    1. Adise S., Geier C.F., Roberts N.J., White C.N., Keller K.L. Is brain response to food rewards related to overeating? A test of the reward surfeit model of overeating in children. Appetite. 2018;128(June):167–179. doi: 10.1016/j.appet.2018.06.014. - DOI - PMC - PubMed
    1. Adise S., Geier C.F., Roberts N.J., White C.N., Keller K.L. Food or money? Children’s brains respond differently to rewards regardless of weight status. Pediatr. Obes. 2019;14(2) doi: 10.1111/ijpo.12469. - DOI - PubMed
    1. Alosco M.L., Stanek K.M., Galioto R. Body mass index and brain structure in healthy children and adolescents. Int. J. Neurosci. 2014;124(1):49–55. doi: 10.3109/00207454.2013.817408. - DOI - PubMed
    1. Arango-Angarita A., Rodríguez-Ramírez S., Serra-Majem L., Shamah-Levy T. Dietary energy density and its association with overweight or obesity in adolescents: a systematic review of observational studies. Nutrients. 2018;10(11) doi: 10.3390/nu10111612. - DOI - PMC - PubMed
    1. Aron A.R., Robbins T.W., Poldrack R.A. Inhibition and the right inferior frontal cortex: one decade on. Trends Cogn. Sci. 2014;18(4):177–185. doi: 10.1016/j.tics.2013.12.003. - DOI - PubMed

Publication types

LinkOut - more resources