. 2021 Jul:71:102046.
doi: 10.1016/j.media.2021.102046. Epub 2021 Mar 31.

BS-Net: Learning COVID-19 pneumonia severity on a large chest X-ray dataset

Affiliations

BS-Net: Learning COVID-19 pneumonia severity on a large chest X-ray dataset

Alberto Signoroni et al. Med Image Anal. 2021 Jul.

Abstract

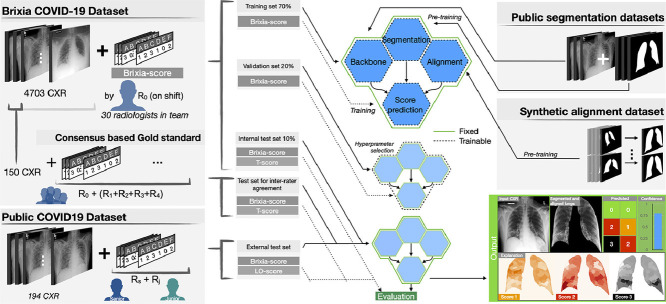
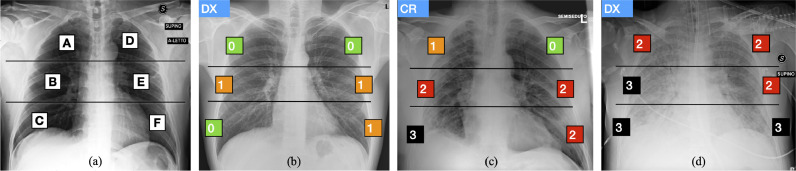
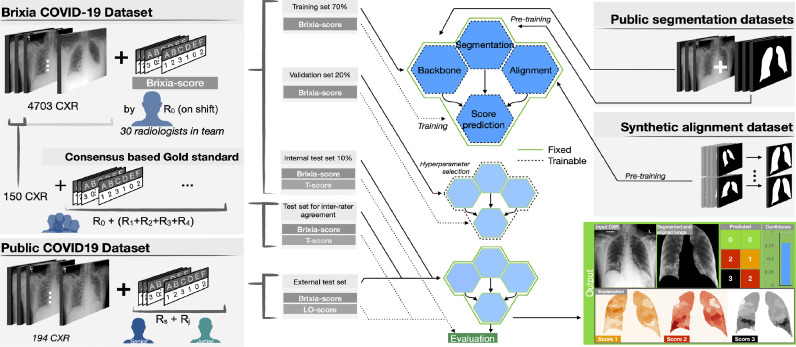
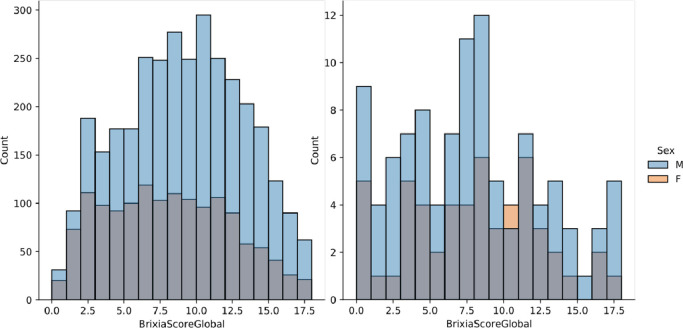
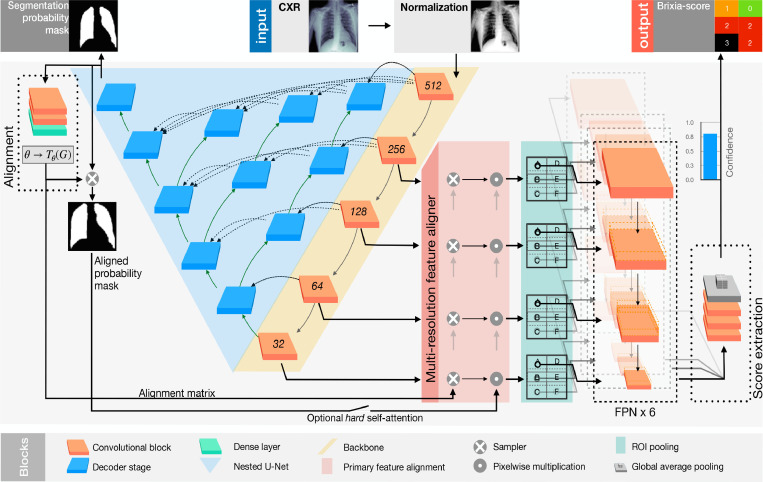
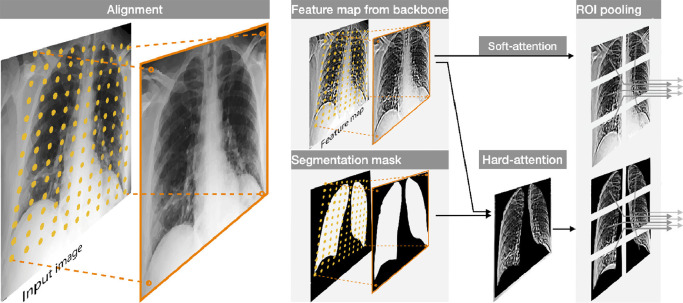
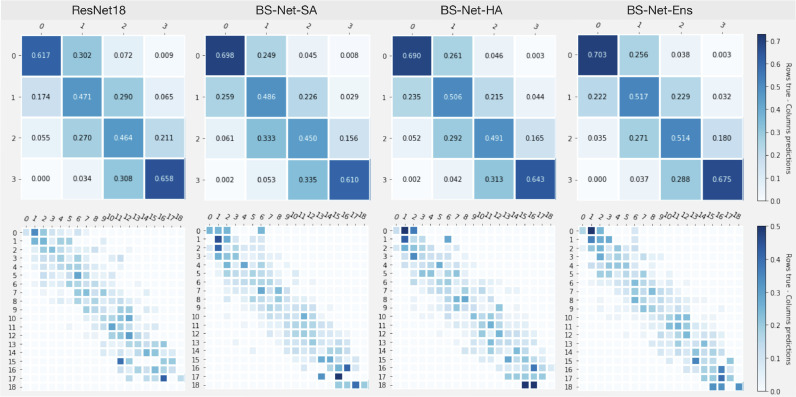
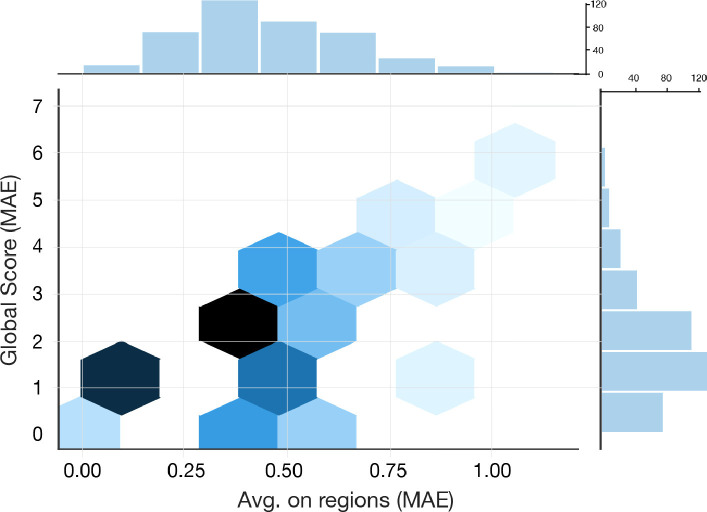
In this work we design an end-to-end deep learning architecture for predicting, on Chest X-rays images (CXR), a multi-regional score conveying the degree of lung compromise in COVID-19 patients. Such semi-quantitative scoring system, namely Brixia score, is applied in serial monitoring of such patients, showing significant prognostic value, in one of the hospitals that experienced one of the highest pandemic peaks in Italy. To solve such a challenging visual task, we adopt a weakly supervised learning strategy structured to handle different tasks (segmentation, spatial alignment, and score estimation) trained with a "from-the-part-to-the-whole" procedure involving different datasets. In particular, we exploit a clinical dataset of almost 5,000 CXR annotated images collected in the same hospital. Our BS-Net demonstrates self-attentive behavior and a high degree of accuracy in all processing stages. Through inter-rater agreement tests and a gold standard comparison, we show that our solution outperforms single human annotators in rating accuracy and consistency, thus supporting the possibility of using this tool in contexts of computer-assisted monitoring. Highly resolved (super-pixel level) explainability maps are also generated, with an original technique, to visually help the understanding of the network activity on the lung areas. We also consider other scores proposed in literature and provide a comparison with a recently proposed non-specific approach. We eventually test the performance robustness of our model on an assorted public COVID-19 dataset, for which we also provide Brixia score annotations, observing good direct generalization and fine-tuning capabilities that highlight the portability of BS-Net in other clinical settings. The CXR dataset along with the source code and the trained model are publicly released for research purposes.

Keywords: COVID-19 severity assessment; Chest X-rays; Convolutional neural networks; End-to-end learning; Semi-quantitative rating.


Conflict of interest statement

Declaration of Competing Interest The authors declare that they have no known competing financial interests or personal relationships that could have appeared to influence the work reported in this paper.

Figures

None
Graphical abstract
Fig. 1
Fig. 1
Brixia score: (a) zone definition and (b–d) examples of annotations. Lungs are first divided into six zones on frontal chest X-rays. Line A is drawn at the level of the inferior wall of the aortic arch. Line B is drawn at the level of the inferior wall of the right inferior pulmonary vein. A and D upper zones; B and E middle zones; C and F lower zones. A score ranging from 0 (green) to 3 (black) is then assigned to each sector, based on the observed lung abnormalities. (For interpretation of the references to color in this figure legend, the reader is referred to the web version of this article.)
Fig. 2
Fig. 2
Overview of the proposed method: representation of the two COVID-19 datasets (on the left) with associated Brixia score annotations, and of the other two datasets (on the right) used for the pre-training. Datasets splitting and usage is indicated (in the middle) for training/validation/test phases. The outputs of the proposed system are illustrated as well (bottom right).
Fig. 3
Fig. 3
Brixa score distribution with sex stratification on the Brixia COVID-19 dataset (left), and on the dataset of Cohen et al., 2020b (right).
Fig. 4
Fig. 4
Detailed scheme of the proposed architecture. In particular, in the top-middle the CXR to be analyzed is fed to the network. The produced outputs are: the segmentation mask of the lungs (top-left); the aligned mask (middle-left); the Brixia score (top-right).
Fig. 5
Fig. 5
Example of the alignment through the resampling grid produced by the transformation matrix, and its application to both the segmentation mask and the feature maps. On the right, the hard-attention mechanism and the ROI Pooling operation.
Fig. 6
Fig. 6
Consistency/confusion matrices based on lung regions score values (top, 0–3), and on Global Score values (bottom, 0–18).
Fig. 7
Fig. 7
Single and joint MAE distribution for lung regions and Global Score predictions obtained by BS-Net (ENS).
Fig. 8
Fig. 8
Training curves related to BS-Net-HA. Segmentation (a); Alignment (b); Brixia score prediction – best single model (c).
Fig. 9
Fig. 9
Pairwise inter-rater results in terms of MAE (and SD). In the most right column (orange), the inter-rater results with predictions by BS-Net-Ens.
Fig. 10
Fig. 10
Results and related explainability maps obtained on five examples from the Brixia COVID-19 test set. (top) Three examples of accurate predictions. (bottom) Two critical cases in which the prediction is poor with respect to the original clinical annotation R0. For each block, the most left image is the input CXR, followed by the aligned and masked lungs. In the second row we show the predicted Brixia score with respect to the original clinical annotation R0, and the explainability map. In such maps the relevance is colored so that white means that the region does not contribute to that prediction, while the class color (i.e., 1 = orange, 2 = red, 3 = black) means that the region had an important role in the prediction of the T score class.
Fig. 11
Fig. 11
MAE on regions (left) and MAE of the global score (right) versus synthetic rotation. The blue curve is from the network ‘without’ the alignment block, while the orange is ‘with’ the alignment block enabled. The shaded areas correspond to the 95% confidence interval. (For interpretation of the references to color in this figure legend, the reader is referred to the web version of this article.)

Similar articles

Cited by

References

    1. Blain M., Kassin M.T., Varble N., Wang X., Xu Z., Xu D., Carrafiello G., Vespro V., Stellato E., Ierardi A.M., et al. Determination of disease severity in COVID-19 patients using deep learning in chest X-ray images. Diagn. Interv. Radiol. 2021;27(1):20–27. - PMC - PubMed
    1. Bontempi D., Benini S., Signoroni A., Svanera M., Muckli L. CEREBRUM: a fast and fully-volumetric convolutional Encoder-decodeR for weakly-supervised sEgmentation of BRain strUctures from out-of-the-scanner MRI. Med. Image Anal. 2020;62 - PubMed
    1. Borghesi A., Maroldi R. COVID-19 outbreak in Italy: experimental chest X-ray scoring system for quantifying and monitoring disease progression. Radiol. Med. 2020;125:509–513. - PMC - PubMed
    1. Borghesi A., Zigliani A., Golemi S., Carapella N., Maculotti P., Farina D., Maroldi R. Chest X-ray severity index as a predictor of in-hospital mortality in coronavirus disease 2019: a study of 302 patients from Italy. Int. J. Infect. Dis. 2020;96:291–293. - PMC - PubMed
    1. Amer, R., Frid-Adar, M., Gozes, O., Nassar, J., Greenspan, H., 2020. COVID-19 in CXR: from detection and severity scoring to patient disease monitoring. arXiv:2008.02150 doi: 10.1109/JBHI.2021.3069169. - PMC - PubMed