

Single-cell mechanical analysis and tension quantification via electrodeformation relaxation
- PMID: 33862816
- PMCID: PMC10625872
- DOI: 10.1103/PhysRevE.103.032409
Single-cell mechanical analysis and tension quantification via electrodeformation relaxation
Abstract
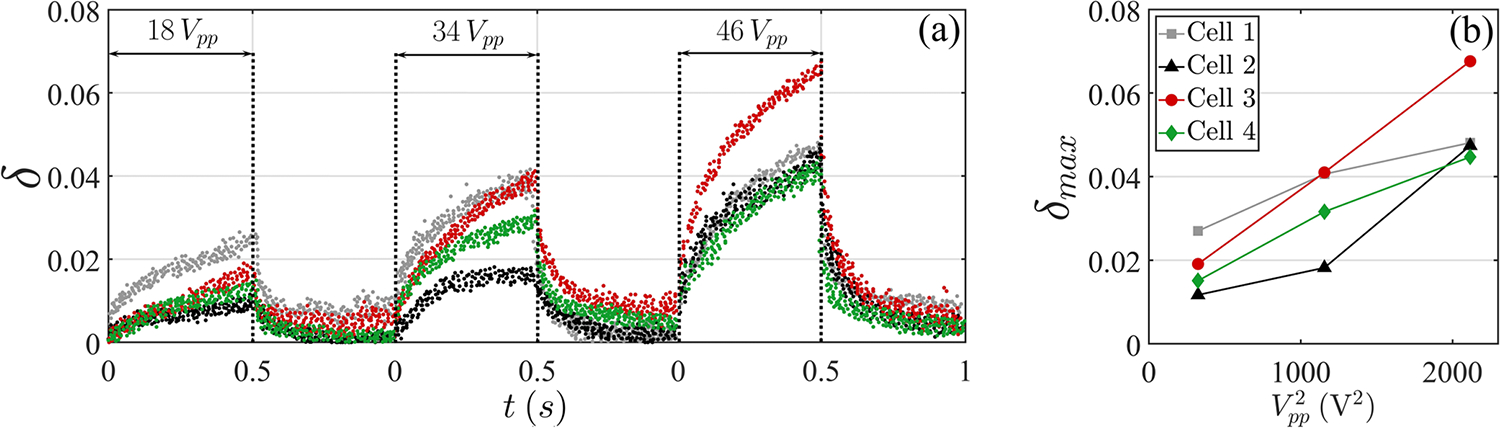
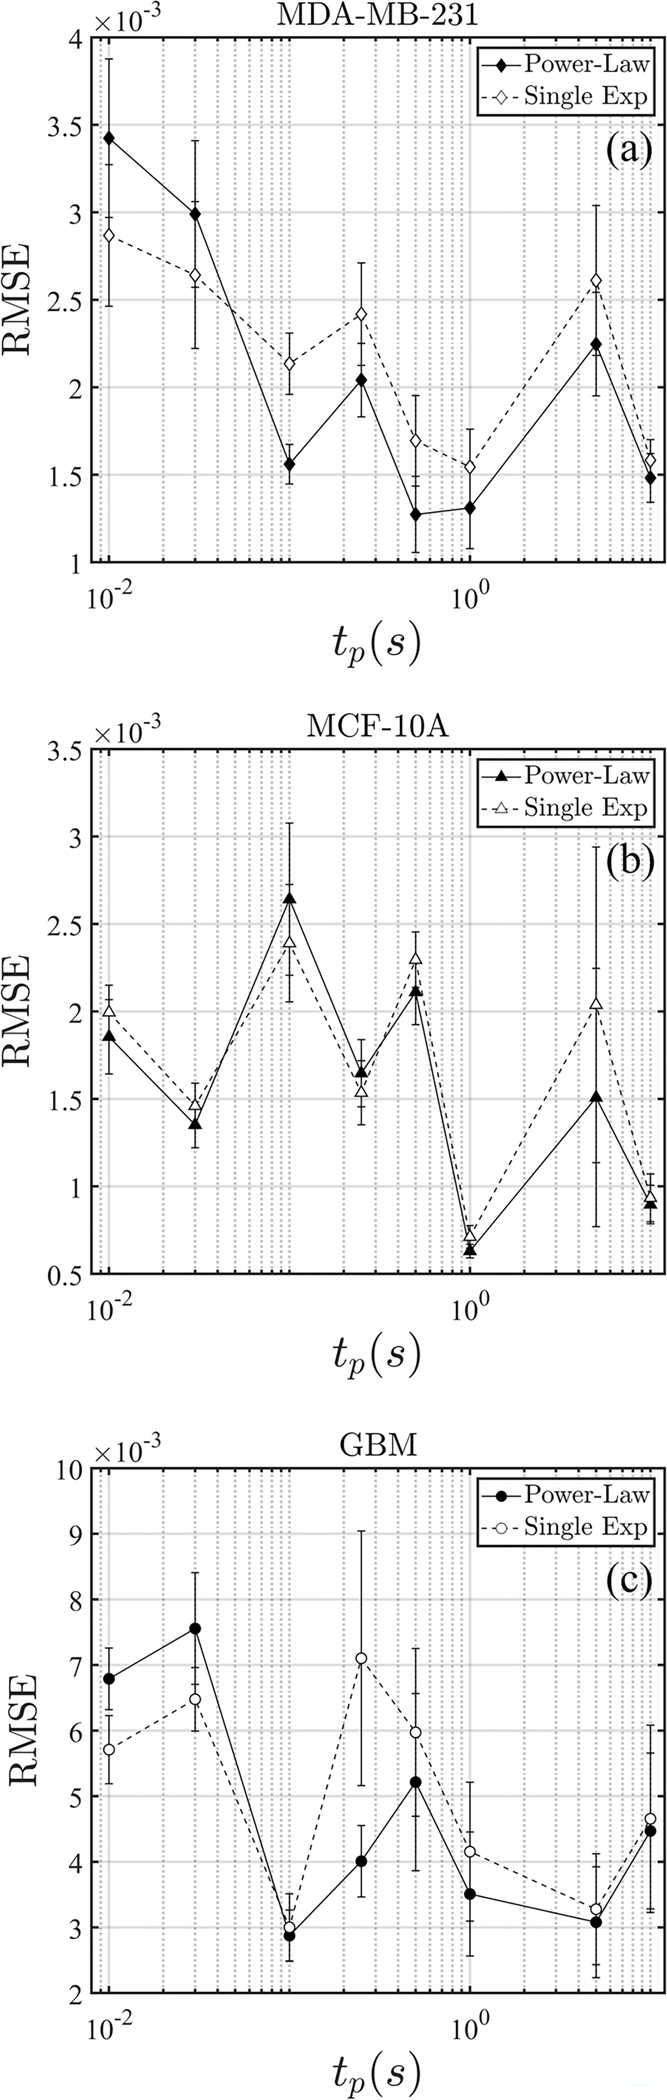
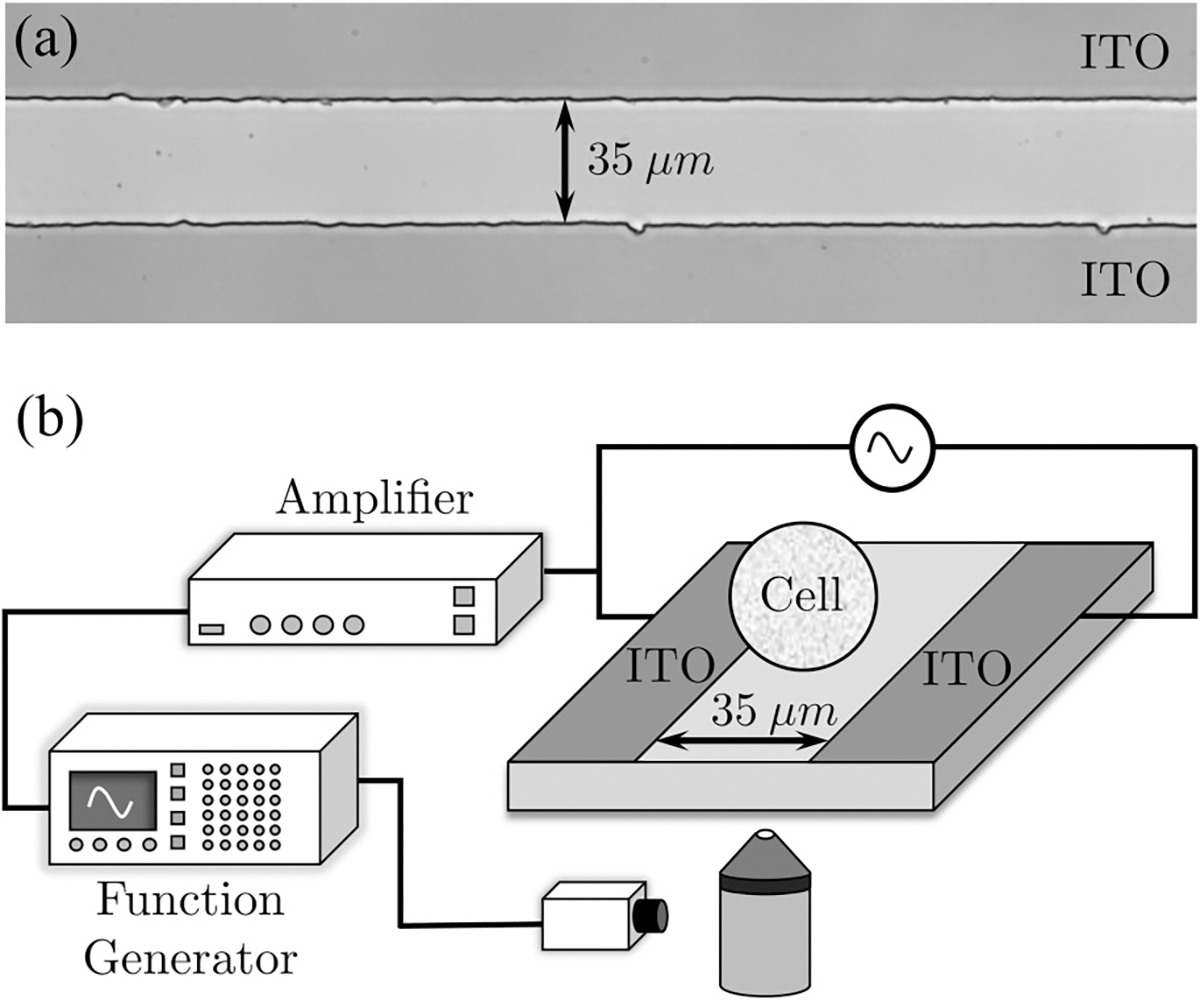
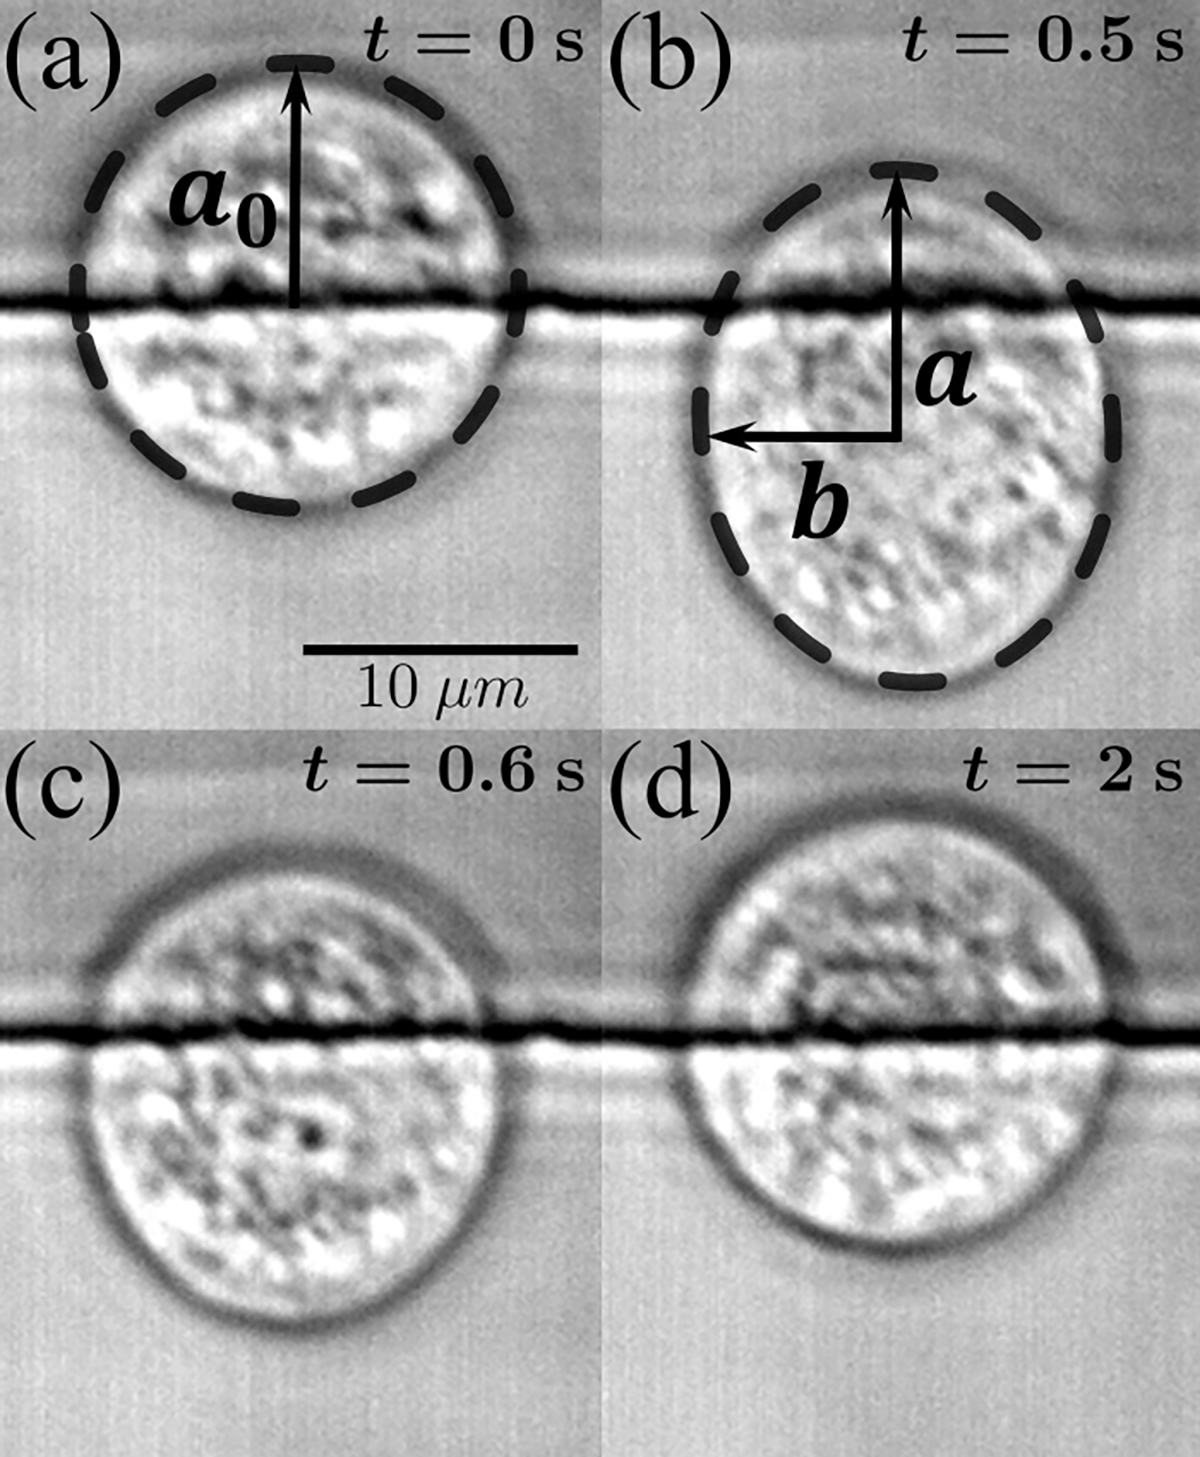
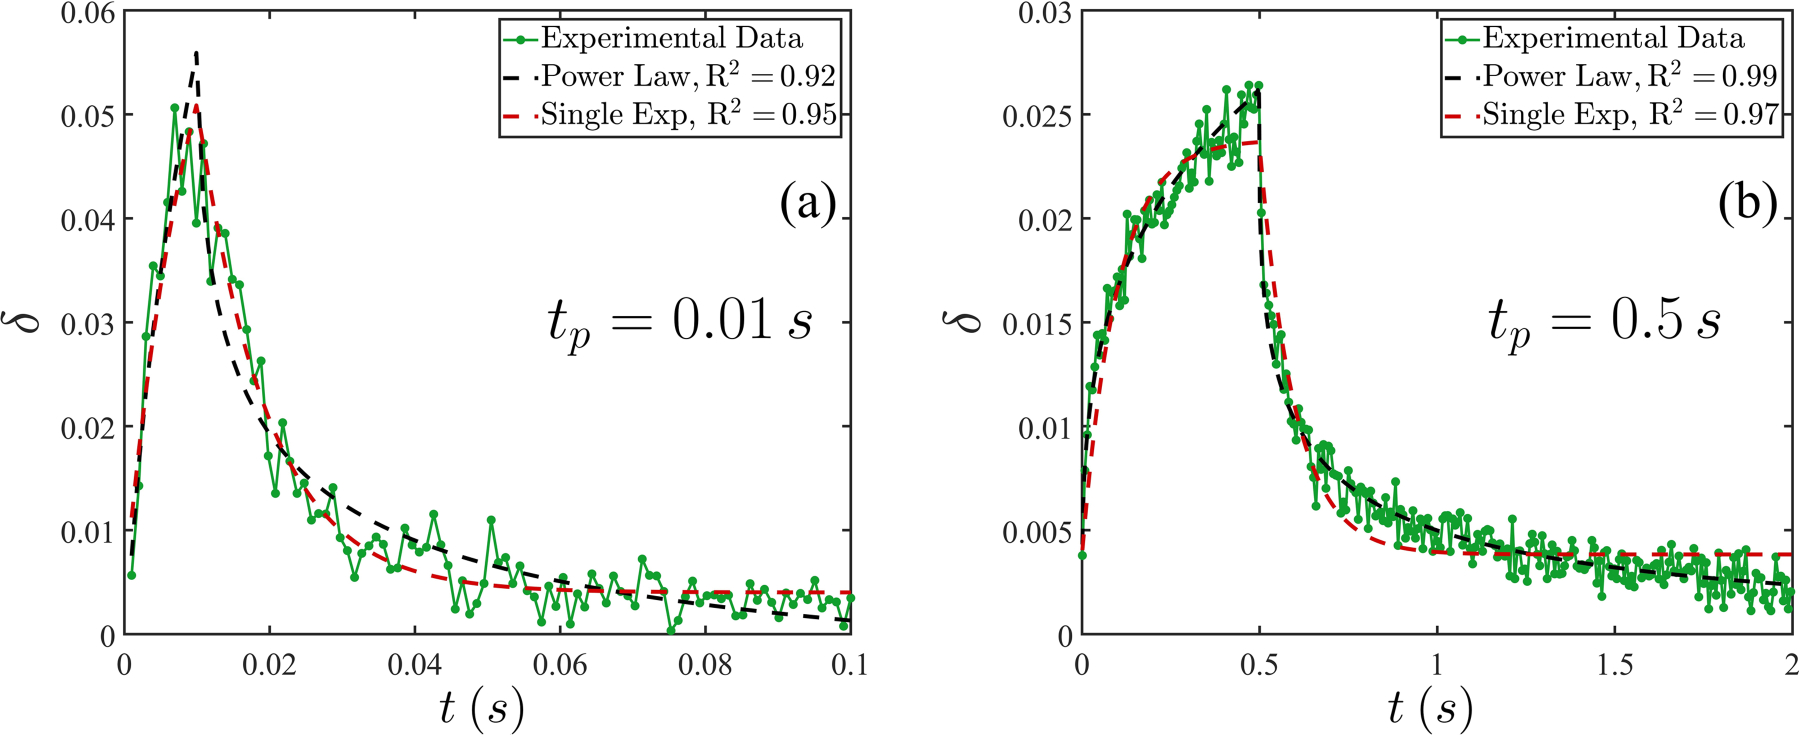
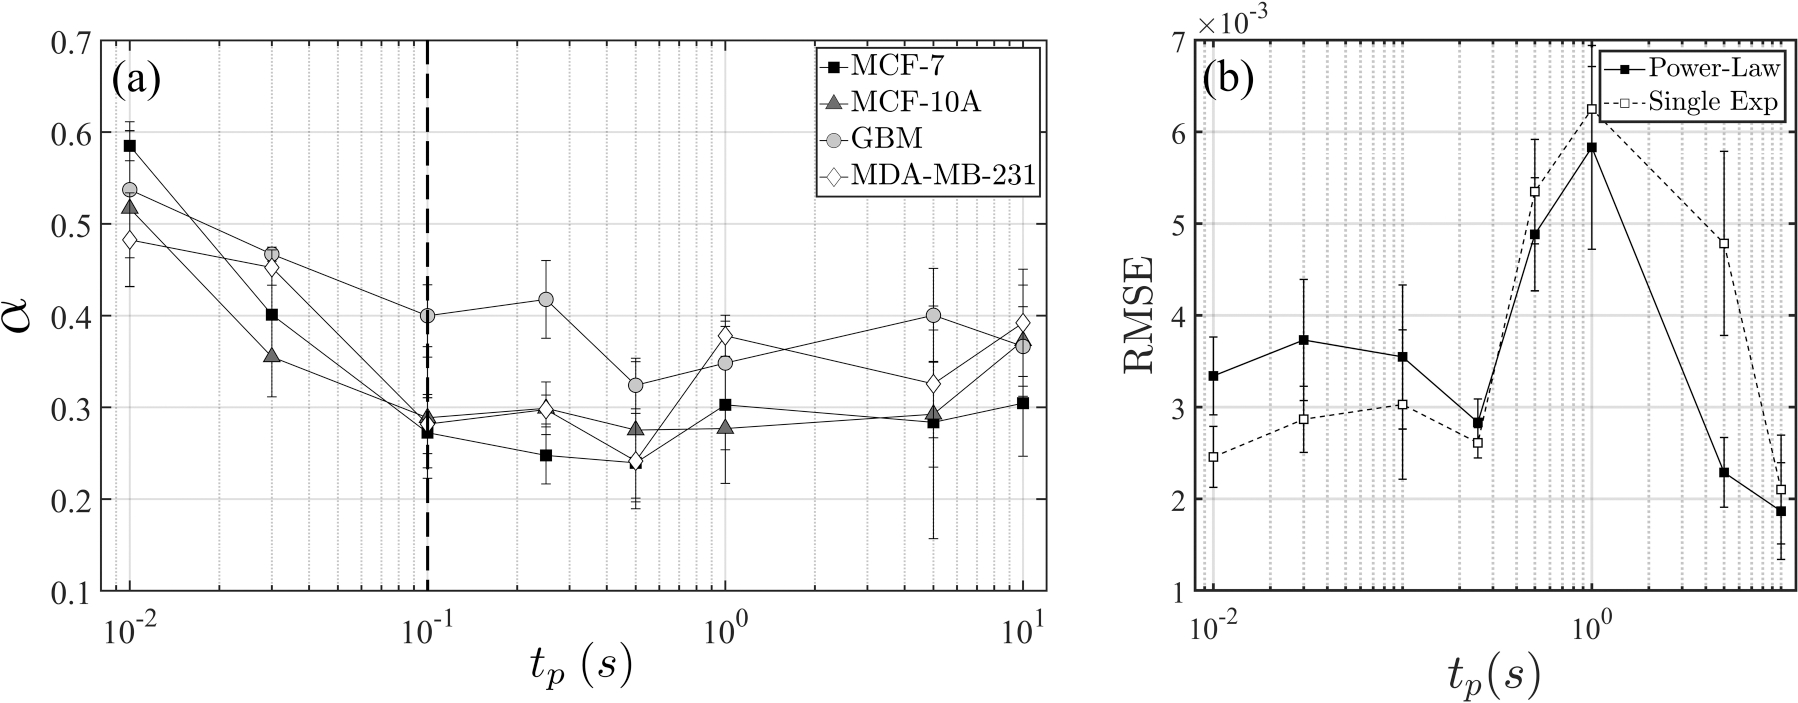
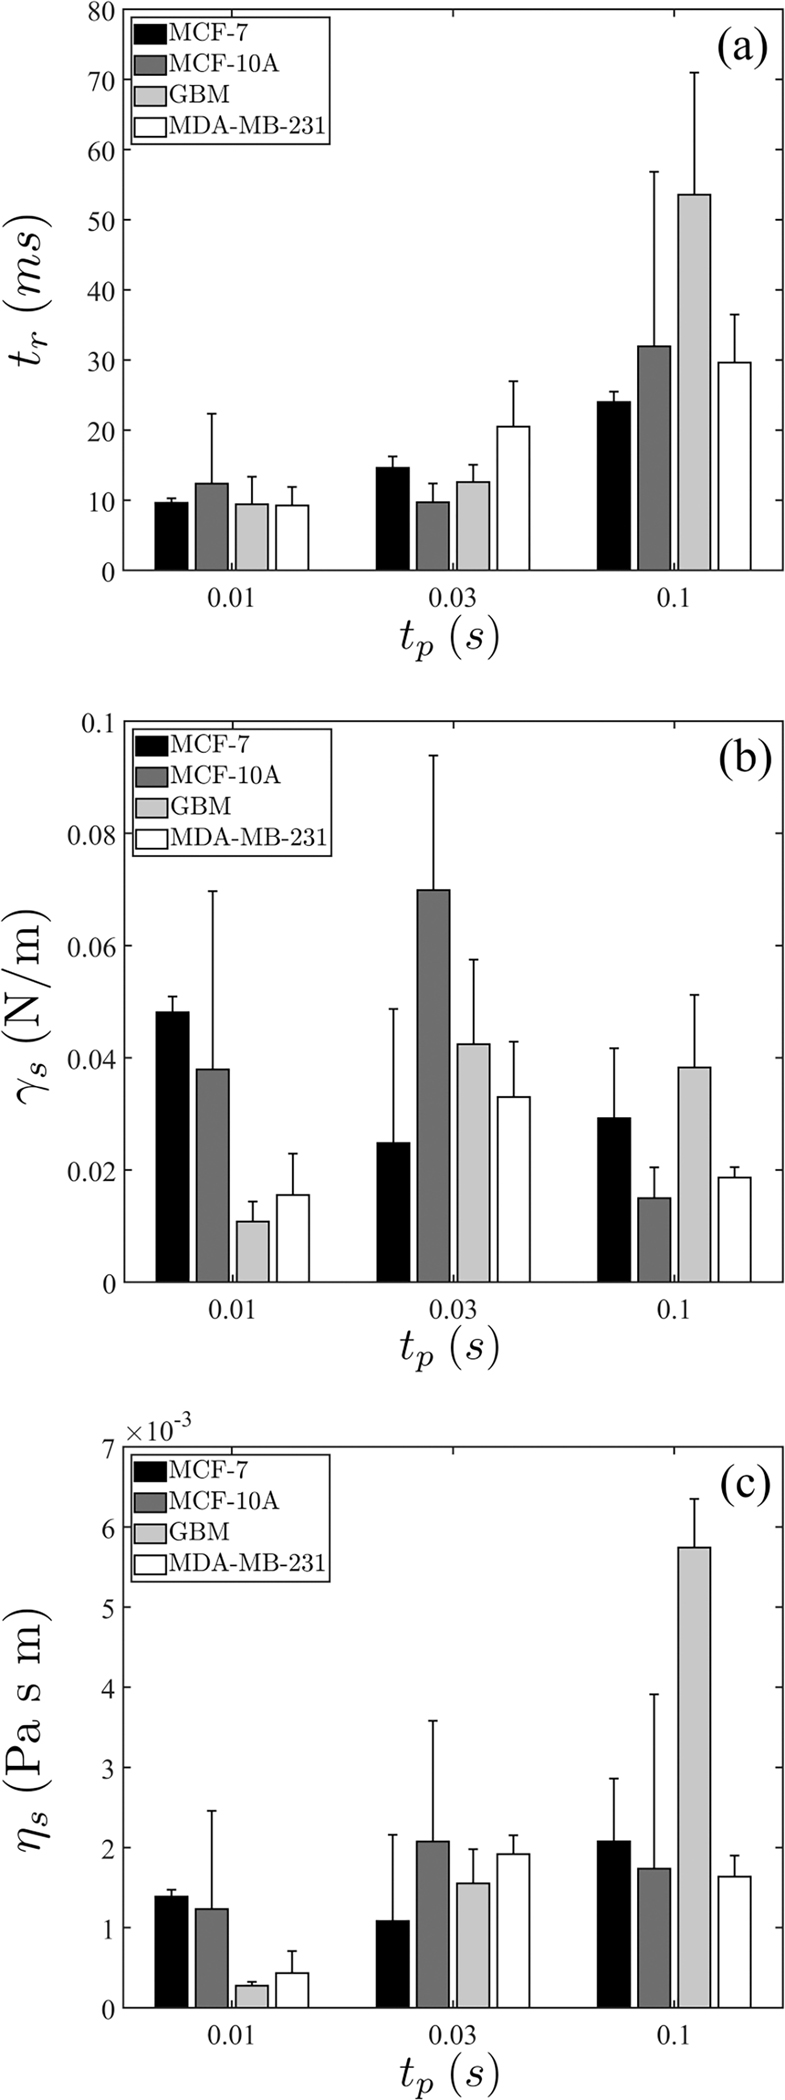
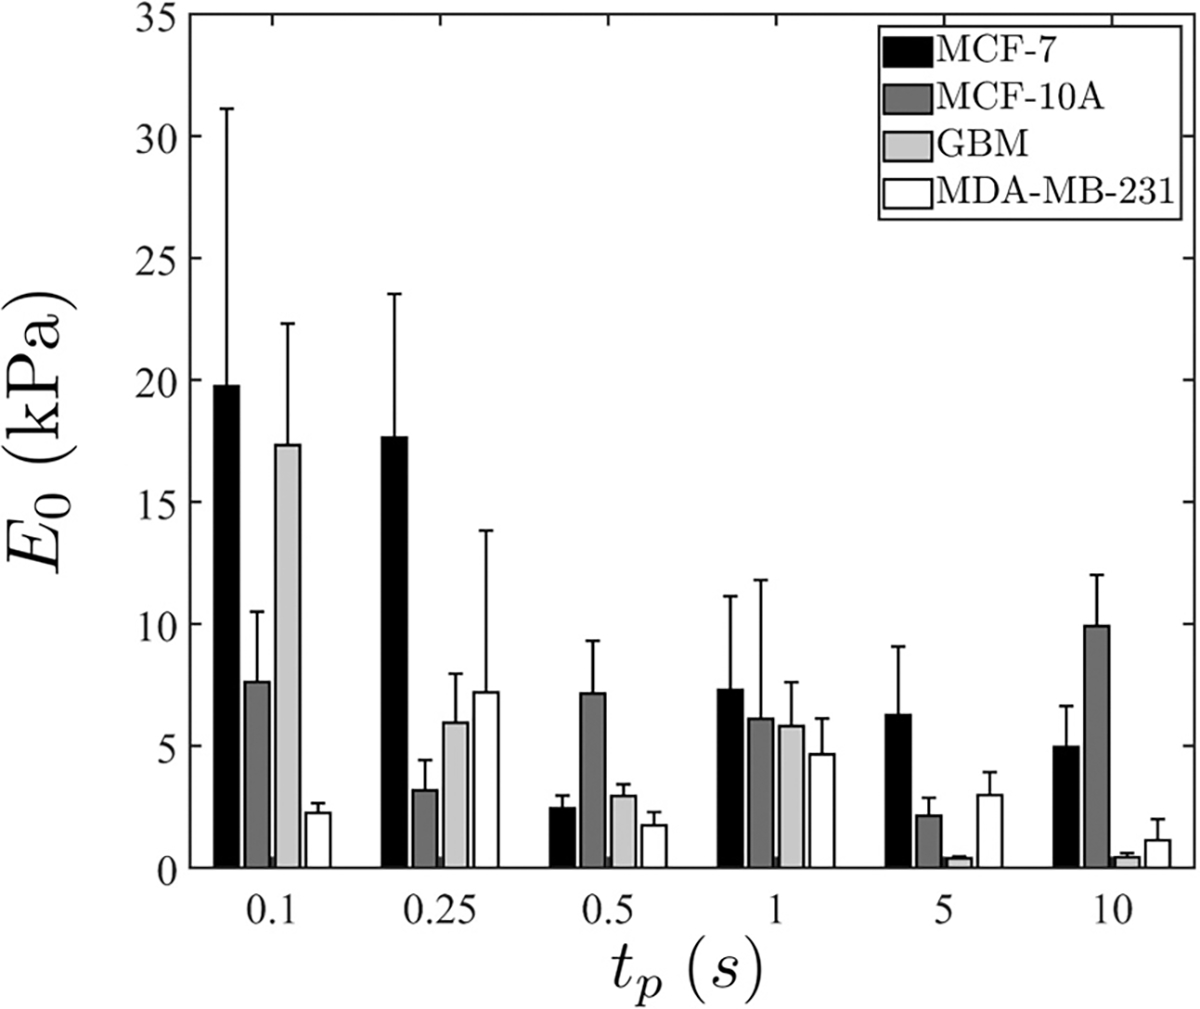
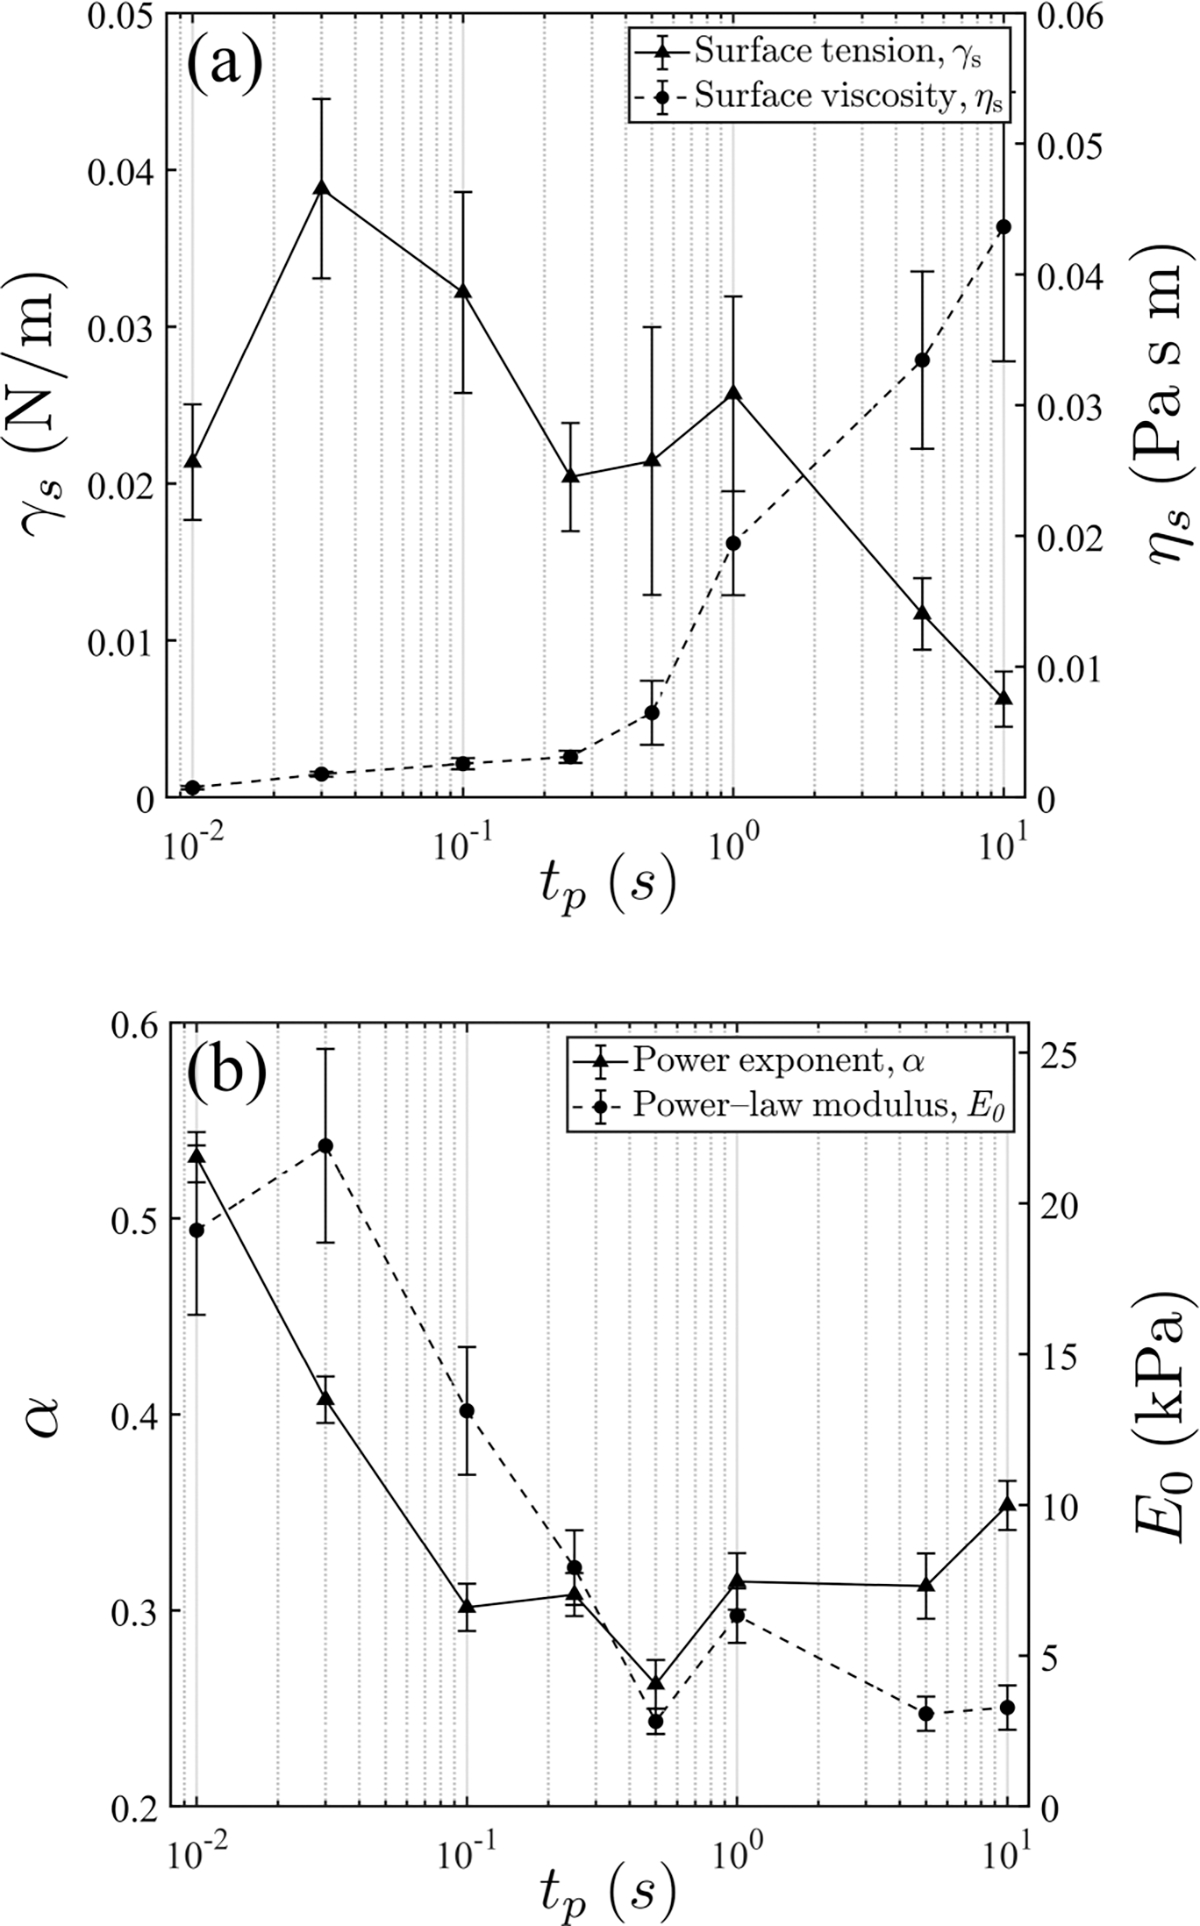
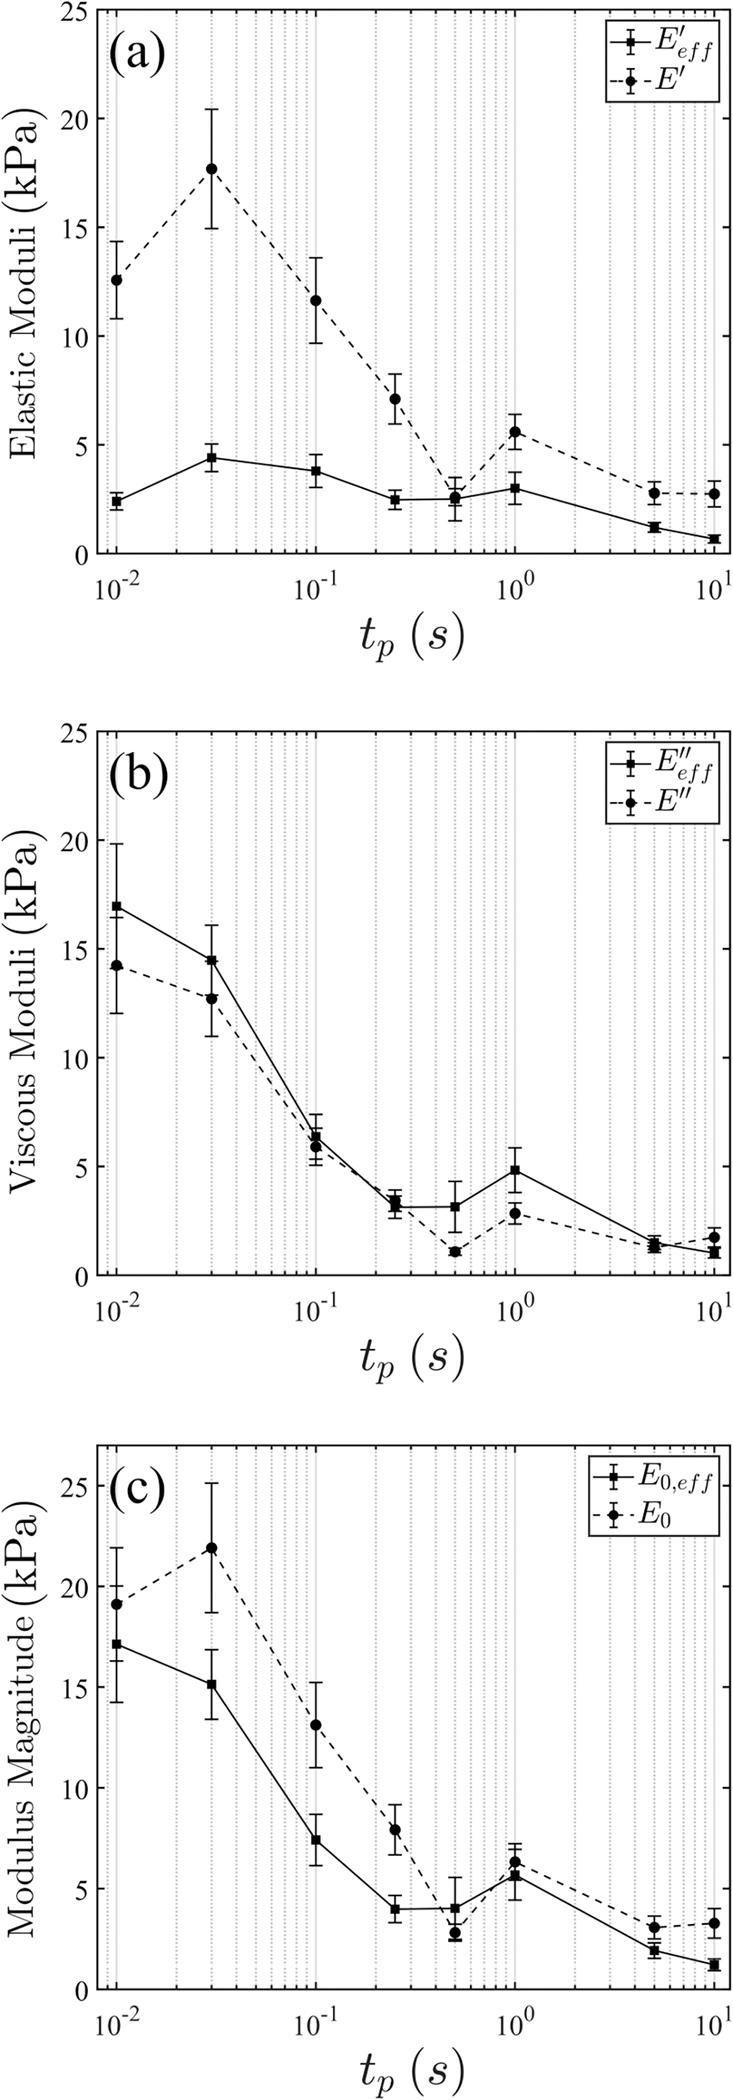
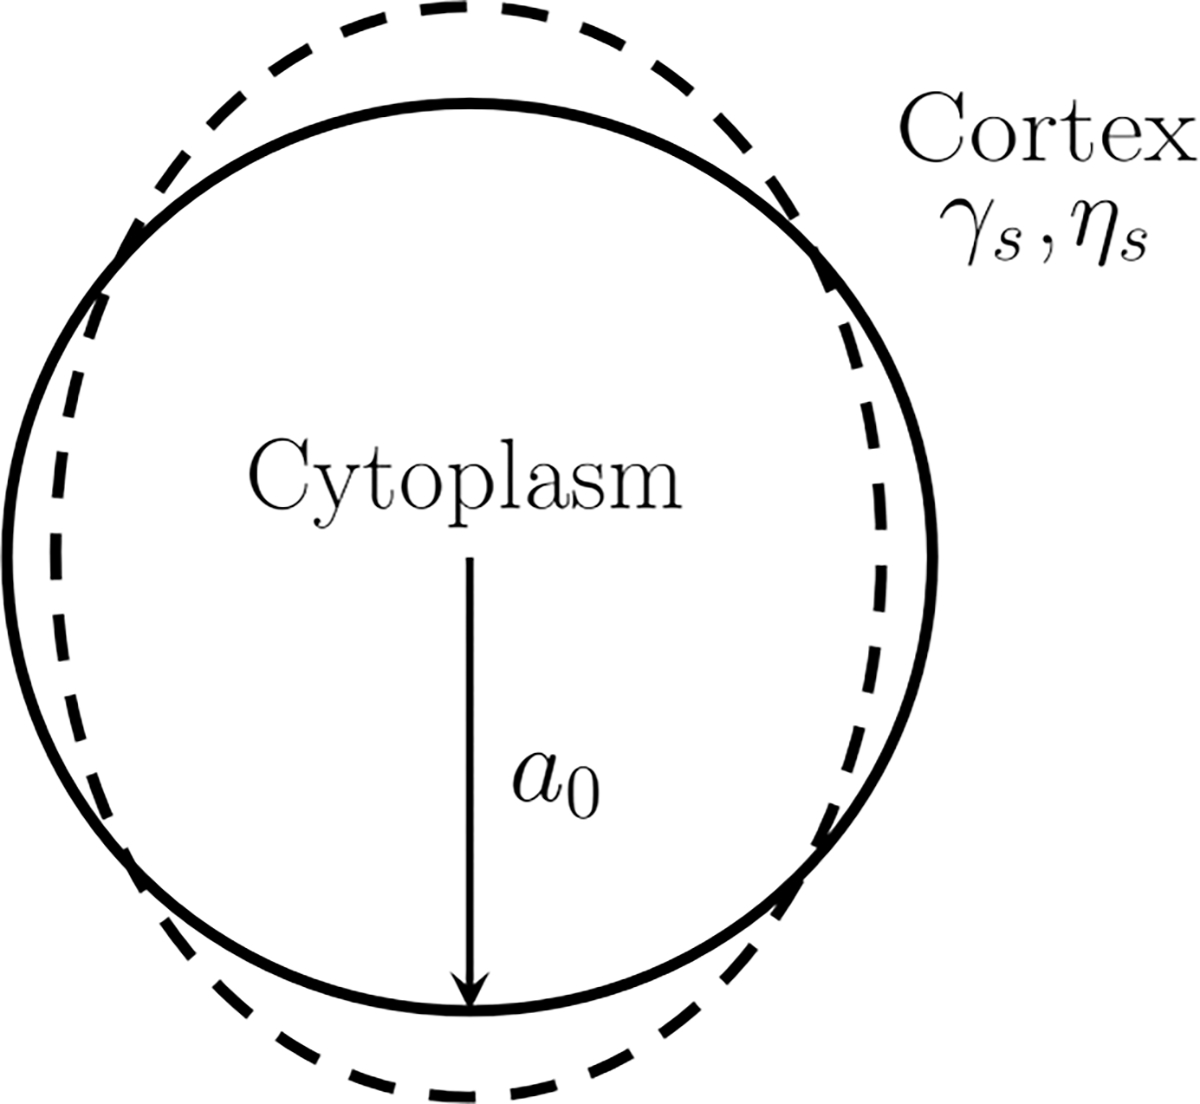
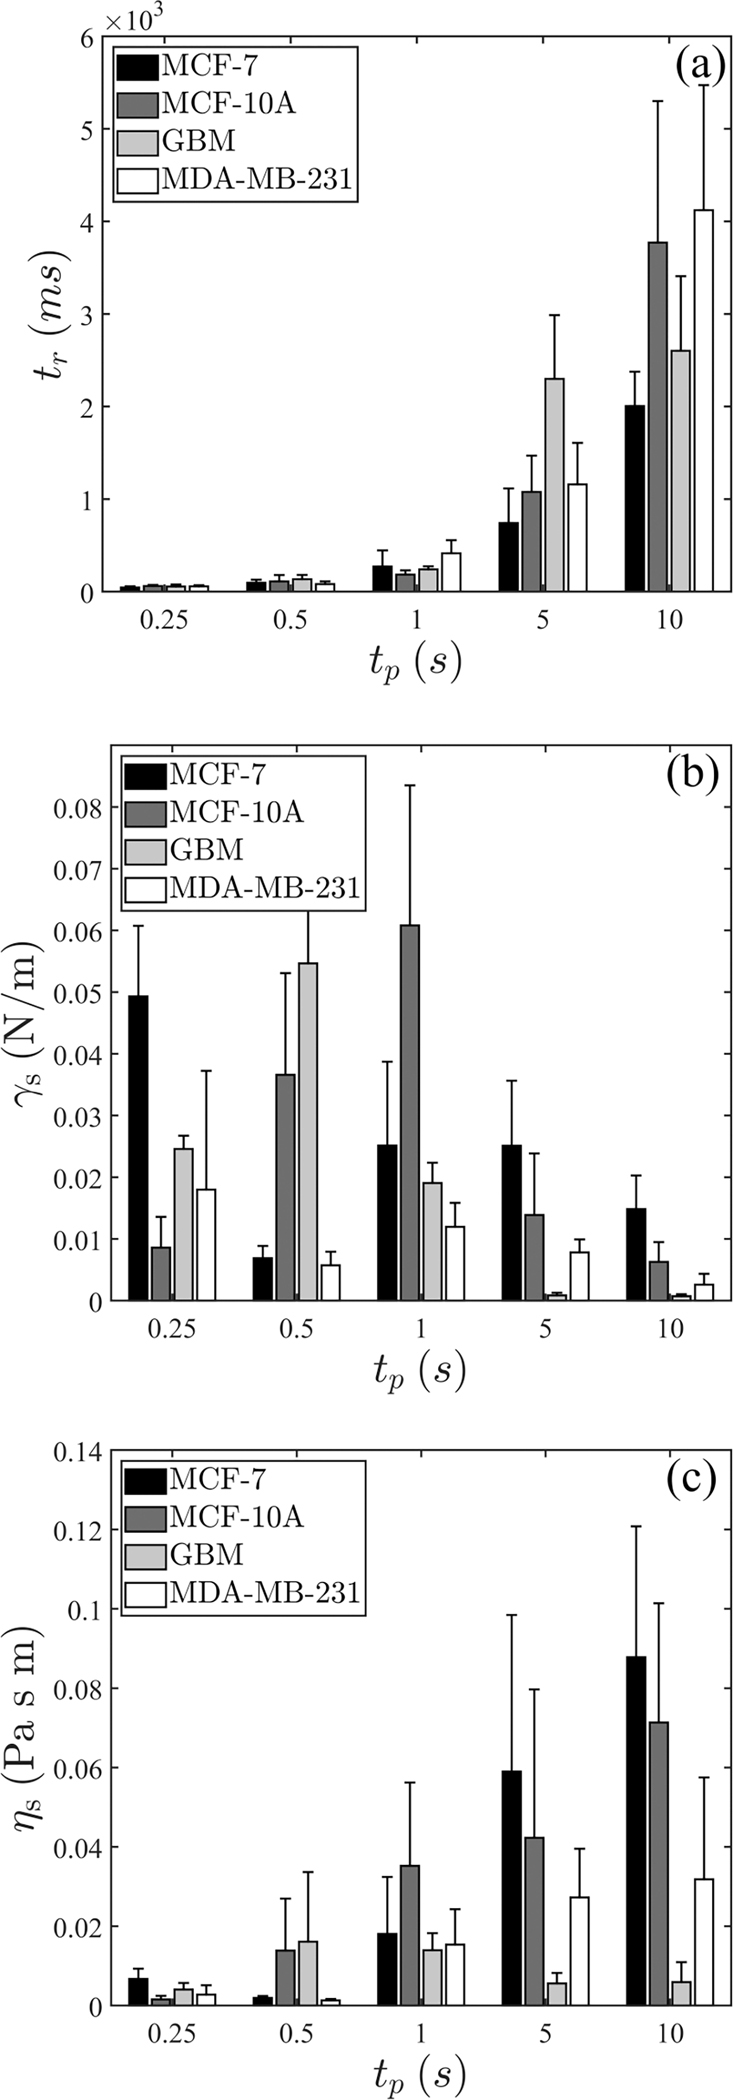
The mechanical behavior and cortical tension of single cells are analyzed using electrodeformation relaxation. Four types of cells, namely, MCF-10A, MCF-7, MDA-MB-231, and GBM, are studied, with pulse durations ranging from 0.01 to 10 s. Mechanical response in the long-pulse regime is characterized by a power-law behavior, consistent with soft glassy rheology resulting from unbinding events within the cortex network. In the subsecond short-pulse regime, a single timescale well describes the process and indicates the naive tensioned (prestressed) state of the cortex with minimal force-induced alteration. A mathematical model is employed and the simple ellipsoidal geometry allows for use of an analytical solution to extract the cortical tension. At the shortest pulse of 0.01 s, tensions for all four cell types are on the order of 10^{-2} N/m.
Figures
Similar articles
-
Mechanical Responses of Breast Cancer Cells to Substrates of Varying Stiffness Revealed by Single-Cell Measurements.J Phys Chem Lett. 2020 Sep 17;11(18):7643-7649. doi: 10.1021/acs.jpclett.0c02065. Epub 2020 Aug 28. J Phys Chem Lett. 2020. PMID: 32794712
-
Effects of energy metabolism on the mechanical properties of breast cancer cells.Commun Biol. 2020 Oct 20;3(1):590. doi: 10.1038/s42003-020-01330-4. Commun Biol. 2020. PMID: 33082491 Free PMC article.
-
Mechanical behaviors of tension and relaxation of tongue and soft palate: Experimental and analytical modeling.J Theor Biol. 2018 Dec 14;459:142-153. doi: 10.1016/j.jtbi.2018.10.001. Epub 2018 Oct 2. J Theor Biol. 2018. PMID: 30287357
-
Mechanical forces in cerebral cortical folding: a review of measurements and models.J Mech Behav Biomed Mater. 2014 Jan;29:568-81. doi: 10.1016/j.jmbbm.2013.02.018. Epub 2013 Mar 14. J Mech Behav Biomed Mater. 2014. PMID: 23566768 Free PMC article. Review.
-
Mechanical models of the cellular cytoskeletal network for the analysis of intracellular mechanical properties and force distributions: a review.Med Eng Phys. 2012 Dec;34(10):1375-86. doi: 10.1016/j.medengphy.2012.08.007. Epub 2012 Oct 10. Med Eng Phys. 2012. PMID: 23062682 Review.
Cited by
-
Micro and Macroscopic Stress-Strain Relations in Disordered Tessellated Networks.Phys Rev Lett. 2023 May 5;130(18):188201. doi: 10.1103/PhysRevLett.130.188201. Phys Rev Lett. 2023. PMID: 37204891 Free PMC article.
-
Surface tension and viscosity of protein condensates quantified by micropipette aspiration.Biophys Rep (N Y). 2021 Sep 8;1(1):100011. doi: 10.1016/j.bpr.2021.100011. Epub 2021 Aug 11. Biophys Rep (N Y). 2021. PMID: 36247368 Free PMC article.
-
N-Cadherin based adhesion and Rac1 activity regulate tension polarization in the actin cortex.Sci Rep. 2025 Feb 4;15(1):4296. doi: 10.1038/s41598-025-88537-9. Sci Rep. 2025. PMID: 39905109 Free PMC article.
References
-
- Foty RA and Steinberg MS, Differential adhesion in model systems, Wiley Interdiscip. Rev. Dev. Biol. 2, 631 (2013). - PubMed
-
- Lecuit T and Lenne PF, Cell surface mechanics and the control of cell shape, tissue patterns and morphogenesis, Nat. Rev. Mol. Cell. Biol. 8, 633 (2007). - PubMed
-
- Sugimura K, Lenne PF, and Graner F, Measuring forces and stresses in situ in living tissues, Development 143, 186 (2016). - PubMed
-
- Alenghat FJ and Ingber DE, Mechanotransduction: All signals point to cytoskeleton, matrix, and integrins, Sci. Signal 2002, pe6 (2002). - PubMed
MeSH terms
Grants and funding
LinkOut - more resources
Full Text Sources
Other Literature Sources
Miscellaneous