. 2021 Nov 4;58(5):2004168.
doi: 10.1183/13993003.04168-2020. Print 2021 Oct.

Identification of a novel subset of alveolar type 2 cells enriched in PD-L1 and expanded following pneumonectomy

Affiliations

Identification of a novel subset of alveolar type 2 cells enriched in PD-L1 and expanded following pneumonectomy

Negah Ahmadvand et al. Eur Respir J. .

Abstract

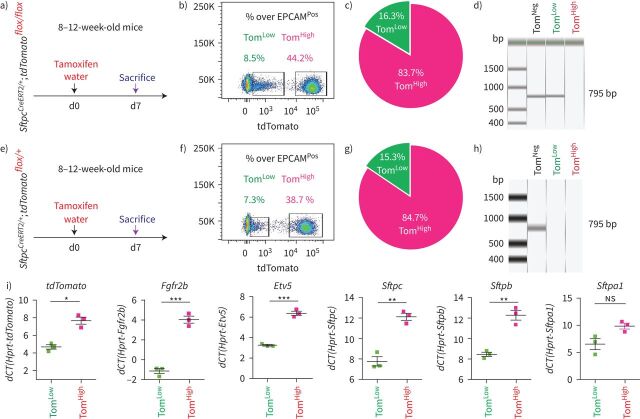
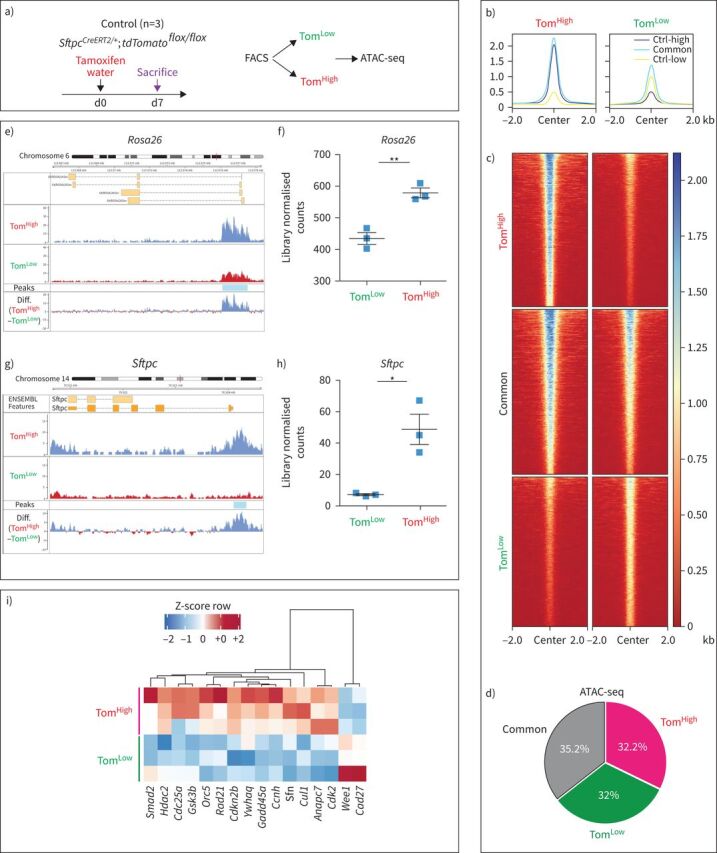
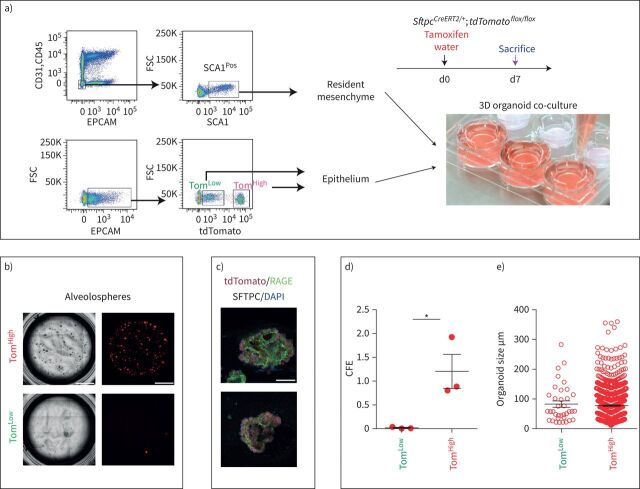
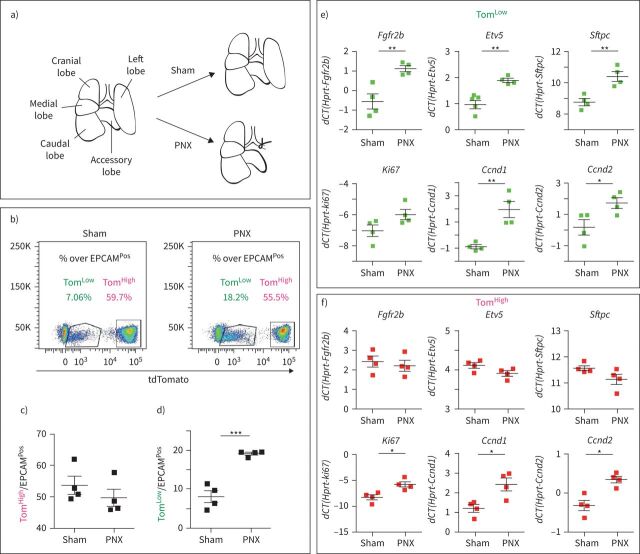
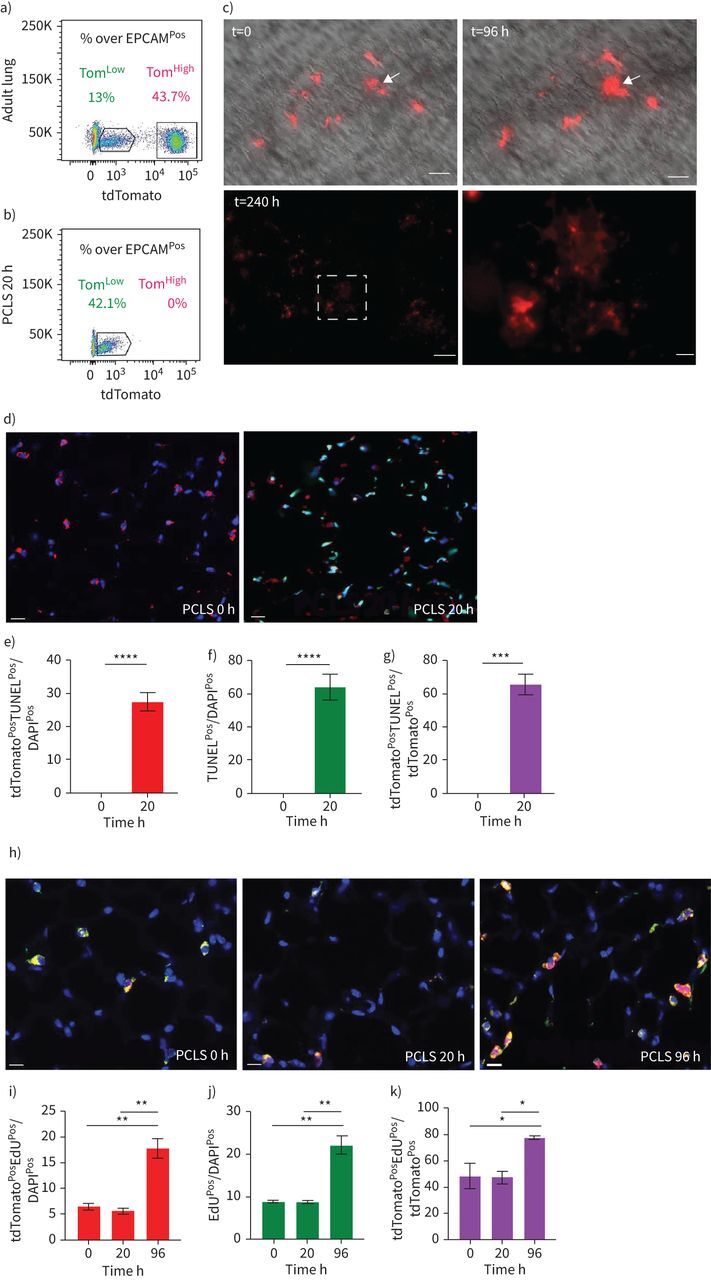
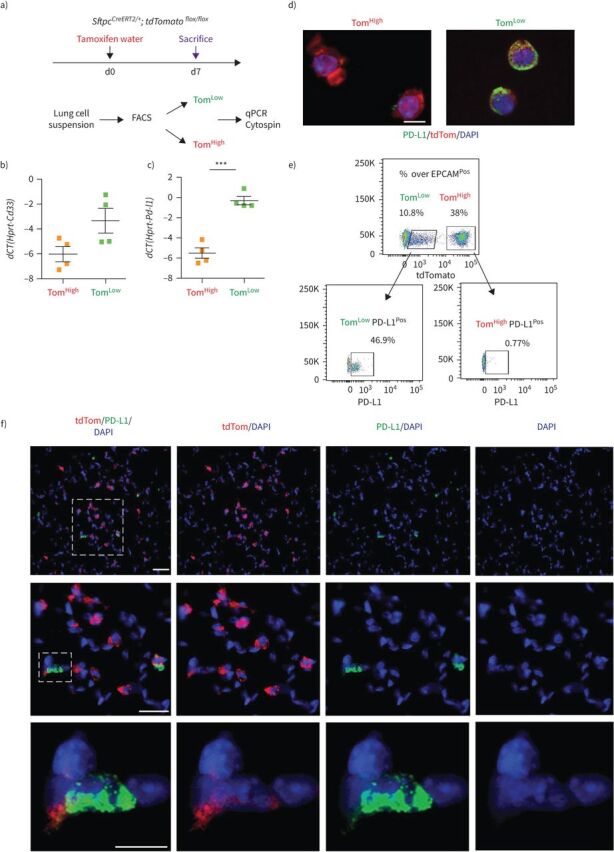
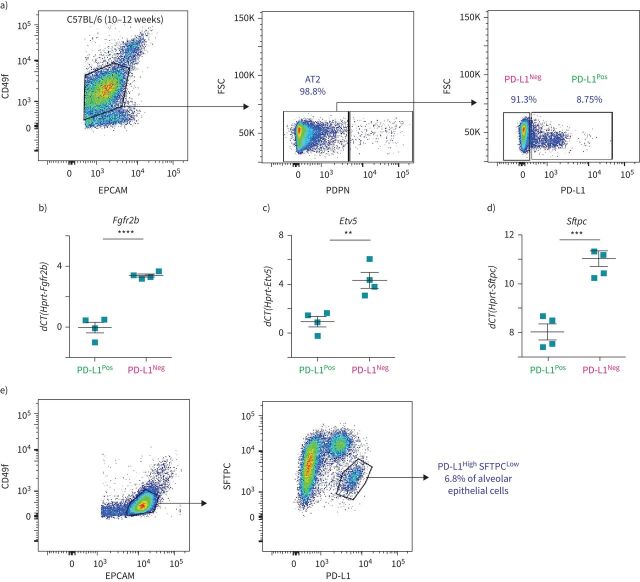
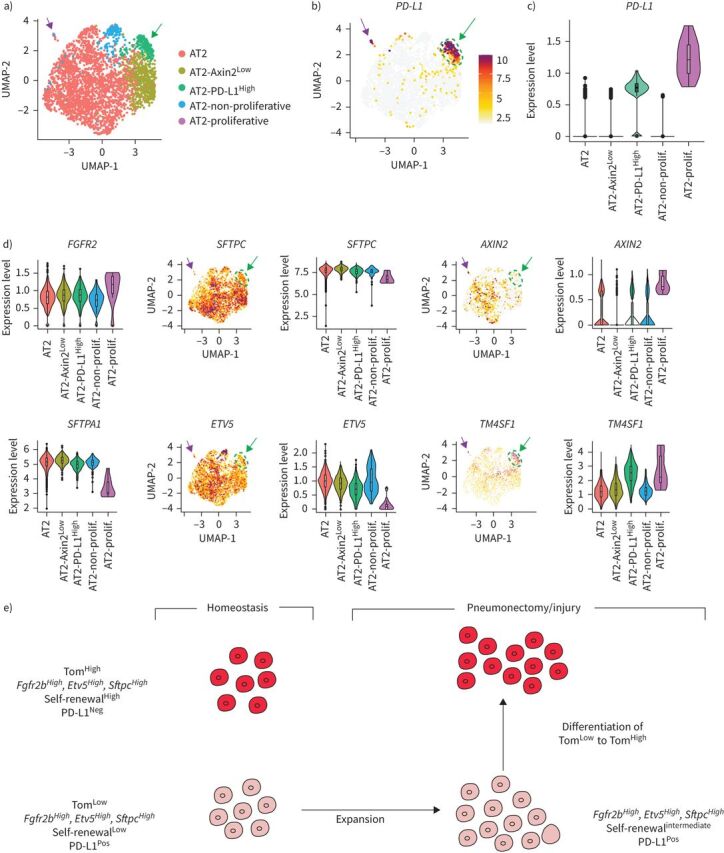
Alveolar type 2 (AT2) cells are heterogeneous cells, with specialised AT2 subpopulations within this lineage exhibiting stem cell properties. However, the existence of quiescent, immature cells within the AT2 lineage that are activated during lung regeneration is unknown.SftpcCreERT2/+;tdTomatoflox/flox mice were used for the labelling of AT2 cells and labelled subpopulations were analysed by flow cytometry, quantitative PCR, assay for transposase-accessible chromatin using sequencing (ATAC-seq), gene arrays, pneumonectomy and culture of precision-cut lung slices. Single-cell RNA-sequencing (scRNA-seq) data from human lungs were analysed.In mice, we detected two distinct AT2 subpopulations, with low tdTomato level (TomLow) and high tdTomato level (TomHigh). TomLow cells express lower levels of the AT2 differentiation markers Fgfr2b and Etv5, while TomHigh, as bona fide mature AT2 cells, show higher levels of Sftpc, Sftpb, Sftpa1, Fgfr2b and Etv5 expression. ATAC-seq analysis indicates that TomLow and TomHigh cells constitute two distinct cell populations, with specific silencing of Sftpc, Rosa26 and cell cycle gene loci in the TomLow population. Upon pneumonectomy, the number of TomLow but not TomHigh cells increases and TomLow cells show upregulated expression of Fgfr2b, Etv5, Sftpc, Ccnd1 and Ccnd2 compared to Sham. TomLow cells overexpress programmed cell death 1 ligand 1 (PD-L1), an immune inhibitory membrane receptor ligand, which is used by flow cytometry to differentially isolate these two subpopulations. In the human lung, data mining of a recent scRNA-seq AT2 data set demonstrates the existence of a PD-L1 Pos population. Therefore, we have identified a novel population of AT2 quiescent, immature progenitor cells in mouse that expand upon pneumonectomy and we have provided evidence for the existence of such cells in human.


Conflict of interest statement

Conflict of interest: N. Ahmadvand has nothing to disclose. Conflict of interest: F. Khosravi has nothing to disclose. Conflict of interest: A. Lingampally has nothing to disclose. Conflict of interest: R. Wasnick has nothing to disclose. Conflict of interest: I. Vasquez-Armendariz has nothing to disclose. Conflict of interest: G. Carraro has nothing to disclose. Conflict of interest: M. Heiner has nothing to disclose. Conflict of interest: S. Rivetti has nothing to disclose. Conflict of interest: Y. Lv has nothing to disclose. Conflict of interest: J. Wilhelm has nothing to disclose. Conflict of interest: A. Gunther has nothing to disclose. Conflict of interest: S. Herold has nothing to disclose. Conflict of interest: D. Al Alam has nothing to disclose. Conflict of interest: C. Chen has nothing to disclose. Conflict of interest: P. Minoo has nothing to disclose. Conflict of interest: J-S. Zhang has nothing to disclose. Conflict of interest: S. Bellusci has nothing to disclose.

Figures

FIGURE 1
FIGURE 1
Identification of two subpopulations of AT2-lineage-labelled cells, named tdTomatoLow (TomLow) and tdTomatoHigh (TomHigh). a) Timeline of tamoxifen treatment of SftpcCreERT2/+;tdTomatoflox/flox mice (n=4). d: day. b) Representative flow cytometry of EPCAMPos population selection and identification of TomLow (8.5%) and TomHigh (44.2%) populations based on the tdTomato level. c) Percentage of TomLow (16.3%) and TomHigh (83.7%) in total tdTomatoPos cells. d) PCR on genomic DNA isolated from fluorescence-activated cell sorting (FACS)-based sorted TomLow and TomHigh cells from SftpcCreERT2/+;tdTomatoflox/flox mice for Stop codon. e) Timeline of tamoxifen treatment of SftpcCreERT2/+;tdTomatoflox/+mice and f) representative flow cytometry analysis of TomLow (7.3%) and TomHigh (38.7%). g) The pie chart shows the percentage of TomLow (15.3%) and TomHigh (84.7%) in total tdTomatoPos cells. h) PCR on genomic DNA isolated from FACS-based sorted TomLow and TomHigh cells from SftpcCreERT2/+;tdTomatoflox/+ mice. i) Quantitative PCR analysis of FACS-based sorted TomLow and TomHigh cells for the expression of Tomato, Fgfr2b, Etv5, Sftpc, Sftpb and Sftpa1. dCT: delta cycle threshold. Data are presented as mean±sem. *: p<0.05; **: p<0.01; ***: p<0.001.
FIGURE 2
FIGURE 2
Assay for transposase-accessible chromatin using sequencing (ATAC-seq) analysis on fluorescence-activated cell sorting (FACS)-based sorted tdTomatoLow (TomLow) and tdTomatoHigh (TomHigh) populations. a) Timeline of tamoxifen treatment of SftpcCreERT2/+;tdTomatoflox/flox mice (n=3). ATAC-seq was carried out on FACS-based sorted TomLow and TomHigh subpopulations. d: day. b, c) Coverage heat maps of TomLow and TomHigh, displaying genome-wide regions of differential open chromatin peaks in TomLow versus TomHigh. TomLow chromatin is less open and transcriptionally less active compared to TomHigh. Ctrl-low shows the peaks related to open chromatin regions in TomLow. Ctrl-high shows the peaks related to open chromatin regions in TomHigh. Common shows peaks detected in both TomLow and TomHigh subpopulations. d) ATAC-seq analysis of peaks based on the cut-offs shows 3605 upregulated in TomHigh (false discovery rate (FDR)<0.05, log2(FC)>0.585, base mean>20), 3512 upregulated in TomLow (FDR<0.05, log2(FC)>0.585, base mean>20) and 3878 non-regulated (base mean>20, FDR>0.5, log2(FC) between −0.15 and 0.15), which means 32% and 32.2% of the genome is differently accessible in TomLow and TomHigh, respectively. e) ATAC-seq histogram of average read coverage at the Rosa26 locus shows distinct ATAC-seq peaks at the promoter and denser chromatin in TomLow compared to TomHigh in this locus. Representative peaks of TomLow and TomHigh are the average of three independent samples. f) Quantification of peaks at the Rosa26 locus. g) ATAC-seq profile at Sftpc locus shows distinct ATAC-seq peaks at the promoter and denser chromatin in TomLow compared to TomHigh. Representative peaks of TomLow and TomHigh are averages of three independent samples. h) Quantification of peak regions of Sftpc locus. The ATAC-seq data have been normalised for sequencing depth and the scale on the y-axis was chosen for optimal visualisation of peaks. i) ATAC-Heat-pVAI Z-score, Pearson, average heat map based on the ATAC-seq data of top cell cycle-related genes differentially regulated in TomLow and TomHigh. FDR: the significance of results by Benjamini–Hochberg correction of multiple tests (n=3).
FIGURE 3
FIGURE 3
Different colony-forming capabilities of tdTomatoLow (TomLow) and tdTomatoHigh (TomHigh) cells. a) Representative flow cytometry shows the gating strategy of CD31Neg CD45Neg EPCAMNeg population and further selection of SCA1Pos resident mesenchymal cells from C57BL/6 lungs (upper plot), as well as the selection of TomLow and TomHigh from the EPCAMPos population from SftpcCreERT2/+;tdTomatoflox/flox(lower plot). Mesenchymal cells were co-cultured with TomLow and TomHigh separately (n=3). d: day. b) Representative alveolospheres from TomLow and TomHigh (n=3). Scale bar: 100 μm. c) Representative SFTPC and RAGE immunofluorescence staining of alveolospheres after 14 days in culture. Scale bar: 50 μm. d) Quantification of colony-forming efficiency (CFE) and e) alveolospheres size in TomHigh and TomLow (n=3). Data are presented as mean±sem. *: p<0.05.
FIGURE 4
FIGURE 4
Expansion of tdTomatoLow (TomLow) but not tdTomatoHigh (TomHigh) following pneumonectomy (PNX). a) Schematic representation of the PNX and Sham models. b) Representative flow cytometry analysis of TomLow and TomHigh populations 7 days after PNX and Sham, and quantification of c) TomHigh and e) TomLow percentages in EPCAMPos population between Sham and PNX groups (n=4). f) Quantitative PCR (qPCR) analysis of fluorescence-activated cell sorting (FACS)-based sorted TomLow population for expression of Fgfr2b, Etv5, Sftpc, Ki67, Ccnd1 and Ccnd2. g) qPCR analysis of FACS-based sorted TomHigh population for expression of Fgfr2b, Etv5, Sftpc, Ki67, Ccnd1 and Ccnd2. Data are presented as mean±sem. dCT: delta cycle threshold. *: p<0.05; **: p<0.01; ***: p<0.001.
FIGURE 5
FIGURE 5
Characterisation of the fate of tdTomatoLow (TomLow) cells in precision-cut lung slices (PCLS). a, b) Representative flow cytometry analysis of TomLow and tdTomatoHigh (TomHigh) before processing the lungs for PCLS in freshly generated PCLS (a) and PCLS after 20 h culture (b). c) Visualisation of the TomLow in PCLS at t=0, t=96 h and t=240 h. Arrows indicate the formation of cell clusters. Scale bars: 250 μm (low magnification) and 50 μm (high magnification). d) Analysis of apoptosis with representative terminal deoxynucleotidyl transferase dUTP nick end labelling (TUNEL) immunofluorescence staining on the PCLS (scale bar: 50 μm) and quantification of e) tdTomatoPos TUNELPos cells out of total cells, f) TUNELPos cells out of total cells and g) tdTomatoPos TUNELPos cells out of tdTomatoPos cells (n=4). Data are presented as mean±sem. h) Analysis of proliferation with representative EdU immunofluorescence staining on the PCLS (scale bar: 50 μm) and quantification of i) tdTomatoPos EdUPos cells out of total cells, j) EdUPos cells out of total cells and k) tdTomatoPos EdUPos cells out of tdTomatoPos cells (n=4). Data are presented as mean±sem. *: p<0.05; **: p<0.01; ***: p<0.001; ****: p<0.0001.
FIGURE 6
FIGURE 6
PD-L1 is a specific surface marker enriched in tdTomatoLow (TomLow) cells. a) Validation of gene array data by quantitative PCR (qPCR). d: day. b, c) Quantification of the expression levels of Cd33 (b) and Pd-l1 (c) in TomLow compared to tdTomatoHigh (TomHigh). Data are presented as mean±sem. dCT: delta cycle threshold. ***: p<0.001. d) Representative PD-L1 immunofluorescence staining on TomLow and TomHigh cytospin cells. Scale bar: 50 μm. e) Representative flow cytometry analysis of PD-L1Pos population in TomLow and TomHigh. f) Representative PD-L1 immunofluorescence staining on the lung sections. Scale bar: 10 μm.
FIGURE 7
FIGURE 7
Identification of AT2 PD-L1Pos cells in the lungs of wild-type mice. a) Representative flow cytometry analysis of wild-type mice lungs shows the gating strategy of EPCAMPos CD49fInter population, followed by negative selection of AT2 cells with the exclusion of AT1 PDPNPos cells. The third plot is a representative flow cytometry analysis of AT2 cells based on the use of the PD-L1 marker. b–d) Quantitative PCR analysis of fluorescence-activated cell sorting (FACS)-based sorted PD-L1Pos and PD-L1Neg cells for expression of Fgfr2b (b), Etv5 (c) and Sftpc (d) (n=4). Data are presented as mean±sem. **: p<0.01; ***: p<0.001; ****: p<0.0001. e) Representative flow cytometry analysis of SFTPC and PD-L1 co-staining. FSC: forward scatter; dCT: delta cycle threshold.
FIGURE 8
FIGURE 8
Identification of PD-L1Pos cells in human AT2 single-cell RNA-sequencing (scRNA-seq) data set. a) UMAP plot of the initial AT2 cell cluster indicates the presence of five different AT2 sub-clusters. b) UMAP and c) violin plots showing PD-L1 enrichment in the AT2-PD-L1High sub-cluster. d) UMAP and violin plots showing that the AT2-PD-L1High sub-cluster displays low levels of ETV5, SFTPC and AXIN2 and high levels of TM4SF1. Green arrows indicate AT2 PD-L1High and lavender arrows indicate AT2-proliferative. e) Model for tdTomatoLow (TomLow) and tdTomatoHigh (TomHigh) cells in homeostasis and after pneumonectomy/injury. TomLow cells are quiescent in the adult lung during homeostasis but are activated after injury. They acquire proliferative capabilities and differentiate into mature AT2 cells.

Comment in

Similar articles

Cited by

References

    1. Fehrenbach H. Alveolar epithelial type II cell: defender of the alveolus revisited. Respir Res 2001; 2: 33–46. doi:10.1186/rr36 - DOI - PMC - PubMed
    1. Desai TJ, Brownfield DG, Krasnow MA. Alveolar progenitor and stem cells in lung development, renewal and cancer. Nature 2014; 507: 190–194. doi:10.1038/nature12930 - DOI - PMC - PubMed
    1. Barkauskas CE, Cronce MJ, Rackley CR, et al. . Type 2 alveolar cells are stem cells in adult lung. J Clin Invest 2013; 123: 3025–3036. doi:10.1172/JCI68782 - DOI - PMC - PubMed
    1. Rawlins EL, Okubo T, Xue Y, et al. . The role of Scgb1a1+ Clara cells in the long-term maintenance and repair of lung airway, but not alveolar, epithelium. Cell Stem Cell 2009; 4: 525–534. doi:10.1016/j.stem.2009.04.002 - DOI - PMC - PubMed
    1. Rock JR, Barkauskas CE, Cronce MJ, et al. . Multiple stromal populations contribute to pulmonary fibrosis without evidence for epithelial to mesenchymal transition. Proc Natl Acad Sci USA 2011; 108: E1475–E1483. doi:10.1073/pnas.1117988108 - DOI - PMC - PubMed

Publication types