. 2021 Jun 30;41(26):5677-5686.
doi: 10.1523/JNEUROSCI.1899-20.2021. Epub 2021 Apr 16.

REM Sleep Microstates in the Human Anterior Thalamus

Affiliations

REM Sleep Microstates in the Human Anterior Thalamus

Péter Simor et al. J Neurosci. .

Abstract

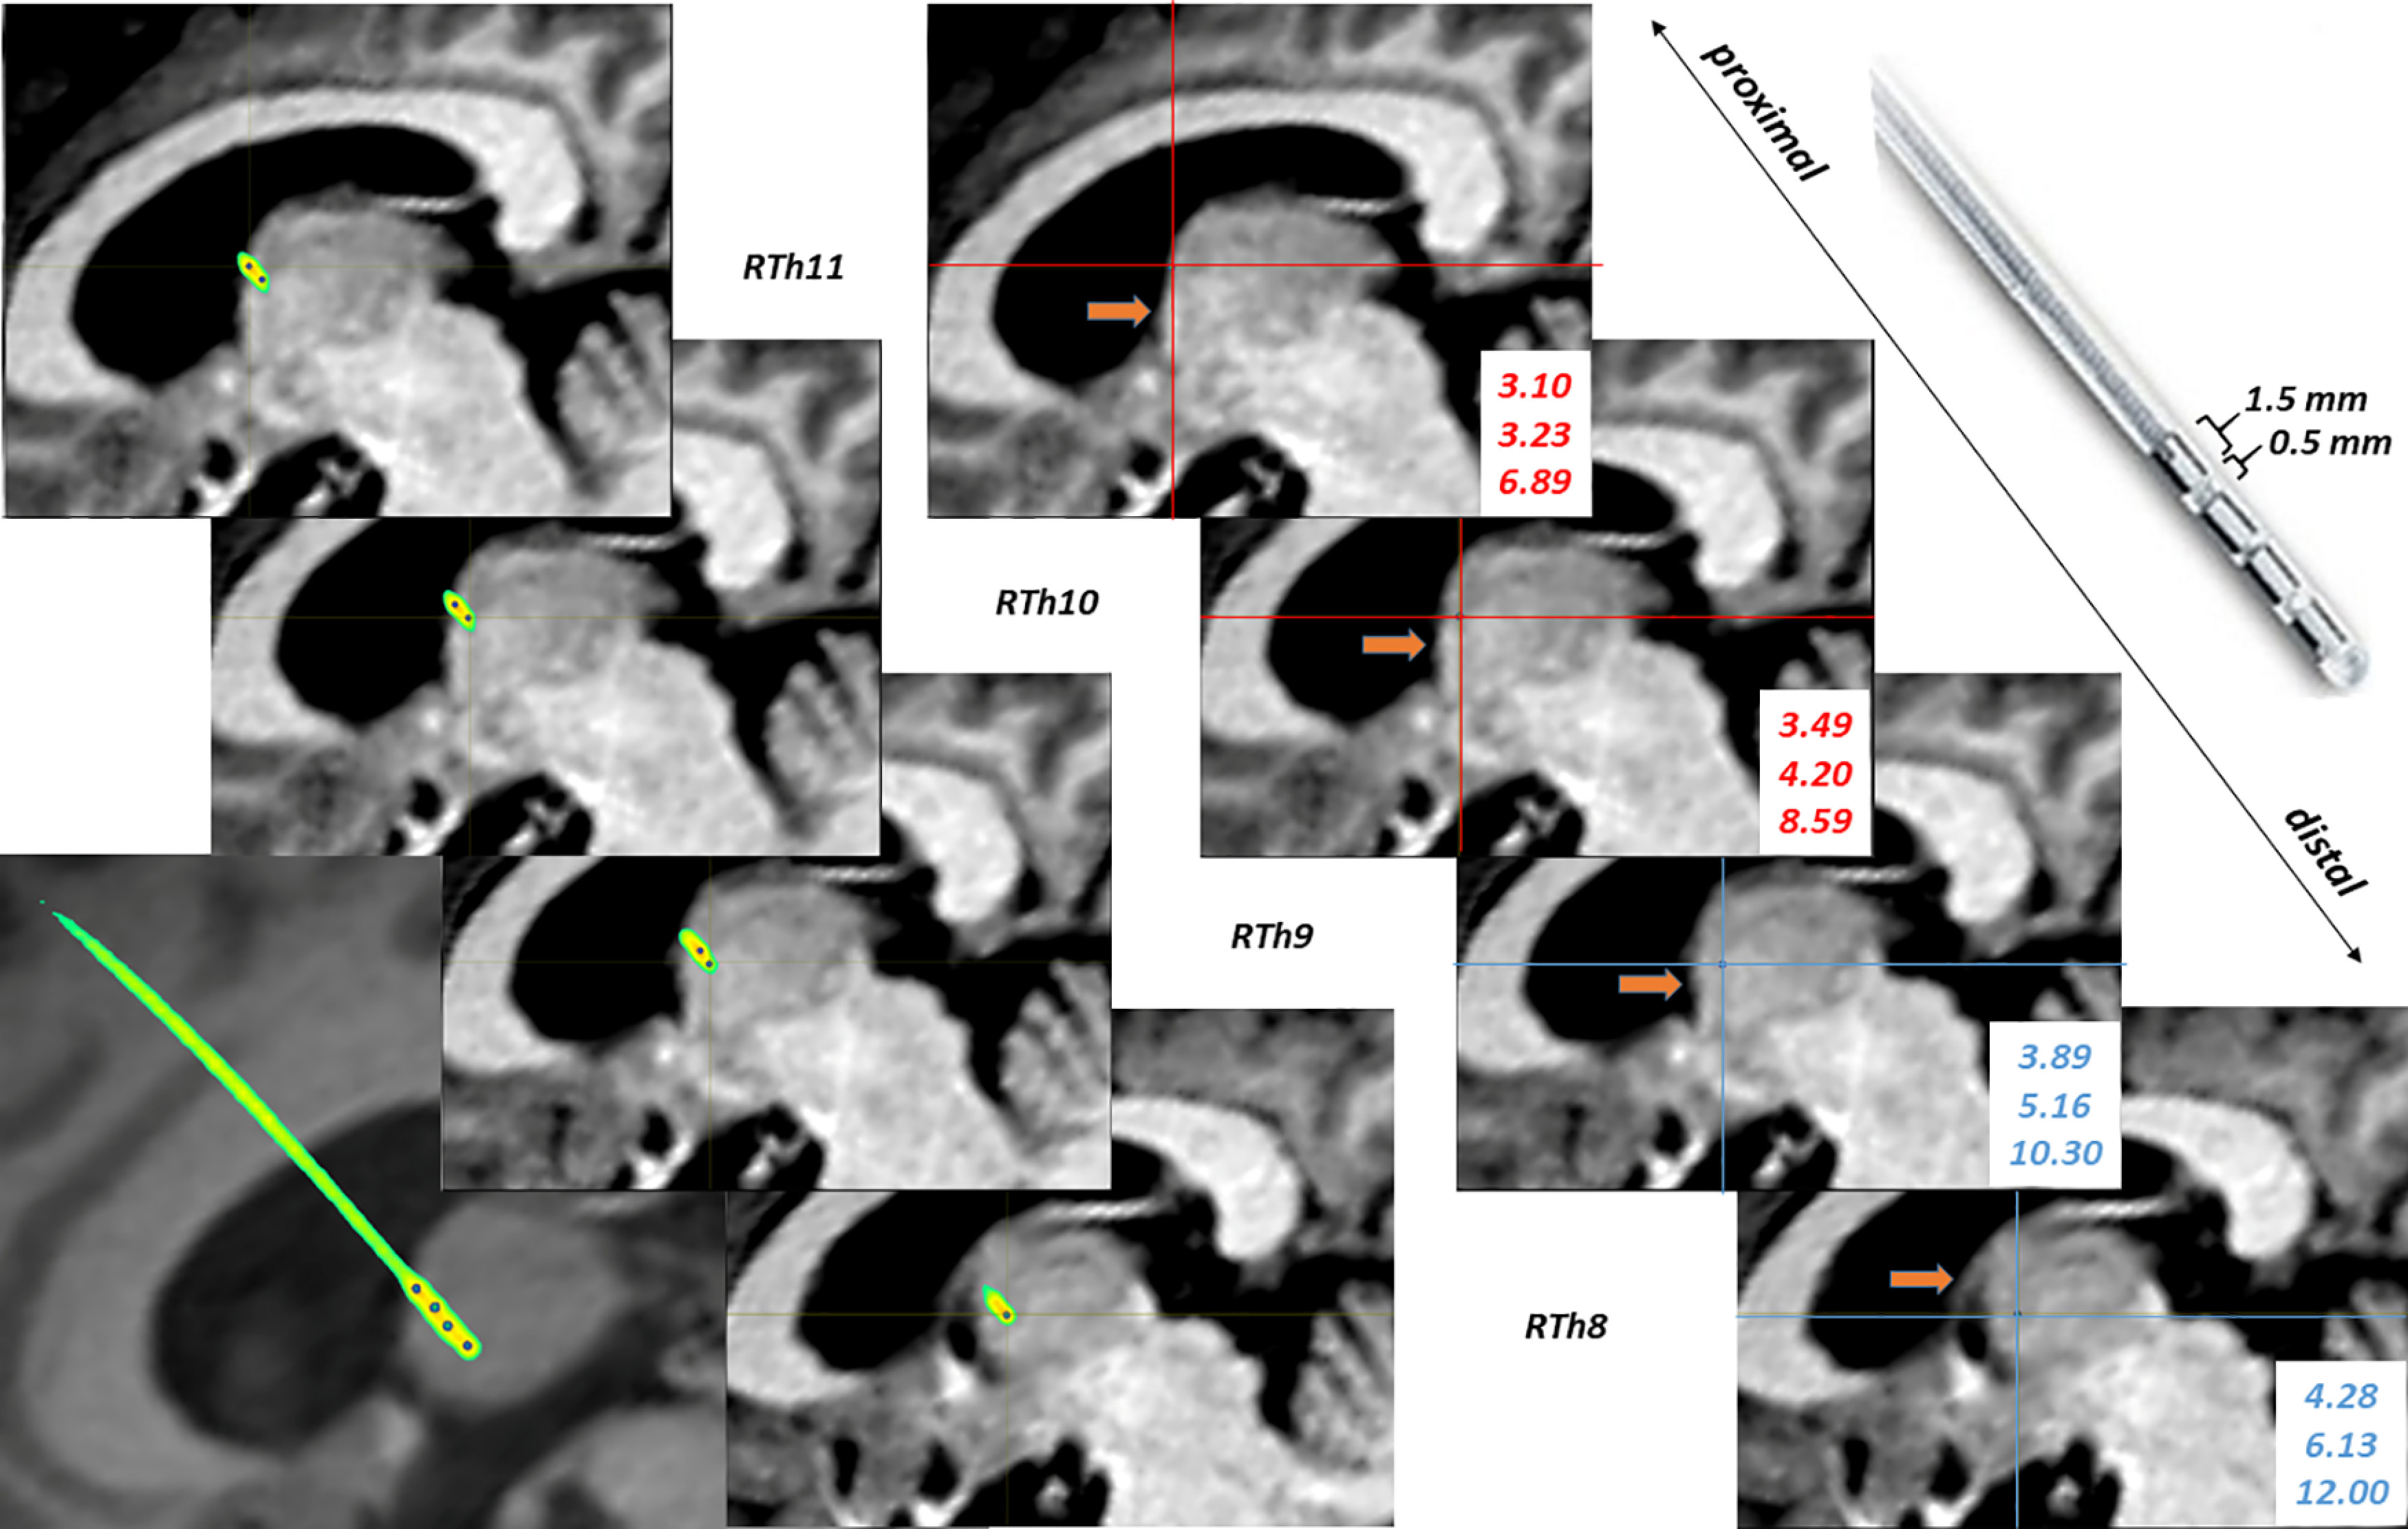
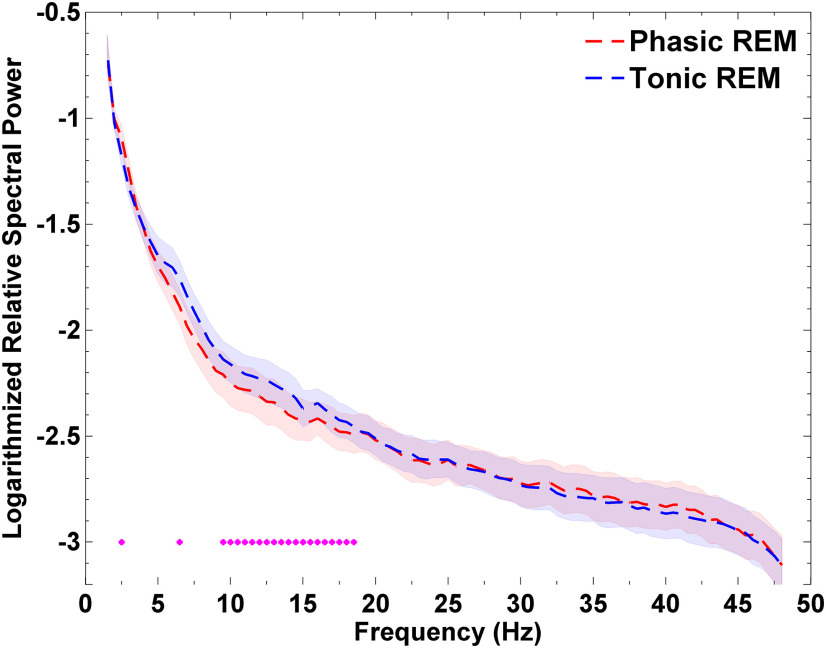
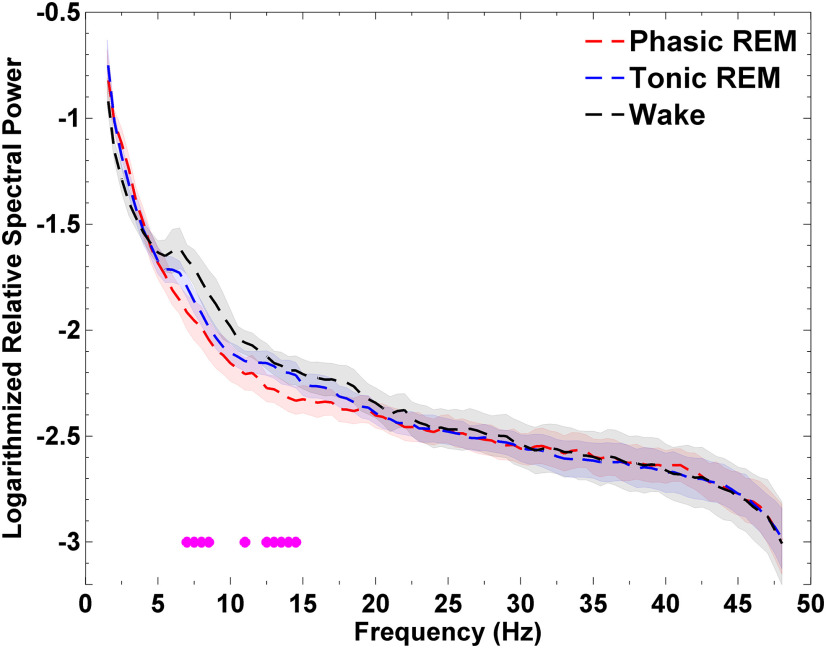
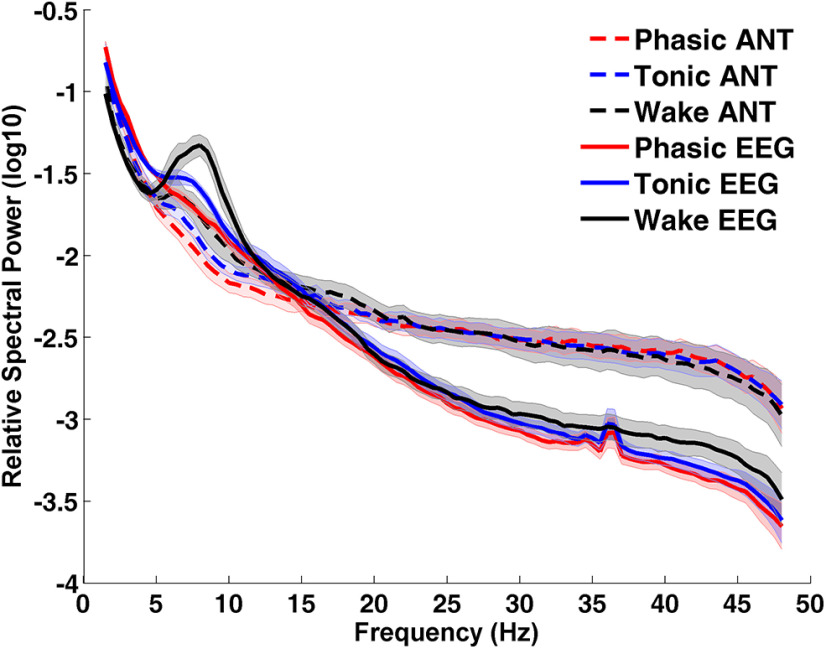
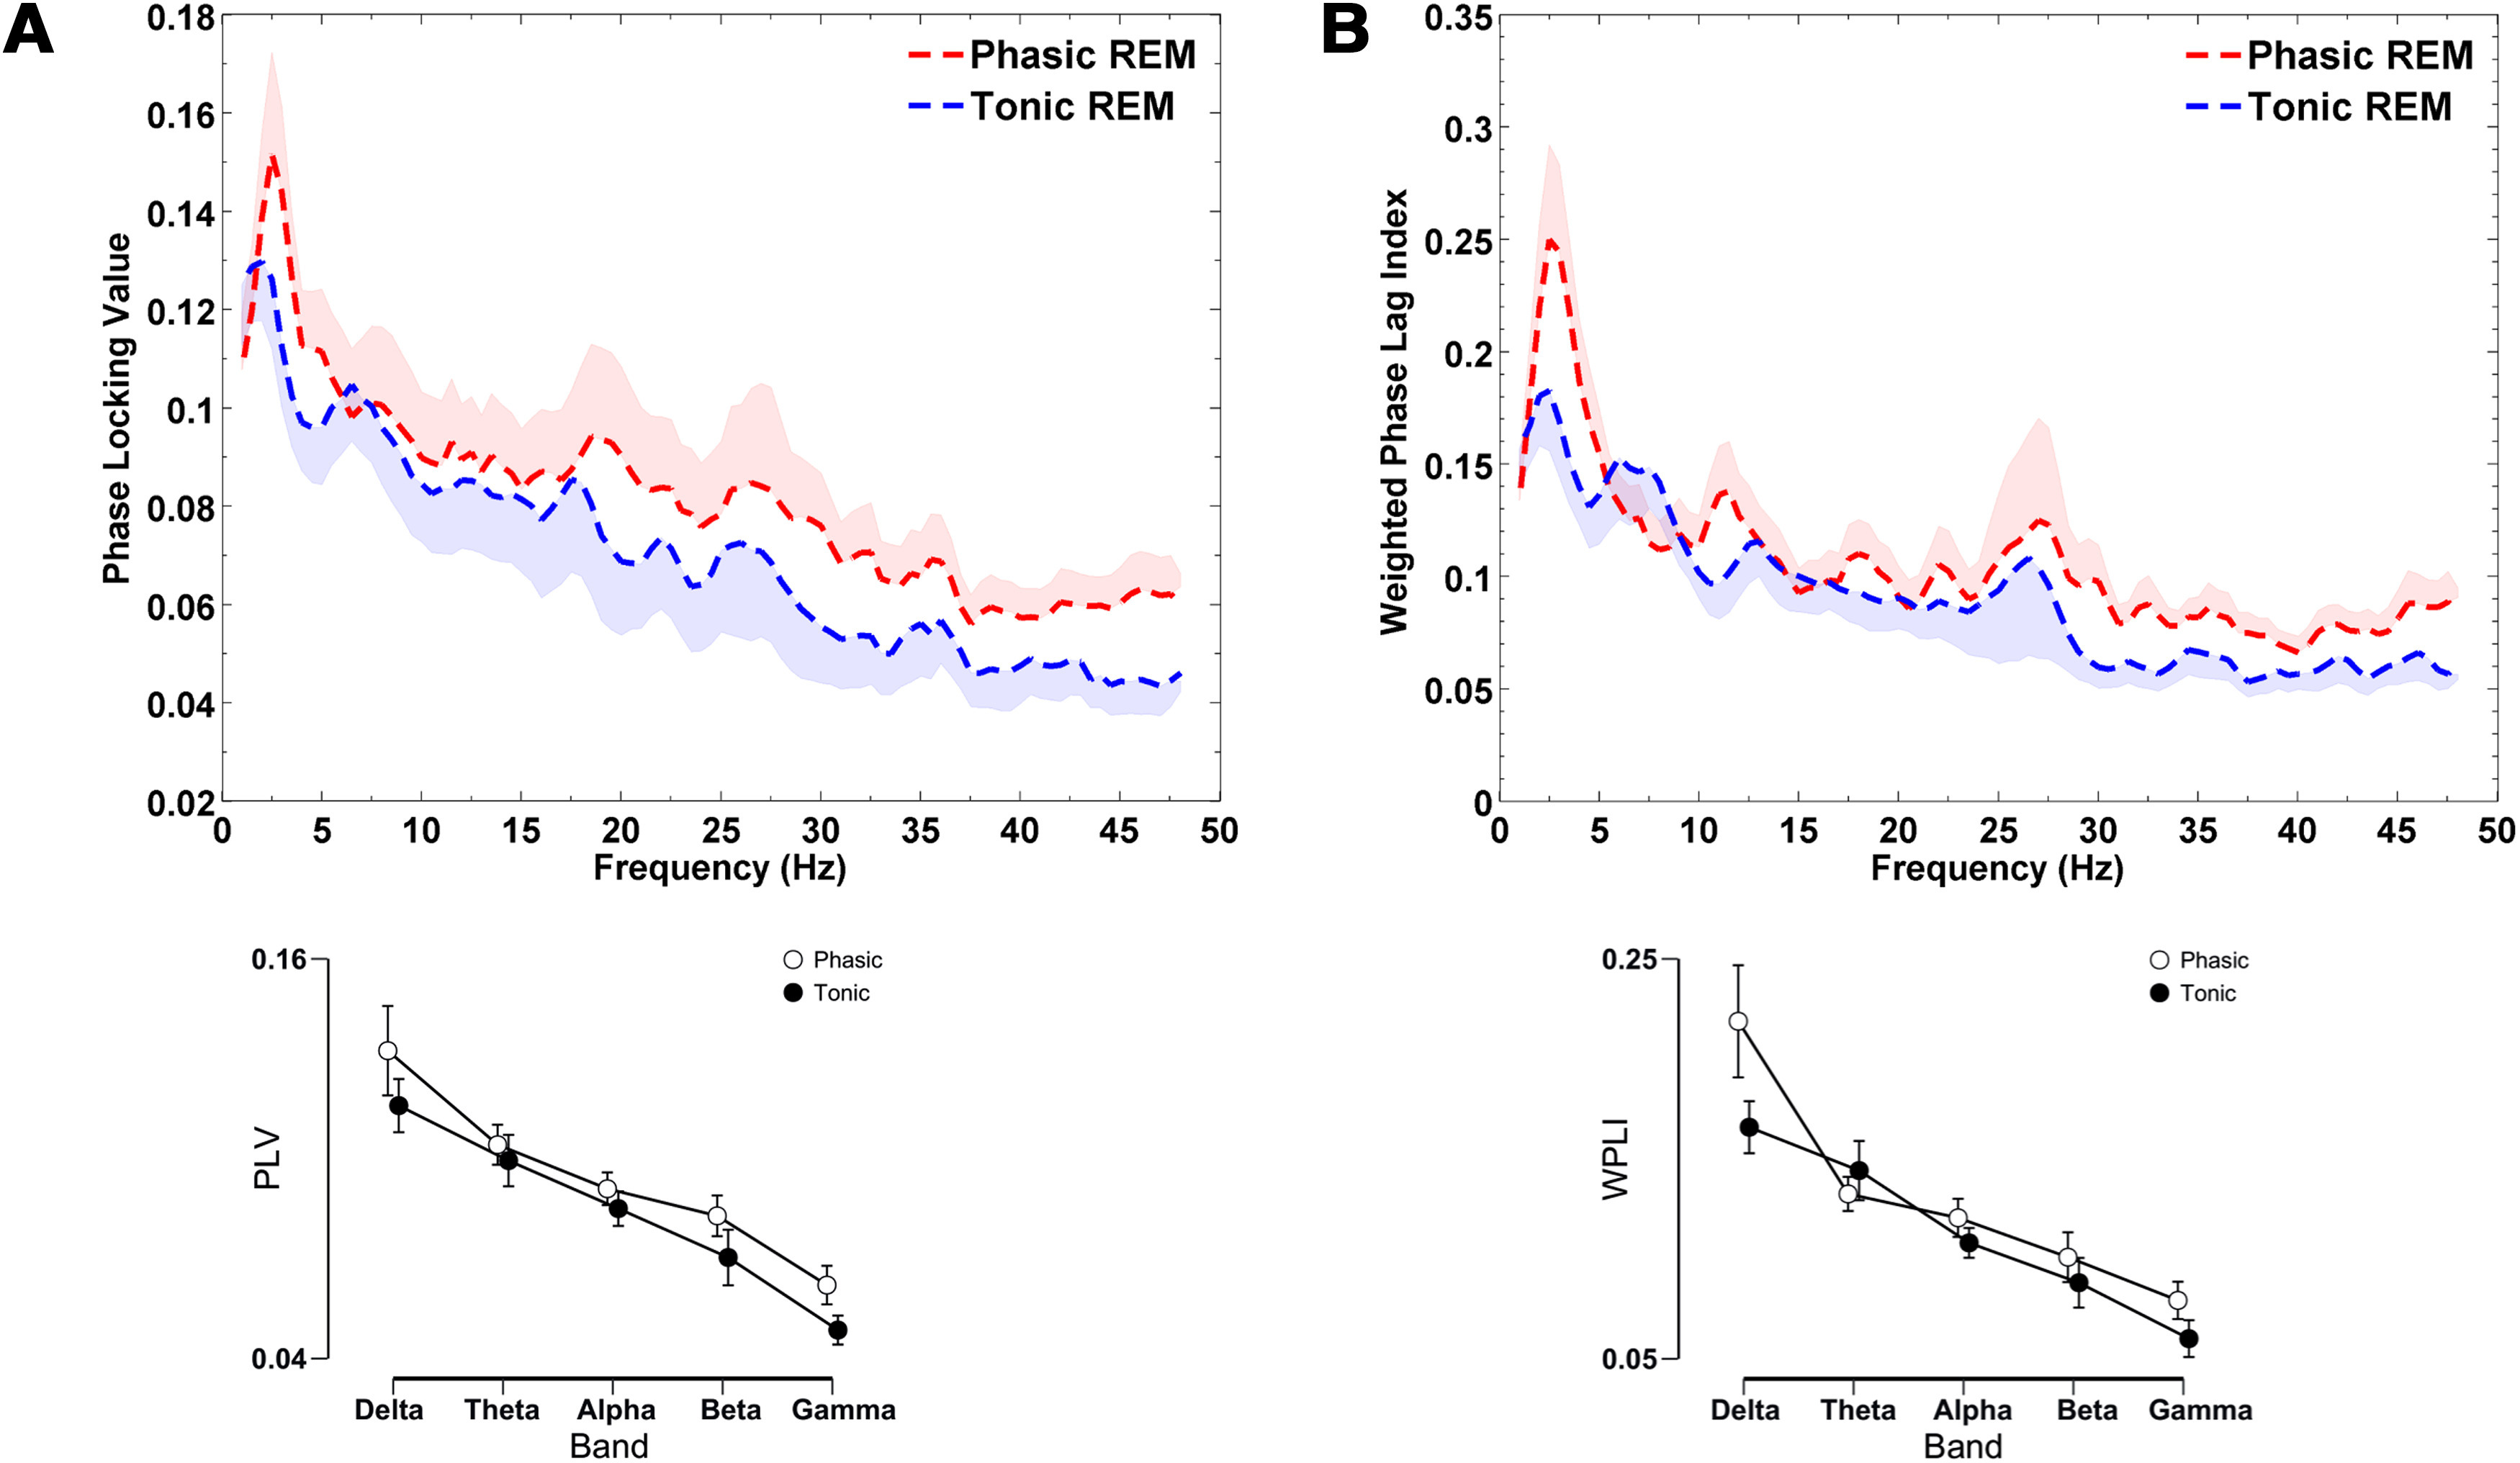
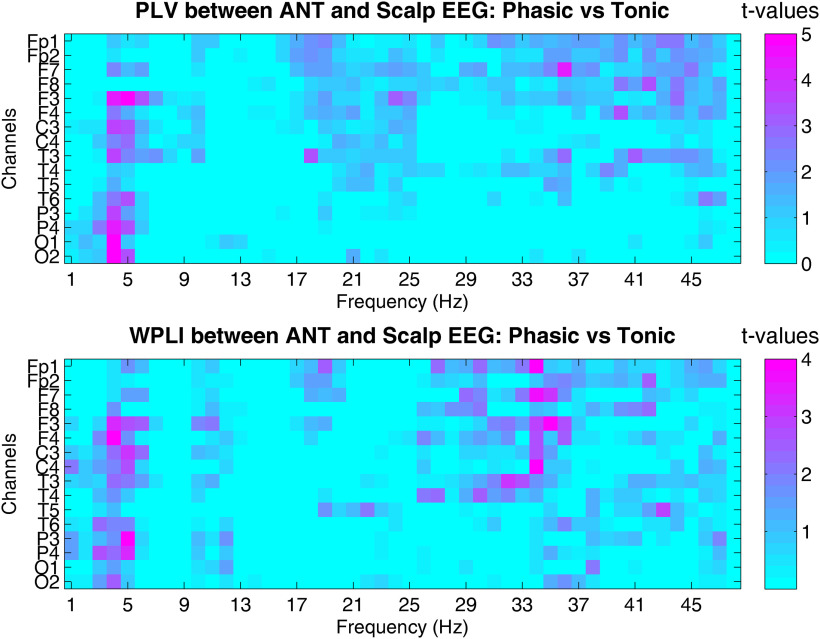
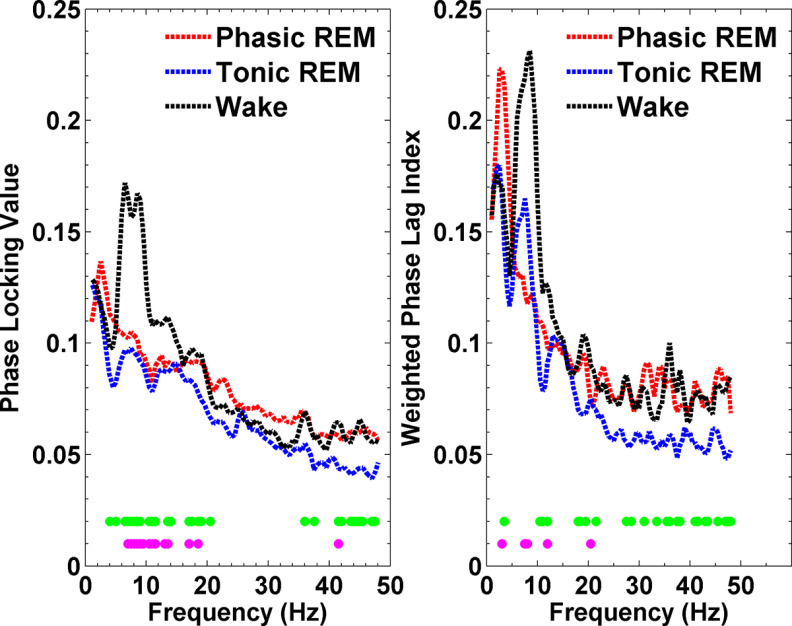
Rapid eye movement (REM) sleep is an elusive neural state that is associated with a variety of functions from physiological regulatory mechanisms to complex cognitive processing. REM periods consist of the alternation of phasic and tonic REM microstates that differ in spontaneous and evoked neural activity. Although previous studies indicate, that cortical and thalamocortical activity differs across phasic and tonic microstates, the characterization of neural activity, particularly in subcortical structures that are critical in the initiation and maintenance of REM sleep is still limited in humans. Here, we examined electric activity patterns of the anterior nuclei of the thalamus as well as their functional connectivity with scalp EEG recordings during REM microstates and wakefulness in a group of epilepsy patients (N = 12, 7 females). Anterothalamic local field potentials (LFPs) showed increased high-α and β frequency power in tonic compared with phasic REM, emerging as an intermediate state between phasic REM and wakefulness. Moreover, we observed increased thalamocortical synchronization in phasic compared with tonic REM sleep, especially in the slow and fast frequency ranges. Wake-like activity in tonic REM sleep may index the regulation of arousal and vigilance facilitating environmental alertness. On the other hand, increased thalamocortical synchronization may reflect the intrinsic activity of frontolimbic networks supporting emotional and memory processes during phasic REM sleep. In sum, our findings highlight that the heterogeneity of phasic and tonic REM sleep is not limited to cortical activity, but is also manifested by anterothalamic LFPs and thalamocortical synchronization.SIGNIFICANCE STATEMENT REM sleep is a heterogeneous sleep state that features the alternation of two microstates, phasic and tonic rapid eye movement (REM). These states differ in sensory processing, awakening thresholds, and cortical activity. Nevertheless, the characterization of these microstates, particularly in subcortical structures is still limited in humans. We had the unique opportunity to examine electric activity patterns of the anterior nuclei of the thalamus (ANTs) as well as their functional connectivity with scalp EEG recordings during REM microstates and wakefulness. Our findings show that the heterogeneity of phasic and tonic REM sleep is not limited to cortical activity, but is also manifested in the level of the thalamus and thalamocortical networks.

Keywords: REM; connectivity; sleep; synchronization; thalamus.


Figures

Figure 1.
Figure 1.
Saggital view of right-hemispheric thalamic contacts in patient #6. Parallel series of images are preoperative MRI-postoperative CT fusions showing the locations of the Medtronic electrode in the brain (left) and successive electrode contact locations based on standard coordinates (measured position of electrode contacts with respect to Mid Commissural Point in mm, left). Red cross-hairs indicate ANT-contacts, whereas blue ones are outside of the ANT (in the mediodorsal nucleus of the thalamus). Brown arrow: tractus mamillothalamicus. Left bottom image is a preoperative MRI-postoperative CT fusion in a skewed plane highlighting all right-side contacts in a single view. Right upper corner: enlarged image of the electrode with contact and intercontact lengths indicated in mm.
Figure 2.
Figure 2.
Spectral power of local field potentials (LFPs) recorded from the anterior nucleus of the thalamus (ANT) during phasic and tonic REM microstates in 12 epilepsy patients. Tonic REM periods showed relatively increased oscillatory activity in the high-alpha and beta frequency ranges between 9.5 and 18.5 Hz. Frequency bins below the statistical threshold (p < 0.05) are illustrated by magenta colored circles. Note that frequency bins were considered significant if at least three adjacent bins reached the threshold. Single bins below the threshold are also marked, but are not considered as significant. Shaded areas indicate standard errors. Permutation tests were carried out on non-normalized power spectra, but values are represented on a normalized (relative spectra) and logarithmic scale for visualization purposes.
Figure 3.
Figure 3.
Spectral power of local field potentials (LFPs) recorded from the anterior nucleus of the thalamus (ANT) during phasic and tonic REM microstates and resting wakefulness in epilepsy patients (n = 9). Tonic REM sleep appeared as an intermediate state between phasic REM and wakefulness with respect to alpha and beta frequency power. Magenta colored circles mark significant (p < 0.05) differences between phasic REM and wakefulness. (No significant bins emerged between tonic REM and wakefulness.) Note that frequency bins were considered significant if at least three adjacent bins reached the threshold. Single bins below the threshold are also marked, but are not considered as significant. Shaded areas indicate standard errors. Permutation tests were carried out on non-normalized power spectra, but values are represented on a normalized (relative spectra) and logarithmic scale for visualization purposes.
Figure 4.
Figure 4.
Spectral power in the ANT and the scalp during REM microstates and wakefulness (N = 9). Spectral power values are normalized by applying the relative spectra in order to represent spectral power densities of ANT and scalp recordings on the same scale. Logarithmic transformation was used to better visualize oscillatory activity in different frequencies. Scalp EEG power refers to the average of parietal electrodes. We selected parietal electrodes, since alpha activity is maximal on those sites.
Figure 5.
Figure 5.
Thalamocortical connectivity as assessed by the (A) PLV and (B) WPLI between the ANT LFPs and scalp EEG signals in epilepsy patients (n = 12). Phasic compared with tonic REM sleep was characterized by increased PLV and WPLI scores as revealed by a main effect of condition in the condition × frequency band repeated measures ANOVA model (PLV: F(11,1) = 11.53, p = 0.006, partial η2 = 0.51; WPLI: F(11,1) = 11.99, p = 0.005, partial η2 = 0.52). Increased functional connectivity in the phasic REM period was observed in the δ, β, and γ bands in case of the PLV and WPLI. PLV and WPLI scores were obtained by averaging all combinations of ANT and Scalp EEG channel pairs. The upper figures illustrate bin-wise indices of functional connectivity in REM microstates, and the lower graphs show functional connectivity scores averaged across frequency bands. Shaded regions (in the bin-wise illustration, upper part) and vertical bars (in the band-wise illustration, lower part) represent SEs. In case of the bin-wise illustration, only the upper half of the SEs in phasic, and the lower half of the SEs in tonic REM were visualized. A smoothing moving average filter (spanning four data points) was applied to aid visualization.
Figure 6.
Figure 6.
Region-specific aspects of thalamocortical synchronization across phasic and tonic REM microstates. The upper graph indicates bin-wise (1-48 Hz) statistical comparisons of Phase Locking Values (PLV) between phasic and tonic REM conditions in each frequency and thalamocortical (ANT and scalp EEG) channel pair. Color codes indicate paired samples t-tests across phasic and tonic conditions at each frequency and channel pair. The lower image shows the same analyses as above, but on the Weighted Phase Lag Index scores (WPLI). Thalamocortical synchronization shows increased values in phasic vs tonic REM within the delta, beta, and gamma frequency ranges by both metrics. The phasic increase in the delta band is more pronounced between the ANT and centro-parietal EEG channels, whereas the increase in beta and gamma synchrony shows an opposite pattern, that is, an antero-posterior gradient, peaking between ANT and frontopolar channel pairs.
Figure 7.
Figure 7.
Thalamocortical connectivity quantified by the PLV and the WPLI between the ANT and scalp EEG signals in resting wakefulness and REM microstates. A large peak in the α range differentiates wakefulness from phasic and tonic REM microstates in case of both measures of neural coupling; p < 0.05 obtained by nonparametric permutation tests contrasting wakefulness versus phasic REM, and wakefulness versus tonic REM are marked by magenta and green circles, respectively. PLV and WPLI scores were obtained by averaging all combinations of ANT and Scalp EEG channel pairs.

Similar articles

Cited by

References

    1. Abe T, Matsuoka T, Ogawa K, Nittono H, Hori T (2008) Gamma band EEG activity is enhanced after the occurrence of rapid eye movement during human REM sleep. Sleep Biol Rhythms 6:26–33. 10.1111/j.1479-8425.2008.00332.x - DOI
    1. Benjamini Y, Hochberg Y (1995) Controlling the false discovery rate: a practical and powerful approach to multiple testing. J R Stat Soc Series B Stat Methodol 57:289–300. 10.1111/j.2517-6161.1995.tb02031.x - DOI
    1. Bernardi G, Betta M, Ricciardi E, Pietrini P, Tononi G, Siclari F (2019) Regional delta waves in human rapid eye movement sleep. J Neurosci 39:2686–2697. 10.1523/JNEUROSCI.2298-18.2019 - DOI - PMC - PubMed
    1. Berry RB, Brooks R, Gamaldo CE, Harding SM, Marcus CL, Vaughn BV (2012) The AASM manual for the scoring of sleep and associated events. Rules, terminology and technical specifications. Darien: American Academy of Sleep Medicine. Available from http://www.aasmnet.org/resources/pdf/scoring-manual-preface.pdf.
    1. Bódizs R, Kántor S, Szabó G, Szûcs A, Erõss L, Halász P (2001) Rhythmic hippocampal slow oscillation characterizes REM sleep in humans. Hippocampus 11:747–753. 10.1002/hipo.1090 - DOI - PubMed

Publication types

LinkOut - more resources