. 2021 Apr 16;27(7):771-790.
doi: 10.1261/rna.075937.120. Online ahead of print.

Ensemble Switching Unveils a Kinetic Rheostat Mechanism of the Eukaryotic Thiamine Pyrophosphate Riboswitch

Affiliations

Ensemble Switching Unveils a Kinetic Rheostat Mechanism of the Eukaryotic Thiamine Pyrophosphate Riboswitch

Junyan Ma et al. RNA. .

Abstract

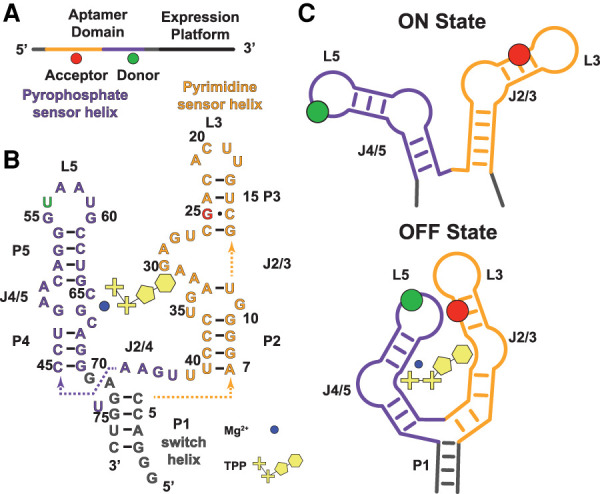
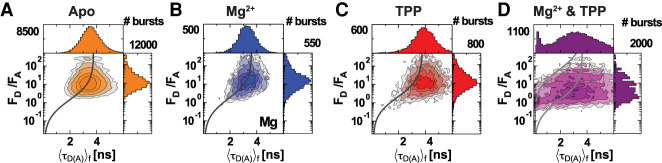
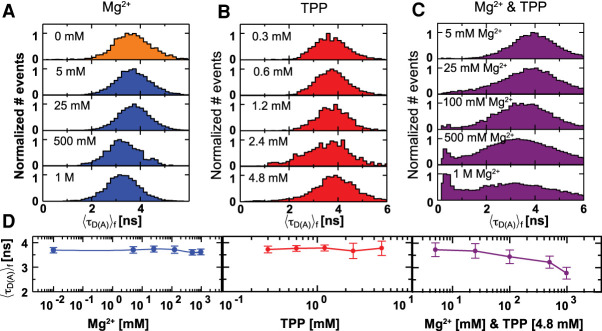
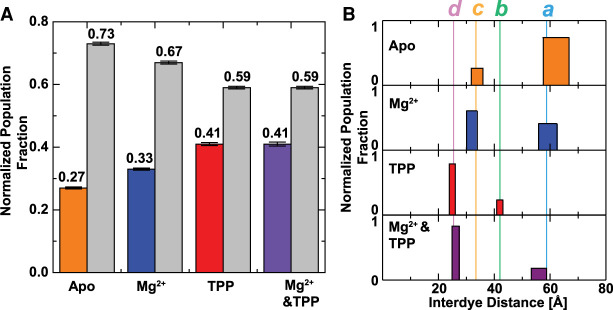
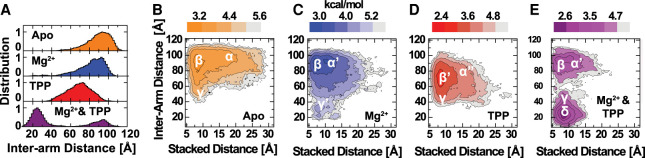
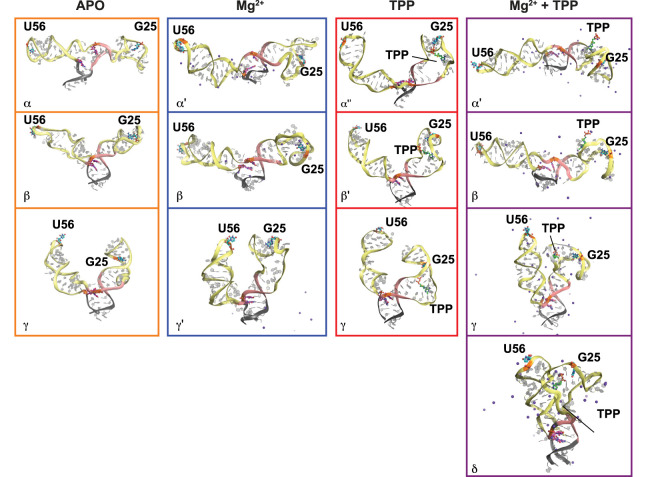
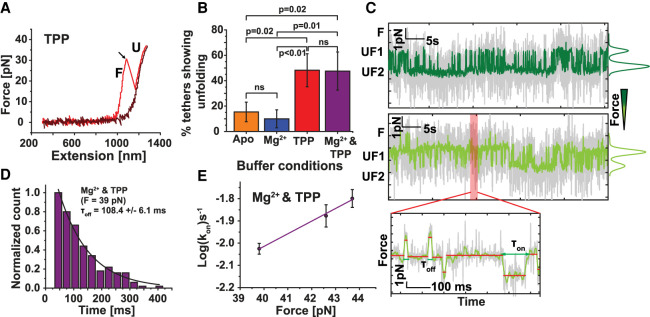
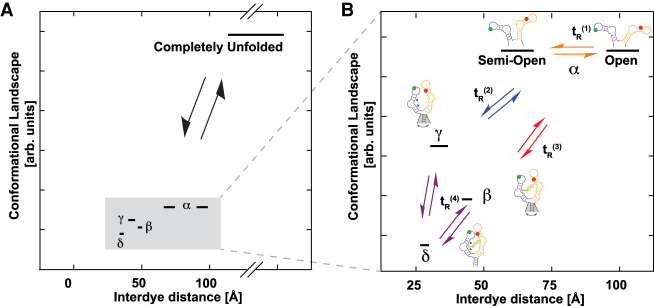
Thiamine pyrophosphate (TPP) riboswitches regulate thiamine metabolism by inhibiting the translation of enzymes essential to thiamine synthesis pathways upon binding to thiamine pyrophosphate in cells across all domains of life. Recent work on the Arabidopsis thaliana TPP riboswitch suggests a multi-step TPP binding process involving multiple riboswitch configurational ensembles and that Mg2+ dependence underlies the mechanism of TPP recognition and subsequent transition to the expression-inhibiting state of the aptamer domain followed by changes in the expression platform. However, details of the relationship between TPP riboswitch conformational changes and interactions with TPP and Mg2+ ¬¬in the aptamer domain constituting this mechanism are unknown. Therefore, we integrated single-molecule multiparameter fluorescence and force spectroscopy with atomistic molecular dynamics simulations and found that conformational transitions within the aptamer domain's sensor helices associated with TPP and Mg2+ ligand binding occurred between at least five different ensembles on timescales ranging from µs to ms. These dynamics are orders of magnitude faster than the 10 second-timescale folding kinetics associated with expression-state switching in the switch sequence. Together, our results show that a TPP and Mg2+ dependent mechanism determines dynamic configurational state ensemble switching of the aptamer domain's sensor helices that regulates the stability of the switch helix, which ultimately may lead to the expression-inhibiting state of the riboswitch. Additionally, we propose that two pathways exist for ligand recognition and that this mechanism underlies a kinetic rheostat-like behavior of the Arabidopsis thaliana TPP riboswitch.

Keywords: Discrete Molecular Dynamic simulations; Fluorescence Correlation Spectroscopy; Single molecule FRET; TPP Riboswitch.


Figures

FIGURE 1.
FIGURE 1.
Model of TPP binding to the aptamer domain of the Arabidopsis thaliana TPP riboswitch. (A) Linear schematic of the TPP riboswitch showing the expression platform (black) and the aptamer domain, highlighting the locations of the donor (green) and acceptor (red) fluorophores in the pyrophosphate (purple) and pyrimidine (orange) sensor helices, respectively, and the P1 switch helix (gray). (B) Primary and secondary structure schematic of the aptamer domain of TPP riboswitch used in all experiments and simulations. Five Watson–Crick base-paired (black) helices (P1–P5) connect through three bulges (J2/3, J2/4, and J4/5) and two loops (L3 and L5). The two sensor helix arms of the aptamer domain (P4/P5, purple and P2/P3, orange) sense the pyrophosphate (pluses) and pyrimidine (ring structure) ends of the TPP ligand (yellow), respectively, and a coordinating Mg2+ ion (blue circle). The P1 switch helix emerges from the sensor helices to form a three-way junction (J2/4), and the expression platform (not shown) extends beyond the 3′ end of the switch helix. We truncated the sequence of L3 to match the crystal structure and added donor (Alexa 488 in position 56, green) and acceptor (Cy-5 in position 25, red) fluorophores (See Materials and Methods for details on riboswitch design; Thore et al. 2006) to L5 and near L3, respectively. (C) Schematic of TPP riboswitch aptamer domain “ON” (top) and “OFF” (bottom) states. Current models of the TPP riboswitch mechanism suggest that the aptamer domain is in the “ON state” (switch helix open, top) when the sensor helix is open and the fluorescent markers (green circle for the donor, red circle for the acceptor, see Materials and Methods) are far apart (low FRET), and it is in the “OFF state” (switch helix closed, bottom) when the sensor helix is closed, and fluorescent markers are close together (high FRET), upon TPP binding between J4/5 and J2/3. Figure partially based on Thore et al. (2006) and Serganov and Nudler (2013).
FIGURE 2.
FIGURE 2.
The dynamical nature of the sensor helices depends on the presence of TPP and Mg2+. Multidimensional smFRET populations for the aptamer domain in (A) apo, (B) Mg2+, (C) TPP, and (D) Mg2+ and TPP buffers (see Materials and Methods for buffer compositions; total number of single-molecule events [bursts] are N = 94,999, N = 5,198, N = 8418, and N = 21,836, respectively). The 1D histograms indicate the number of single-molecule bursts corresponding to binned values of the FRET indicators, while the normalized 2D contours relate the two parameters to each other. The FRET indicators shown are the ratio of donor to acceptor fluorescence (FD/FA) and the average donor fluorescence lifetime 〈τD(A)f for each PIE-selected 1:1 donor-to-acceptor stoichiometry burst (see Materials and Methods). Darker contours correspond to a higher density of bursts, and static FRET lines (black line, Supplemental Information Table S2) describe the expected relationship between the FRET indicators for nonexchanging, static FRET populations according to Förster theory. Large FD/FA and large 〈τD(A)f correspond to the low FRET regime (long interdye distance), and small FD/FA and 〈τD(A)f correspond to the high FRET regime (short interdye distance). Note that two static FRET lines are needed in Mg2+ and TPP conditions (D) due to acceptor quenching (see Supplemental Information).
FIGURE 3.
FIGURE 3.
Increasing concentrations of Mg2+ in the presence of TPP induce a population of closed sensor helix states in the aptamer domain. Average fluorescence lifetime distributions of the donor in the presence of acceptor (〈τD(A)f) for FRET-labeled TPP riboswitch aptamer domains (A) with increasing concentrations of MgCl2 starting from 0 mM to 1 M, (B) with increasing concentrations of TPP starting from 0.3 mM to 4.8 mM, and (C) with increasing concentrations of MgCl2 starting from 5 mM to 1 M, all at a fixed TPP concentration of 4.8 mM. (D) Mean donor fluorescence lifetimes calculated from the data in AC. The standard deviations of the distributions are shown as error bars.
FIGURE 4.
FIGURE 4.
Identification of at least five sensor helix conformational states as a function of ligand concentration. (A) Bar plot represents the fraction of the population of molecules exhibiting FRET (color-filled bars) and no-FRET (gray bars) as determined by fluorescence decay from TCSPC FRET experiments. (B) Interdye distance distribution with a two-Gaussian distribution fitting model. a is a semi-open/open ensemble, b is an apparent intermediate ensemble, c is a second intermediate ensemble that is more compact than b, and d is the closed ensemble of the aptamer domain's sensor helices. Each sample is fitted with distances corresponding to two states plus a no-FRET/long distance state as well as the intrinsic variance (width) for each state (Table 1; Supplemental Information Table S5A,B). Widths of the bars represent the uncertainties in the mean distances for each Gaussian-distributed state.
FIGURE 5.
FIGURE 5.
The sensor helices exhibit four dynamic timescales. Example filtered FCS species auto-correlation (A, sACF) and cross-correlation (B, sCCF) functions from FRET experiments on the aptamer domain in the apo buffer. Timescales of transitions between low-FRET (LF) and high-FRET (HF) states and vice-versa appear as anticorrelation terms in the sCCF. Four distinct state transitions rates (vertical dashed lines), spanning different decades in time were identified in all conditions, as exemplified here by data obtained in the apo buffer. Shaded regions correspond to timescales typical of chain dynamics, local configurational changes, and global dynamics (Bothe et al. 2011; Mustoe et al. 2014), from darker to lighter, respectively. Functional fits are shown as solid black curves, while colored lines represent the raw correlation data. (C) Four relaxation time populations were observed in each set of conditions. Bar height represents the log of the inverse of each correlation time. fFCS fit parameters are listed in Supplemental Information Table S5C.
FIGURE 6.
FIGURE 6.
Atomistic DMD simulations of the aptamer domain find sensor helix conformational states that correlate to the FRET data. (A) The probability distribution function of the sensor helix inter-arm distance measured between G25 and U56. (BE) The two-dimensional PMFs as functions of inter-arm (G25 and U56) and P1 switch helix/P2 pyrimidine sensor helix costacked distances, measured between U39 and G73, in each simulated buffer condition. The basins correspond to a sensor arm open state with no P1/P2 costacking (α, α′, α″), sensor arm open state with P1/P2 costacking (β, β′), partially closed sensor arm conformational state with P1/P2 costacking (γ, γ′), and sensor arm closed state with P1/P2 costacking (δ).
FIGURE 7.
FIGURE 7.
Representative snapshots of the aptamer domain in the apo (α, β, γ), Mg2+ (α′, β, γ′), TPP (α″,β′, γ), and Mg2+ and TPP (α′, β, γ, δ) conditions. The states correspond to labeled basins in Figure 6B. The RNA is shown in cartoon representation, Mg2+ ions as purple spheres, and nucleotide pairs (G25, U56) and (U39, G73) highlighted in the ball-and-stick representation.
FIGURE 8.
FIGURE 8.
TPP riboswitch aptamer domain folding and unfolding kinetics. (A) A typical force extension curve (FEC) of the aptamer domain construct, in this case, in the presence of 0.5 mM TPP. The arrow represents an unfolding event, as characterized by a sudden drop in the force corresponding with an increase in the length of the tether. The red FEC represents stretching of a construct with a folded aptamer domain, and the black one represents stretching of the construct with an unfolded aptamer domain. (B) Fraction of the stretched TPP riboswitch aptamer domain constructs showing unfolding events without ligand (apo, N = 26), with 1 M Mg2+ (N = 20), with 0.5 mM TPP (N = 27), and with Mg2+ + TPP (N = 21). The occurrence of unfolding events, that is, the likelihood of finding folded TPP riboswitch aptamer domains, is significantly higher in the presence of TPP and Mg2+ and TPP buffers as compared to either in the presence of Mg2+ alone or in the absence of ligand (apo). The error bars represent the relative standard deviation of counting statistics. (C) Example time-series force data showing rapid transitions between the folded (F) and multiple unfolded states (UF) in the presence of 0.5 mM TPP, as determined by Gaussian mixture model analysis. Data was acquired using the optical tweezer at 1 kHz (gray) and smoothed using a 25 msec moving average filter (green). Sudden increases and decreases in force identify the transitions between the folded (F) and various unfolded states (UF1 and UF2). The relative population of states is shown with Gaussian fits (to the right of time-series data) for higher force (dark green, 20.0 pN) and lower force (light green, 18.6 pN). High-resolution time-series trace (inset) obtained at ∼18.6 pN pulling force. Folded states as fast as 25 msec and relatively long-lived unfolded states were detected at this force using change-point analysis. (D) Histogram of aptamer domain folded state dwell time measured in the presence of 4.8 mM TPP and 0.5 M Mg2+ and at 39.8 pN force, as determined by change point analysis. The characteristic dwell time was τoff = 108.4 ± 6.1 msec (single exponential decay fit constant ± std. error of the fit, N = 203). Histograms at additional forces can be found in Supplemental Information Figure S17. (E) The plot of log10(kon) as a function of the force in the presence of 4.8 mM TPP and 0.5 M Mg2+ where kon is the inverse of τoff (dwell time in the folded state, error bars represent the standard error of the exponential fits). Each data point (circle) represents 100–200 folded to unfolded transitions. The data were fitted using a weighted linear regression (solid line), and the dwell time at zero force was calculated to be τoff = 17.2 ± 2.6 sec (y-intercept ± std. error of the fit).
FIGURE 9.
FIGURE 9.
Conformational landscape of TPP riboswitch aptamer domain dynamics and closing pathway. (A) The completely unfolded state accessible by tweezer experiments is shown along with the conformational states observed by smFRET. The long timescale of unfolding relative to kinetics observed by smFRET indicates that a much larger energy barrier must be overcome in these transitions. States observed by smFRET are highlighted in gray. (B) Zoomed representation of states highlighted in A in the context of Mg2+ and TPP buffers. Two pathways exist from the open/semi-open ensembles (α) to the δ state. Conformational states and cartoon representations are shown along the closing pathway of the riboswitch representing the different interactions that are favored either via presence of Mg2+ or TPP (γ, and β ensembles) where the P1/P2 stacking leads to rapid fluctuations in the paring of nucleotides along the P1 switch helix (shaded in gray in the schematic representation). This is followed by stabilization of the P1 switch helix in the δ ensemble. Labels for the times associated with each of these transitions are assigned based on fFCS and MFD. The names for the observed ensembles correspond to those that qualitatively agree between smFRET experiments and DMD simulations. The apparent energy gaps between the conformations and pathways are based on the relative magnitudes of the observed dynamic timescales, with faster transition timescales indicating lower energy barriers between conformations.

Similar articles

Cited by

References

    1. Ali M, Lipfert J, Seifert S, Herschlag D, Doniach S. 2010. The ligand-free state of the TPP riboswitch: a partially folded RNA structure. J Mol Biol 396: 153–165. 10.1016/j.jmb.2009.11.030 - DOI - PMC - PubMed
    1. Andersen HC. 1980. Molecular dynamics simulations at constant pressure and/or temperature. J Chem Phys 72: 2384–2393. 10.1063/1.439486 - DOI
    1. Anthony PC, Perez CF, Garcia-Garcia C, Block SM. 2012. Folding energy landscape of the thiamine pyrophosphate riboswitch aptamer. Proc Natl Acad Sci 109: 1485–1489. 10.1073/pnas.1115045109 - DOI - PMC - PubMed
    1. Baird NJ, Ferre-D'Amare AR. 2010. Idiosyncratically tuned switching behavior of riboswitch aptamer domains revealed by comparative small-angle X-ray scattering analysis. RNA 16: 598–609. 10.1261/rna.1852310 - DOI - PMC - PubMed
    1. Baird NJ, Kulshina N, Ferre-D'Amare AR. 2010. Riboswitch function: flipping the switch or tuning the dimmer? RNA Biol 7: 328–332. 10.4161/rna.7.3.11932 - DOI - PMC - PubMed

LinkOut - more resources