. 2021 Apr 16;12(1):2281.
doi: 10.1038/s41467-021-22450-3.

Interleukin-11-expressing fibroblasts have a unique gene signature correlated with poor prognosis of colorectal cancer

Affiliations

Interleukin-11-expressing fibroblasts have a unique gene signature correlated with poor prognosis of colorectal cancer

Takashi Nishina et al. Nat Commun. .

Abstract

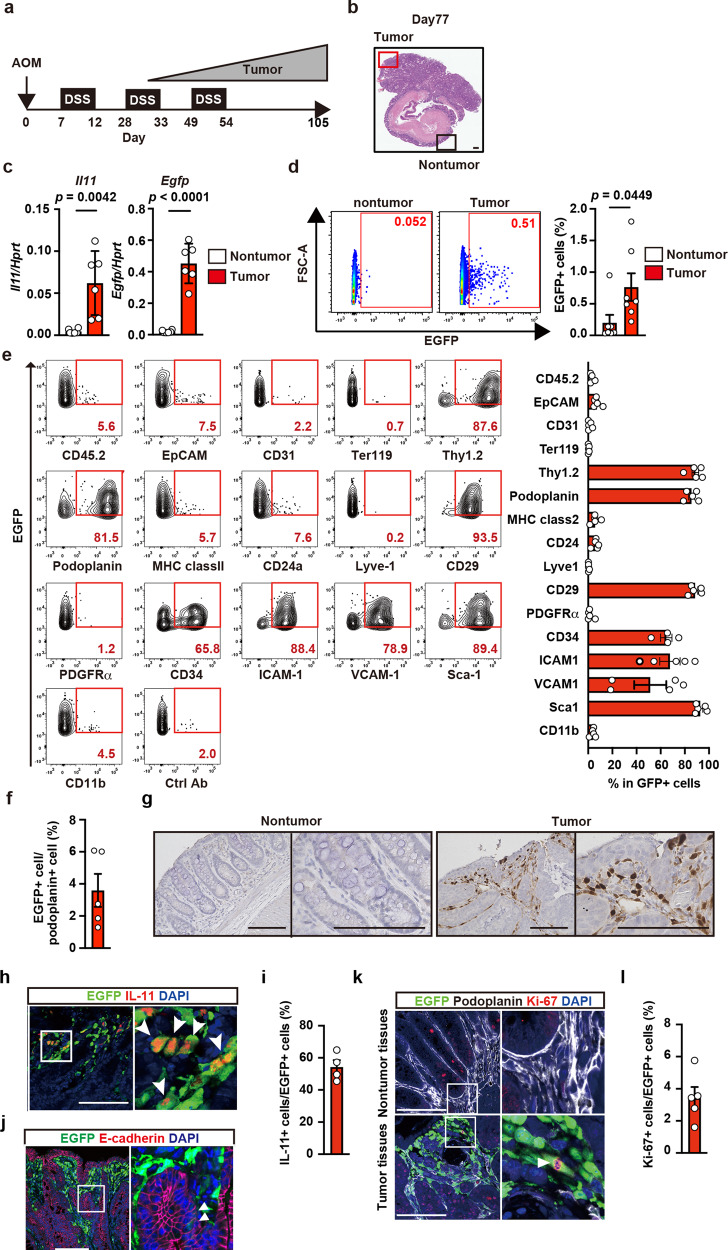
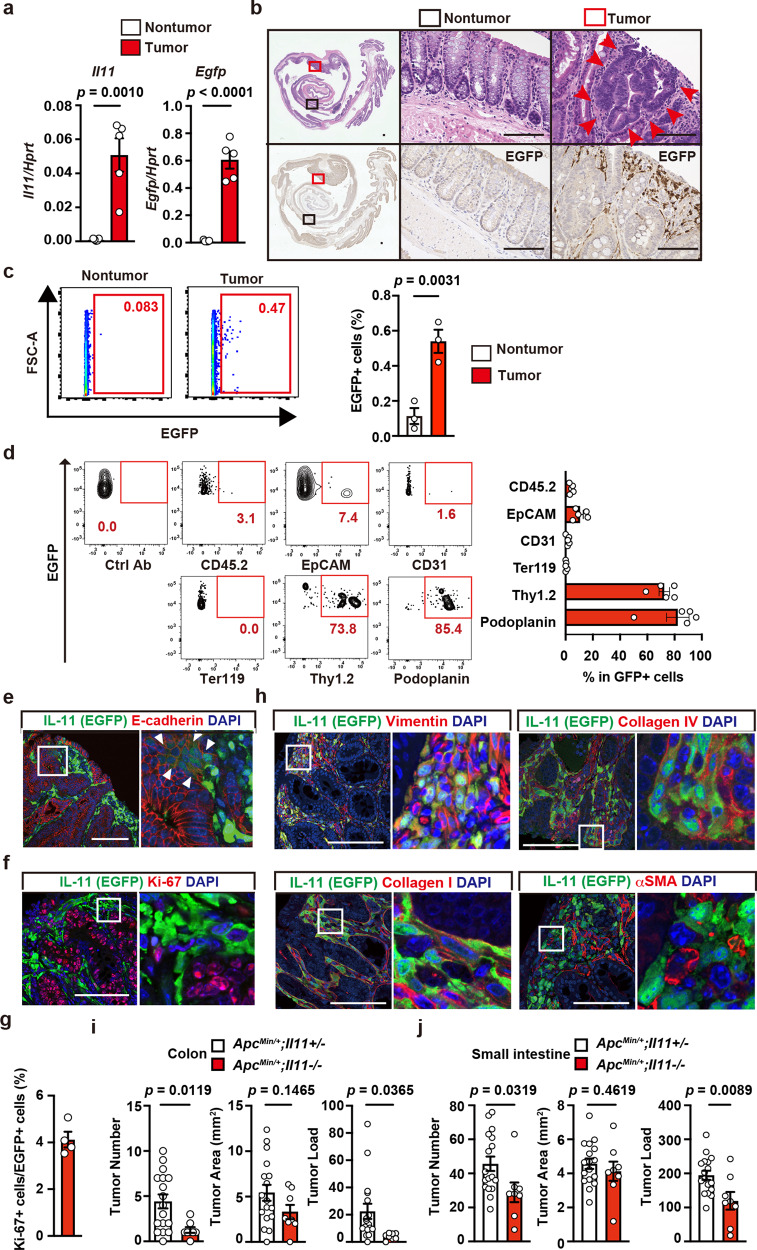
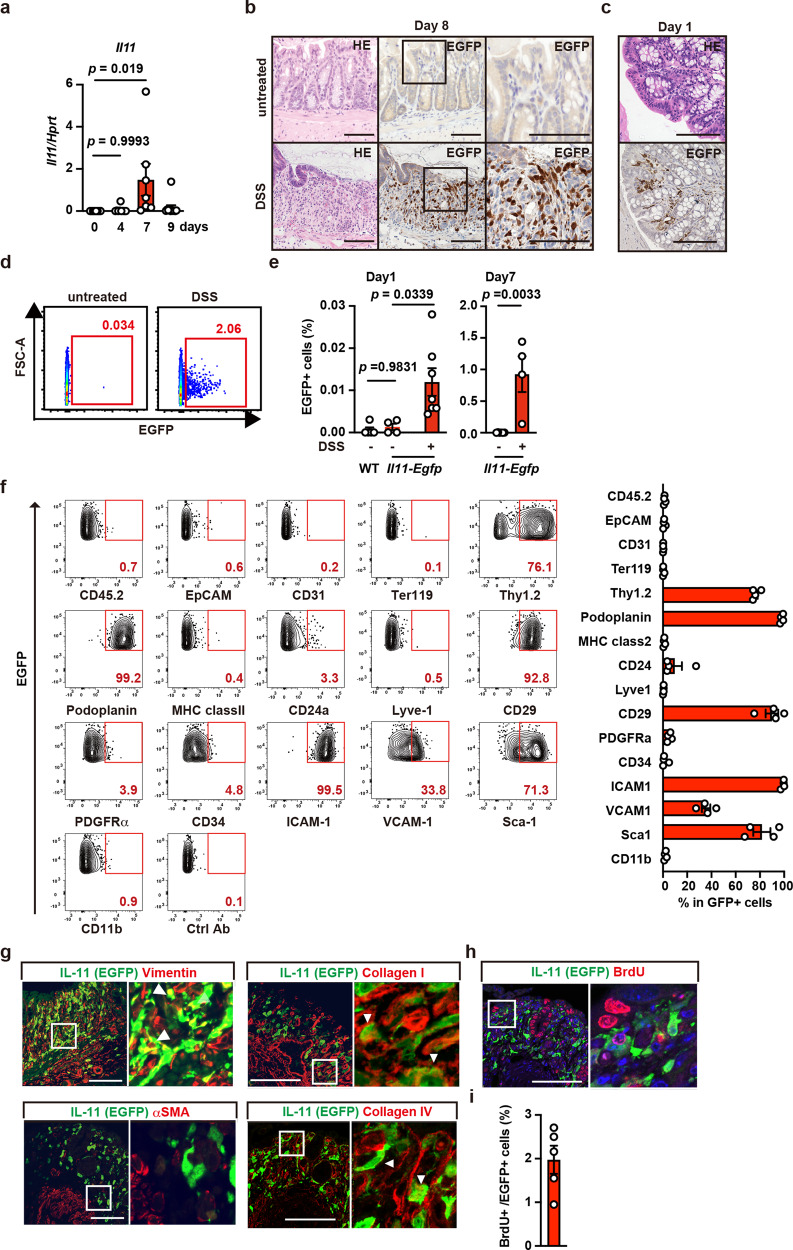
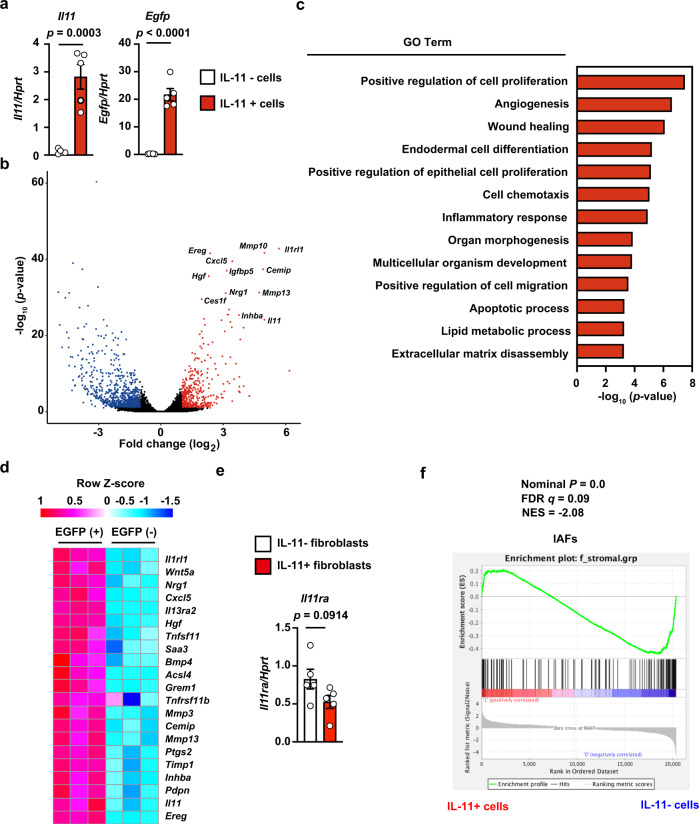
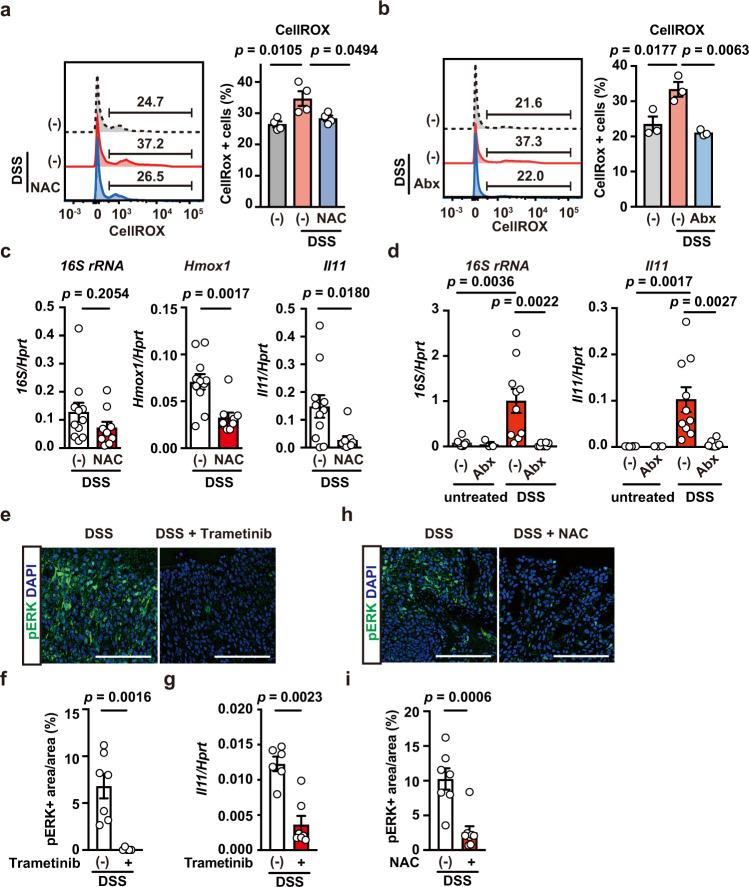
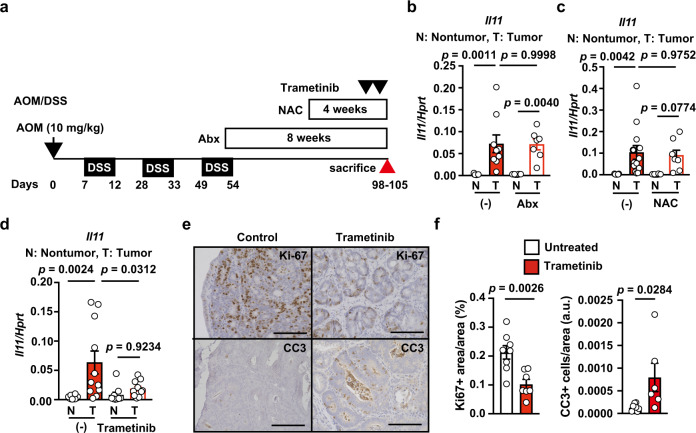
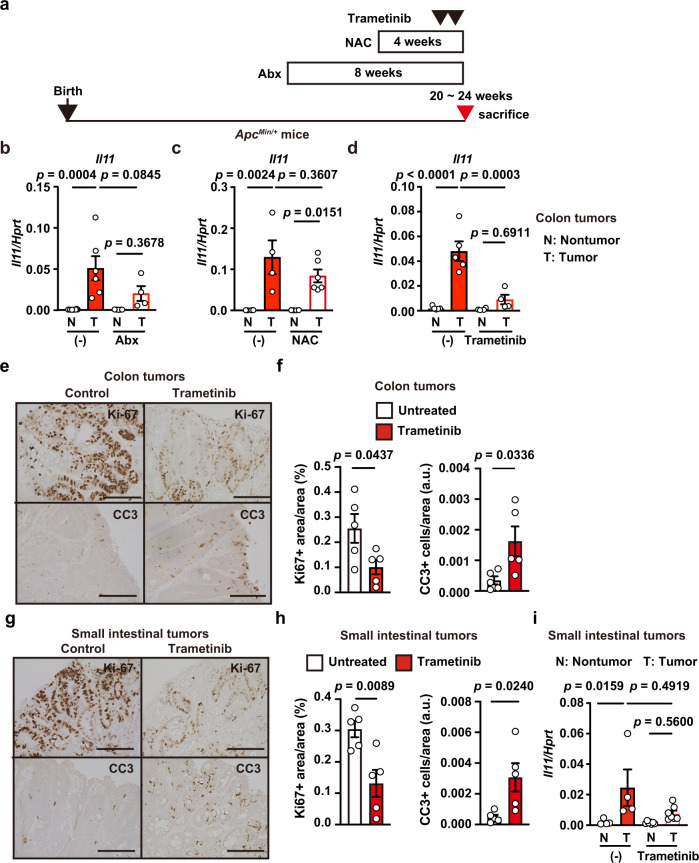
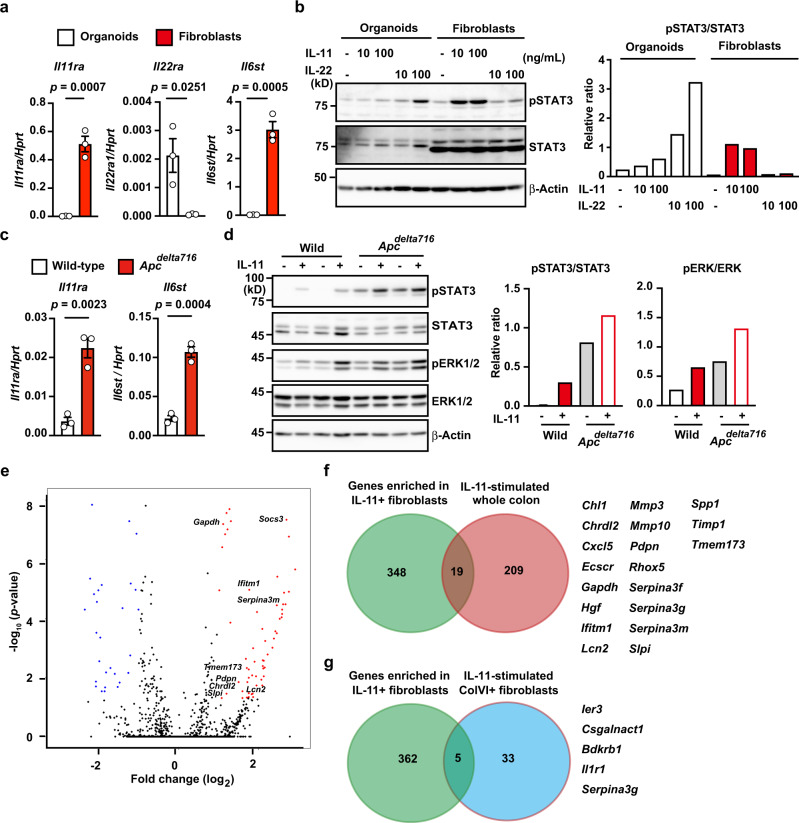
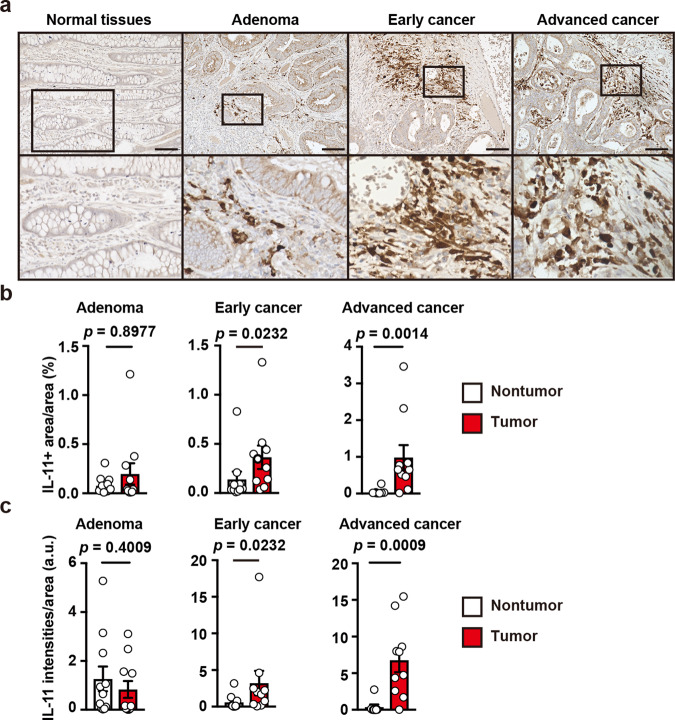
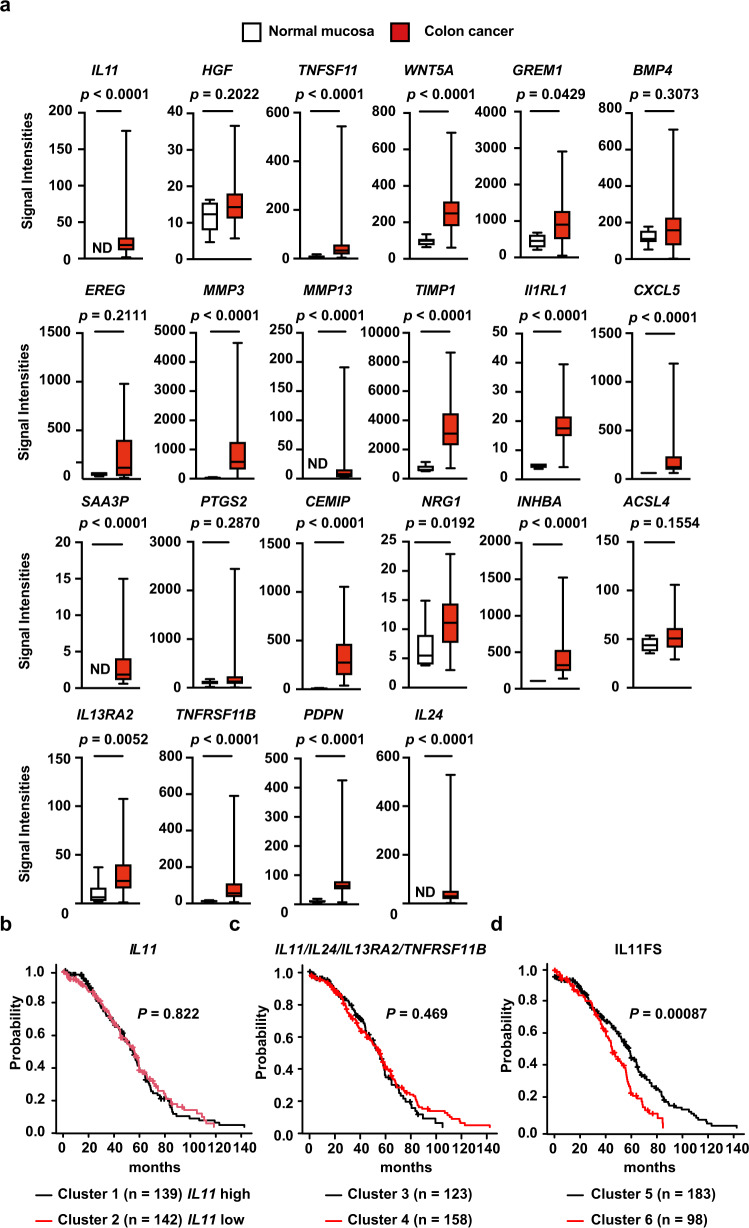
Interleukin (IL)-11 is a member of the IL-6 family of cytokines and is involved in multiple cellular responses, including tumor development. However, the origin and functions of IL-11-producing (IL-11+) cells are not fully understood. To characterize IL-11+ cells in vivo, we generate Il11 reporter mice. IL-11+ cells appear in the colon in murine tumor and acute colitis models. Il11ra1 or Il11 deletion attenuates the development of colitis-associated colorectal cancer. IL-11+ cells express fibroblast markers and genes associated with cell proliferation and tissue repair. IL-11 induces the activation of colonic fibroblasts and epithelial cells through phosphorylation of STAT3. Human cancer database analysis reveals that the expression of genes enriched in IL-11+ fibroblasts is elevated in human colorectal cancer and correlated with reduced recurrence-free survival. IL-11+ fibroblasts activate both tumor cells and fibroblasts via secretion of IL-11, thereby constituting a feed-forward loop between tumor cells and fibroblasts in the tumor microenvironment.


Conflict of interest statement

The authors declare no competing interests.

Figures

Fig. 1
Fig. 1. Characterization of IL-11+ cells in CAC using Il11-Egfp reporter mice.
a Protocol for induction of AOM/DSS-induced CAC in mice. Il11-Egfp reporter mice were intraperitoneally injected with AOM on day 0, followed by repeated DSS administration. Colorectal cancer gradually develops ~30 days after AOM injection. Unless otherwise indicated, the following experiments used tumor and nontumor tissues collected on day 98–105 after AOM/DSS treatment. b Representative image of tumor and adjacent nontumor tissues in the mouse colon on day 77 after AOM injection. Colon sections were stained with hematoxylin & eosin (H&E) (n = 20 mice). Scale bar, 200 μm. c mRNA samples from tumor and nontumor tissues were analyzed using qPCR to determine the expression levels of the indicated genes. Results are mean ± SEM (n = 6 mice). Results are representative of two independent experiments. df From colonic tumor tissues of Il11-Egfp reporter mice, single-cell suspensions were prepared, and percentages of IL-11+ (EGFP+) cells were determined. Representative flow cytometry images are shown (d). Results are mean ± SEM (n = 7 mice). Cells were stained with the indicated antibodies, and marker expression on EGFP+ cells was analyzed by flow cytometry. A representative dot plot from three independent experiments shows the percentages of EGFP+ cells expressing each marker (n = 5 mice except for CD34 where n = 4 mice) (e). Percentages of EGFP+ cells among podoplanin+ cells (f). Results are mean ± SEM (n = 5 mice). g Nontumor and tumor tissue sections were stained with anti-GFP antibody (n = 4 mice). Scale bars, 100 μm. hl Tumor sections were stained with anti-GFP along with anti-IL-11 (h) (n = 4 mice), anti-E-cadherin (j) (n = 4 mice), or anti-Ki67 (k) and anti-podoplanin (k) antibodies (n = 5 mice). The right-hand panels show enlarged images of white boxes from the left-hand panels. White arrowheads indicate EGFP+ cells expressing the respective markers shown in red. IL-11+ and EGFP+ cell numbers were calculated, and IL-11+/EGFP+ areas as percentages of the total area are shown (i). Ki67+ and EGFP+ cell numbers were calculated, and are shown as percentages of the total area (l). Results are mean ± SEM (n = 5 mice). Scale bars, 100 μm. Statistical significance was determined using the two-tailed unpaired Student’s t-test (c, d). Source data are provided as a Source Data file.
Fig. 2
Fig. 2. IL-11+ Fibroblasts appear in tumor tissues in the absence of colitis.
a Elevated Il11 and Egfp expression in colon tumors from ApcMin/+;Il11-Egfp reporter mice. Experiments were performed using tumor and nontumor tissues from the colons of ApcMin/+;Il11-Egfp reporter mice. Il11 and Egfp mRNA expression was determined by qPCR. Results are mean ± SEM (n = 5 mice). Results are representative of two independent experiments. b Colon tissue sections from ApcMin/+;Il11-Egfp reporter mice were stained with H&E (upper panels) or anti-GFP antibody (lower panels) (n = 2 mice). Middle and right panels, respectively, show enlargements of the black and red boxes from the left panels. Red arrowheads indicate tumor cells. Scale bar, 100 μm. c, d The majority of IL-11+ cells express stromal cell markers, and a few IL-11+ cells express epithelial cell markers. Colonic cells were prepared from tumors of ApcMin/+;Il11-Egfp reporter mice, stained with the indicated antibodies, and analyzed by flow cytometry. Percentages of IL-11+ cells were determined (c). Results are mean ± SEM (n = 3 mice). A representative dot plot from four independent experiments shows the percentages of EGFP+ cells expressing each marker (d). Results are mean ± SEM (n = 5 mice). eh Characterization of IL-11+ cells by IHC. Colon tumor sections from ApcMin/+;Il11-Egfp reporter mice were stained with the indicated antibodies and anti-GFP antibody (eh) (n = 4 mice). White arrowheads indicate EGFP+ cells expressing E-cadherin (e). The right-hand panels show enlarged images of white boxes from the left-hand panels. Scale bar, 100 μm. Numbers of Ki67+ EGFP+ cells and EGFP+ cells were calculated, and percentages of Ki67+ cells among EGFP+ cells are shown (g) (n = 4 mice). i, j Deletion of the Il11 gene attenuated tumor development in the colon and small intestine of ApcMin/+ mice. Numbers and areas of tumors in colon and small intestine of 20- to 24-week-old mice of the indicated genotypes were calculated and are plotted. n = 17 (ApcMin/+;Il11+/−) or 8 (ApcMin/+;Il11−/−) mice; pooled data from seven independent experiments. Statistical significance was determined by using the two-tailed unpaired Student’s t-test (a, c, i, j). Source data are provided as a Source Data file.
Fig. 3
Fig. 3. IL-11+ fibroblasts appear in the colon in DSS-treated mice and express stromal cell markers.
a Kinetics of Il11 expression in the colon after DSS treatment. WT mice were treated with 1.5% DSS in drinking water for 5 days, followed by a change to regular water. Expression of Il11 in the colon of mice on the indicated days after DSS treatment was determined using qPCR. Results are mean ± SEM. n = 8 (day 0), 9 (day 4), 7 (day 7), or 11 (day 9) mice; pooled data from two independent experiments. b, c Appearance of IL-11+ cells in submucosal tissues of the colon in Il11-Egfp reporter mice on post-DSS treatment day 8 (b) or day 1 (c). Colon tissue sections from untreated or DSS-treated Il11-Egfp reporter mice were H&E stained or immunostained with anti-GFP antibody. n = 10 (day 7~8) and 2 (day 1) mice. Right panels show enlargements of the boxes (c). Scale bar, 100 μm. df Characterization of cell surface markers on IL-11+ cells. WT and Il11-Egfp reporter mice were untreated or treated with DSS as in (a), and EGFP+ (IL-11+) cells were analyzed by flow cytometry. Representative dot plots of untreated or DSS-treated Il11-Egfp reporter mice on day 7 (d). Percentages of IL-11+ cells from the colon before and on day 1 or day 7 after DSS treatment (e). Results are mean ± SEM. n = 5 (untreated WT on day 1), 4 (untreated Il11-Egfp on day 1), 7 (DSS-treated Il11-Egfp on day 1), 6 (untreated Il11-Egfp on day 7), or 4 (DSS-treated Il11-Egfp on day 7) mice. Cells were stained with the indicated antibodies, and marker expression was analyzed on EGFP+ cells (f). Representative dot plot of four independent experiments (n = 4 mice). g Representative immunostaining of IL-11+ cells. Colon tissue sections were prepared from Il11-Egfp reporter mice as in (b) and immunostained with the indicated antibodies and anti-GFP antibody (n = 4 mice). Results are merged images. Right panels are enlarged images from the boxes. White arrowheads indicate merged cells. h, i IL-11+ cells do not proliferate in situ. Il11-Egfp reporter mice were treated with DSS as in (a) and intraperitoneally injected BrdU (40 mg/kg) on day 6. On day 7, colon sections were prepared and stained with anti-GFP and anti-BrdU antibodies (n = 5 mice). Scale bars, 100 μm. BrdU+ and EGFP+ cells were counted, and the percentages of BrdU+ cells among EGFP+ cells were plotted (i). Results are mean ± SEM (n = 5 mice). Statistical significance was determined using the one-way ANOVA with Tukey’s multiple comparison test (a, left graph in e) or the unpaired two-tailed Student’s t-test (right graph in e). Source data are provided as a Source Data file.
Fig. 4
Fig. 4. IL-11+ fibroblasts express genes associated with cell proliferation and tissue repair.
Il11-Egfp mice were treated with DSS. On day 7 after DSS treatment, cells were isolated from colons of Il11-Egfp reporter mice, and IL-11+ cells (EGFP+) and IL-11 (EGFP) cells among Ter119 CD45 CD31 EpCAM cell populations were sorted by flow cytometry. We isolated mRNA from IL-11 and from IL-11+ cells and analyzed both using RNA-seq (n = 3 mice). a Verification of enrichment of IL-11+ cells by flow cytometry. Expression of Il11 and Egfp mRNAs was determined by qPCR. Results are mean ± SEM (n = 5 mice). b Volcano plot of whole genes. The horizontal line indicates genes differentially regulated in IL-11+ cells compared with IL-11 cells, shown in log2. The vertical line indicates p-values, shown in −log10. Significantly upregulated and downregulated genes are indicated by red and blue dots, respectively. Several upregulated genes are plotted. c Gene ontology (GO) terms that were significantly enriched in IL-11+ cells compared with IL-11 cells. GO enrichment analysis of differentially expressed genes were performed using the DAVID Bioinformatics Resources. d Heat map of enriched genes in IL-11+ fibroblasts compared with IL-11 fibroblasts. Color code for heatmap indicates Z-score of gene expression. e Expression of I111ra is not different between IL-11+ and IL-11 fibroblasts. Expression of Il11ra mRNA was determined by qPCR. Results are mean ± SEM (n = 5 mice). f Gene set enrichment analysis of IAFs-related genes in IL-11+ and IL-11 fibroblasts. FDR false discovery rate, NES normalized enrichment score. Statistical significance was determined by using the two-tailed unpaired Student’s t-test (a, e) or two-tailed Kolmogorov-Smirnov test (f). The estimation of logFC and adjusted p-value were calculated using edgeR package in R (b, c).
Fig. 5
Fig. 5. The MEK/ERK Pathway is involved in Il11 upregulation in DSS-induced colitis.
a, b Wild-type mice were treated with DSS, without or with NAC (a) or Abx (b). Colon cells were prepared and stained with CellRox-green, and ROS accumulation was analyzed by flow cytometry. Left panels show representative histograms of ROS levels in colon cells. Right panels show percentages of CellRox-green+ cells from an individual mouse. Results are mean ± SEM. n = 4 (untreated or NAC-treated) or 3 (untreated or Abx-treated) mice. c Wild-type mice were treated as in a. Colonic expression of 16S rRNA, Hmox1, and Il11 mRNA was determined using qPCR. Results are mean  ± SEM. n = 11 (untreated) or 9 (NAC-treated) mice; pooled data from three independent experiments. d Abx blocks Il11 mRNA upregulation in the colon in DSS-treated mice. Wild-type mice were untreated or treated with DSS in the absence or presence of Abx. On day 5 after DSS treatment, qPCR was performed to determine the expression of bacterial 16S rRNA and Il11 mRNA in the colon. Results are mean ± SEM. n = 8 (untreated), 3 (Abx-treated), 10 (DSS-treated), or 8 (DSS + Abx-treated) mice; pooled data from three independent experiments. eg Trametinib inhibits ERK phosphorylation and Il11 mRNA expression in the colon in DSS-treated mice. Wild-type mice were treated with DSS in the absence or presence of trametinib injection (at –6 and –30 h), and then colon sections were prepared and stained with anti-pERK antibody (e). Scale bars, 100 μm. pERK+ and DAPI+ areas were calculated, and the ratios of pERK+/DAPI+ areas (%) were plotted (f). Results are mean ± SEM. n = 7 (untreated) or 5 (Trametinib-treated) mice; pooled data from two independent experiments. Il11 mRNA expression was determined using qPCR (g). Results are mean ± SEM. n = 6 (untreated) or 7 (Trametinib-treated) mice; Pooled data from two independent experiments. h, i NAC inhibits ERK phosphorylation in the colon in DSS-treated mice. Wild-type mice were treated with DSS in the absence or presence of NAC in the drinking water for 5 days. Colon sections were stained with anti-pERK antibody (h). Scale bar, 100 μm. The ratios of pERK+/DAPI+ areas (%) are plotted as in (f) (i). Results are mean ± SEM. n = 7 (untreated) or 8 (NAC-treated) mice; pooled data from two independent experiments. Statistical significance was determined using the unpaired two-tailed Student’s t-test (c, f, i), two-tailed Mann–Whitney U test (g), two-way ANOVA with Tukey’s multiple comparison test (d), or one-way ANOVA with Tukey’s multiple comparison test (a, b). Source data are provided as a Source Data file.
Fig. 6
Fig. 6. Blockade of the MEK/ERK Pathway reduces proliferation and induces apoptosis in Tumor Tissues of AOM/DSS-treated mice.
a Schema of administration of various inhibitors in AOM/DSS-treated mice. bf After induction of colorectal tumors, wild-type mice were not treated or treated with Abx for 8 weeks (b), NAC for 4 weeks (c), or trametinib at −6 and −30 h (df) (before sacrifice). On day 98–105 after AOM injection, mRNA was extracted from tumor (T) and non-tumor tissues (N), and Il11 expression was determined by qPCR (bd). Results are mean ± SEM. n = 9 (untreated), 8 (nontumor, Abx-treated), or 7 (nontumor, Abx-treated) mice; pooled data from two independent experiments (b). n = 13 (untreated) or 8 (NAC-treated) mice; pooled data from two independent experiments (c). n = 10 (nontumor, untreated), 11 (tumor, untreated), 9 (nontumor, trametinib-treated), or 10 (nontumor, trametinib-treated) mice; pooled data from four independent experiments (d). Colon tumor sections were stained with anti-Ki67 or anti-CC3 antibodies (e). Ki67+ area and total area were calculated and the percentages of Ki67+ area per area are expressed (f). n = 8 (untreated) or 7 (trametinib-treated) mice. Numbers of CC3+ cells were counted and the total area was calculated, and CC3+ cells per area are expressed as arbitrary units (a.u.) (f). n = 8 (untreated) or 6 (trametinib-treated) mice. Statistical significance was determined using the unpaired two-tailed Student’s t-test (f) and two-way ANOVA with Tukey’s multiple comparison test (bd). Source data are provided as a Source Data file.
Fig. 7
Fig. 7. Blockade of the MEK/ERK Pathway reduces proliferation and induces apoptosis in Tumor Tissues of ApcMin/+ mice.
a Schema of administration of various inhibitors to ApcMin/+ mice. b–i ApcMin/+ mice were not treated or treated with Abx for 8 weeks (b), NAC for 4 weeks (c), or trametinib at –6 and –30 h (di), then sacrificed 20–24 weeks after birth. bd Il11 expression in tumors and nontumor tissues in the colon was determined using qPCR. Results are mean ± SEM. n = 8 (nontumor, untreated), 6 (tumor, untreated), 7 (nontumor, Abx-treated) or 4 (tumors, Abx-treated) mice; pooled data from three independent experiments. n = 4 (untreated) or 6 (NAC-treated) mice; pooled data from two independent experiments. n = 5 (untreated) or 4 (trametinib-treated) mice; pooled data from three independent experiments. Colon (e) or small intestine (g) tumor tissue sections were stained with anti-Ki67 or anti-CC3 antibodies, and analyzed and are expressed as in Fig. 6f, g (f, h). Results are mean ± SEM (n = 5 mice). Il11 expression in tumors and nontumor tissues in the small intestine was determined using qPCR (i). Results are mean ± SEM. n = 4 (untreated) or 7 (trametinib-treated) mice; pooled data from three independent experiments. Statistical significance was determined using the two-way ANOVA with Tukey’s multiple comparison test (bd, i), or two-tailed unpaired Student’s t-test (f, h). Source data are provided as a Source Data file.
Fig. 8
Fig. 8. IL-11 induces signals to colonic epithelial cells and fibroblasts.
a Colonic epithelial organoids and fibroblasts were established from three independent wild-type mice as described in the methods. Expressions of the indicated genes were determined using qPCR. Results are mean ± SEM (n = 3 mice). Results are representative of two independent experiments. b Colonic epithelial organoids and fibroblasts were unstimulated or stimulated for 30 min with IL-11 (10 or 100 ng/mL) or IL-22 (10 or 100 ng/mL). Total STAT3 and phosphorylated STAT3 (pSTAT3) were analyzed by Western blotting. STAT3 and pSTAT3 signaling intensities were calculated by Fiji, and the relative ratio of pSTAT3/STAT3 is shown. Results are representative of two independent experiments (a, b). c, d Relative expression of Il11ra1 and Il6st in colon organoids. Colon organoids were established from WT and Apcdelta716 mice carrying a truncated Apc gene. Expression of the indicated genes in WT and Apcdelta716 organoids was determined using qPCR (c). Results are mean ± SEM (n = 3 independently established organoids from different mice). Colon organoids were not stimulated or stimulated with IL-11 (100 ng/mL) for 30 min (d). Total STAT3, phosphorylated STAT3 (pSTAT3), total ERK, and phosphorylated ERK (pERK) were analyzed and described as in (b). Results are representative of two independent experiments. e, f Administration of IL-11R agonist induces expression of the genes expressed in IL-11+ cells. We injected 8-week-old wild-type mice with 10 μg IL-11R agonist. At 3 h after injection, mRNA was isolated from the whole colon, and gene expression was analyzed using microarray analysis as described in “Methods” (n = 2 for untreated samples; n = 3 for injected samples). Volcano plot of whole genes (e). The horizontal line indicates differentially regulated genes in the whole colon after IL-11R agonist injection compared with the whole colon before injection, shown in log2. The vertical line indicates P values, shown in −log10. Red dots indicate significantly upregulated genes. Venn diagram of genes enriched in FACS-sorted IL-11+ fibroblasts and genes with elevated expression in the whole colon after IL-11R agonist treatment compared with an untreated colon (f). Nineteen overlapping genes are shown. g Venn diagram of genes enriched in FACS-sorted IL-11+ fibroblasts and genes induced by IL-11 stimulation in ColVI+ fibroblasts. Five overlapping genes are shown. Statistical significance was determined using the two-tailed unpaired Student’s t-test (a, c). p-values were calculated by two-tailed local-pooled-error test (e). Source data are provided as a Source Data file.
Fig. 9
Fig. 9. IL-11 expression is correlated with progression of human cancers.
ac Adenomas (n = 11) and early (n = 10) and advanced (n = 10) colorectal cancers were stained with anti-IL-11 antibody (a). Representative staining of the respective tumors and adjacent normal tissues. Scale bars, 100 μm. IL-11+ area and total area were calculated and the percentages of IL-11+ area per area are plotted (b). The intensities of IL-11+ signals and total area were calculated and intensities of IL-11+ per area are expressed as arbitrary units (a.u.) (c). Results are mean ± SEM. n = 11 (adenoma), 10 (early cancer), 8 (nontumor, advanced cancer), or 10 (tumor, advanced cancer). Scale bars, 100 μm. Statistical significance was determined using the two-sided Mann–Whitney U test (b, c). Source data are provided as a Source Data file.
Fig. 10
Fig. 10. Some Genes Enriched in IL-11+ Fibroblasts is correlated with reduced recurrence disease-free durations in human CRC.
a Expression levels of genes enriched in IL-11+ fibroblasts are elevated in human colon cancer tissues. From the data set (GSE33113), we retrieved the expression levels of the genes enriched in IL-11+ fibroblasts described in Fig. 4. The signaling intensities of each gene in normal mucosa (n = 6) and colon cancer tissues (n = 90) are shown by box-and-whisker plots. Boxes and whiskers show the 25th–75th percentile with the median and the minimum–maximum, respectively. bd Upregulation of a set of genes enriched in IL-11+ fibroblasts (IL11FS) is correlated with reduced recurrence-free survival durations in colon cancer patients. GSE17536 and GSE17537 were obtained from the Gene Expression Omnibus. Based on the expression patterns of IL11, signature genes of IAFs (IL11/IL24/IL13A2/TNFRSF11B), or IL11FS, we classified patients into two respective clusters using the hierarchical clustering method. The recurrence-free durations of each group was calculated using the Kaplan–Meier method. Statistical significance was determined using two-sided Mann–Whitney U test (a) or two-sided Mantel-Cox Log-rank test (bd). Source data are provided as a Source Data file.

References

    1. Peterson LW, Artis D. Intestinal epithelial cells: regulators of barrier function and immune homeostasis. Nat. Rev. Immunol. 2014;14:141–153. doi: 10.1038/nri3608. - DOI - PubMed
    1. Leoni G, Neumann PA, Sumagin R, Denning TL, Nusrat A. Wound repair: role of immune-epithelial interactions. Mucosal Immunol. 2015;8:959–968. doi: 10.1038/mi.2015.63. - DOI - PMC - PubMed
    1. Kurashima Y, Kiyono H. Mucosal ecological network of epithelium and immune cells for gut homeostasis and tissue healing. Annu Rev. Immunol. 2017;35:119–147. doi: 10.1146/annurev-immunol-051116-052424. - DOI - PubMed
    1. Powell DW, Pinchuk IV, Saada JI, Chen X, Mifflin RC. Mesenchymal cells of the intestinal lamina propria. Annu. Rev. Physiol. 2011;73:213–237. doi: 10.1146/annurev.physiol.70.113006.100646. - DOI - PMC - PubMed
    1. Nowarski R, Jackson R, Flavell RA. The stromal intervention: regulation of immunity and inflammation at the epithelial-mesenchymal barrier. Cell. 2017;168:362–375. doi: 10.1016/j.cell.2016.11.040. - DOI - PubMed

Publication types

MeSH terms