. 2021 Apr 16;12(1):2301.
doi: 10.1038/s41467-021-22465-w.

An integrated multi-omics analysis identifies prognostic molecular subtypes of non-muscle-invasive bladder cancer

Affiliations

An integrated multi-omics analysis identifies prognostic molecular subtypes of non-muscle-invasive bladder cancer

Sia Viborg Lindskrog et al. Nat Commun. .

Abstract

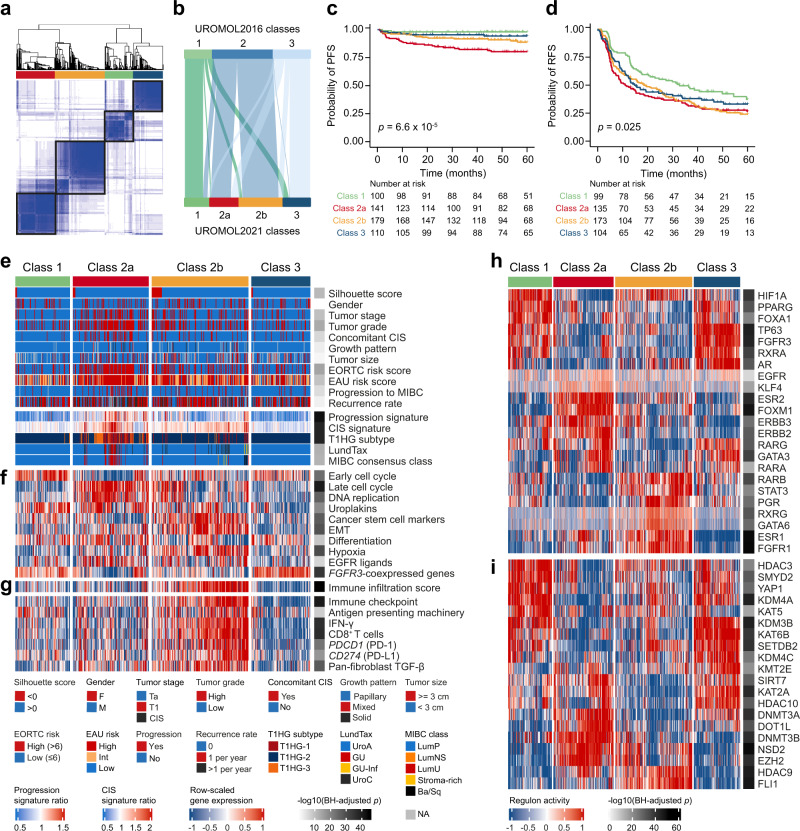
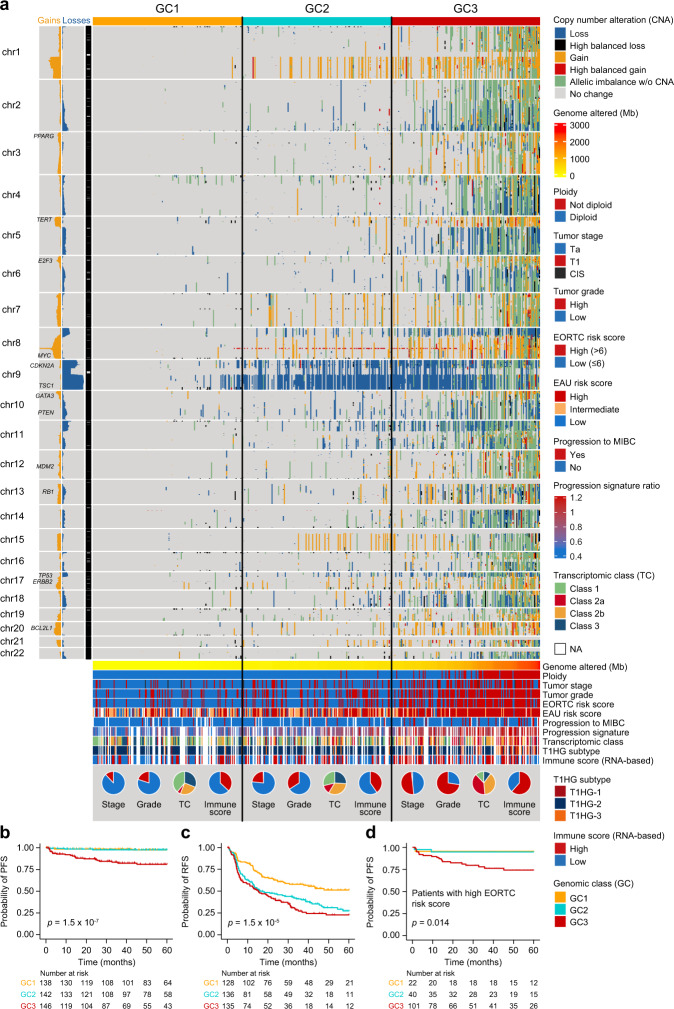
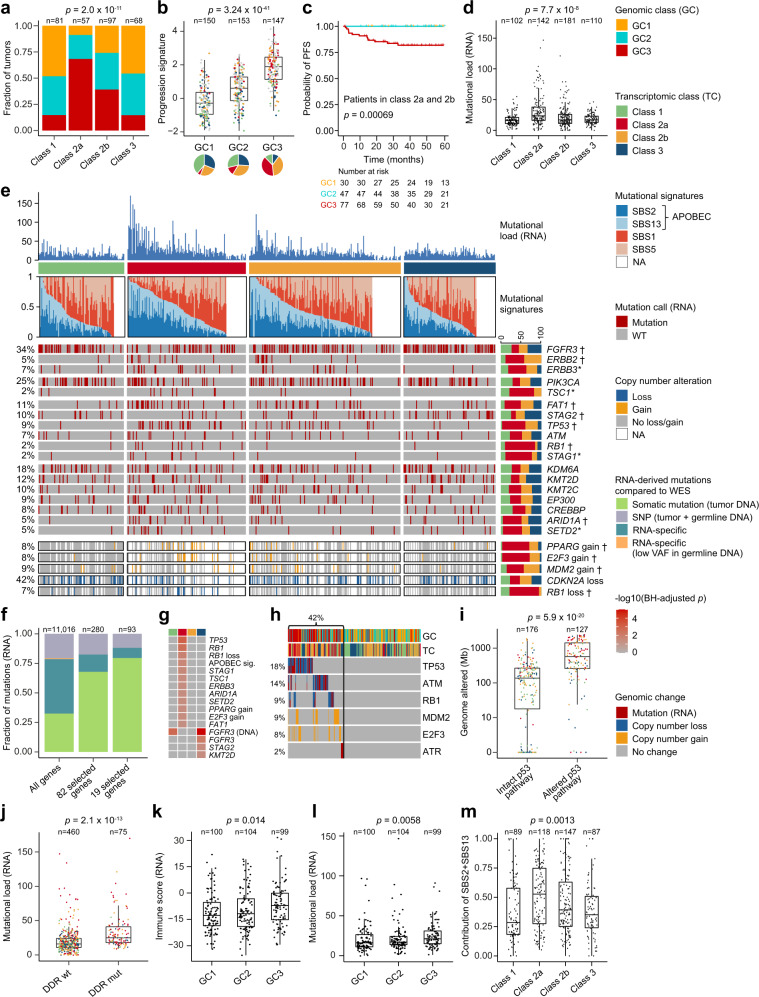
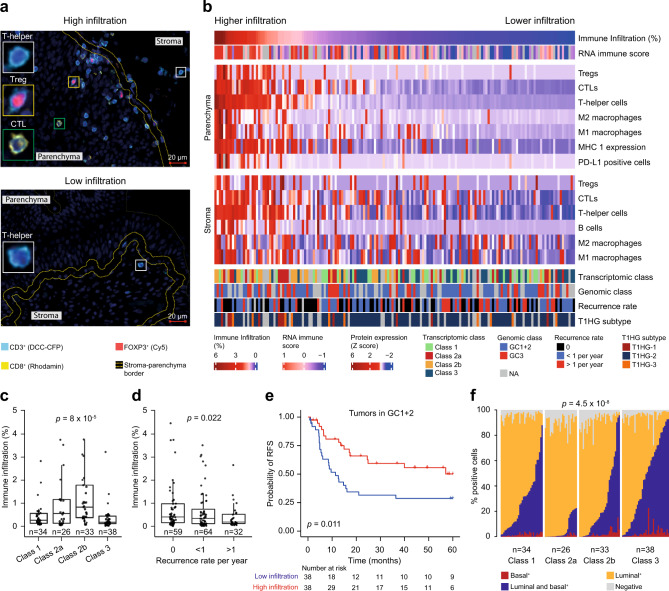
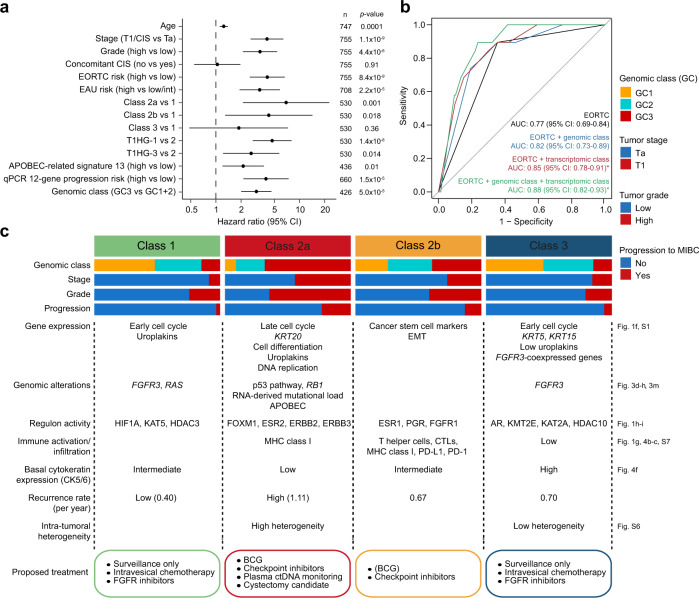
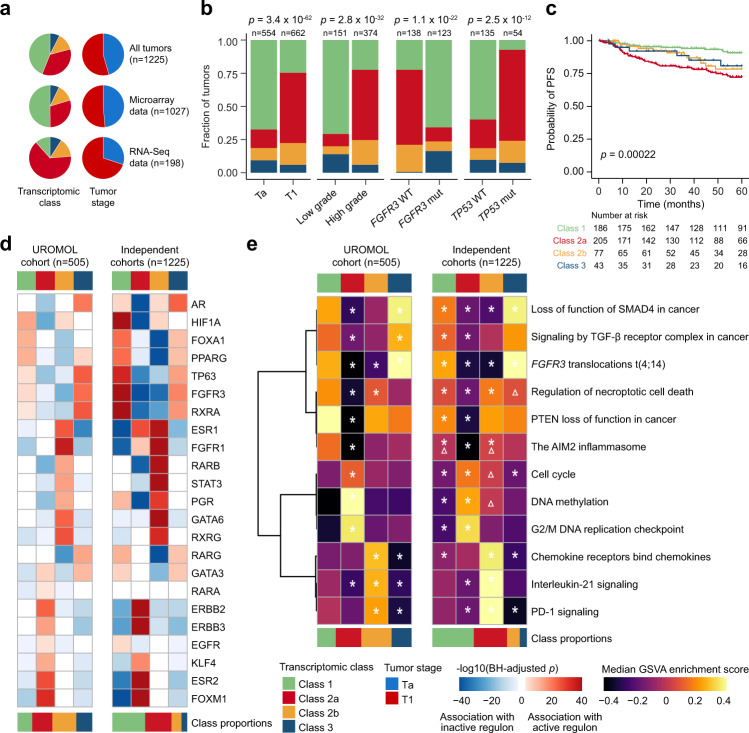
The molecular landscape in non-muscle-invasive bladder cancer (NMIBC) is characterized by large biological heterogeneity with variable clinical outcomes. Here, we perform an integrative multi-omics analysis of patients diagnosed with NMIBC (n = 834). Transcriptomic analysis identifies four classes (1, 2a, 2b and 3) reflecting tumor biology and disease aggressiveness. Both transcriptome-based subtyping and the level of chromosomal instability provide independent prognostic value beyond established prognostic clinicopathological parameters. High chromosomal instability, p53-pathway disruption and APOBEC-related mutations are significantly associated with transcriptomic class 2a and poor outcome. RNA-derived immune cell infiltration is associated with chromosomally unstable tumors and enriched in class 2b. Spatial proteomics analysis confirms the higher infiltration of class 2b tumors and demonstrates an association between higher immune cell infiltration and lower recurrence rates. Finally, the independent prognostic value of the transcriptomic classes is documented in 1228 validation samples using a single sample classification tool. The classifier provides a framework for biomarker discovery and for optimizing treatment and surveillance in next-generation clinical trials.


Conflict of interest statement

L.D. has sponsored research agreements with C2i-genomics, Natera, AstraZeneca and Ferring, and has an advisory/consulting role at Ferring. J.B.J. has sponsored research agreements with Medac, Photocure ASA, Cephaid, Nucleix, Astellas and Ferring, and has an advisory board role at Olympus Europe, Cephaid and Ferring. J.D.R. is involved in a sponsored scientific study or trial with Pacific Edge Biotechnologies, MDxHealth and Urogen Pharma, is a consultant for Urogen Pharma, and has an investment interest in American Kidney Stone Management. J.J.M. is a consultant for Ferring, AstraZeneca, Janssen and participated in advisory boards for Foundation Medicine and Nucleix. R.T.B. has contributed to advisory boards for Olympus Medical Systems & Janssen, and undertakes research funded by UroGen Pharma and QED Therapeutics. The following authors declare no competing interests: S.V.L., F.P., P.L., A.T., C.S.G., K.B.D., T.S., I.N., E.C., M.S., N.J.B., L.M., G.G.H., A.C.P., V.W., M.O.G., M.H., G.S., M.H., T.S., K.M., A.R., R.M., B.J., X.L., D.D., D.G.W., A.G., C.D.H., J.I.W., U.S., D.S., K.E.M.K., T.M., D.J.D., M.A.K., T.S., A.H., E.C.Z., P.U.M., N.M., and F.X.R.

Figures

Fig. 1
Fig. 1. Transcriptomic classes in NMIBC.
a Consensus matrix for four clusters. Samples are in both rows and columns and pairwise values range from 0 (samples never cluster together; white) to 1 (samples always cluster together; dark blue). b Comparison between the three UROMOL2016 transcriptomic classes and the UROMOL2021 four-cluster solution (76% of tumors in UROMOL2016 class 1 remained class 1, 92% of tumors in UROMOL2016 class 2 remained class 2a/2b and 67% of tumors in UROMOL2016 class 3 remained class 3). c Kaplan–Meier plot of progression-free survival (PFS) for 530 patients stratified by transcriptomic class. d Kaplan–Meier plot of recurrence-free survival (RFS) for 511 patients stratified by transcriptomic class. e, f Clinicopathological information and selected gene expression signatures for all patients stratified by transcriptomic class. Samples are ordered after increasing silhouette score within each class (lowest to highest class correlation). CIS carcinoma in situ, EORTC European Organisation for Research and Treatment of Cancer, EAU European Association of Urology, MIBC muscle-invasive bladder cancer, EMT epithelial-mesenchymal transition. g RNA-based immune score and immune-related gene expression signatures for all patients stratified by transcriptomic class. h Regulon activity profiles for 23 transcription factors. Samples are ordered after increasing silhouette score within each class (lowest to highest class correlation). Regulons (rows) are hierarchically clustered. i Regulon activity profiles for potential regulators associated with chromatin remodeling. The most-upregulated regulons within each class are shown. Regulons are hierarchically clustered. P-values were calculated using two-sided Fisher’s exact test for categorical variables, Kruskal–Wallis rank-sum test for continuous variables and two-sided log-rank test for comparing survival curves. Source data are provided as a Source data file.
Fig. 2
Fig. 2. Copy number alterations in NMIBC.
a Genome-wide copy number landscape of 473 tumors stratified by genomic class (GC) 1–3. Gains (gain + high balanced gain) and losses (loss + high balanced loss) are summarized to the left of the chromosome band panel. EORTC European Organisation for Research and Treatment of Cancer, EAU European Association of Urology, MIBC  muscle-invasive bladder cancer. b Kaplan–Meier plot of progression-free survival (PFS) for 426 patients stratified by genomic class. c Kaplan–Meier plot of recurrence-free survival (RFS) for 399 patients stratified by genomic class. d Kaplan–Meier plot of PFS for patients with high EORTC risk score (n = 163) stratified by genomic class. P-values were calculated using two-sided log-rank test. Source data are provided as a Source data file.
Fig. 3
Fig. 3. Genomic alterations associated with transcriptomic classes.
a Genomic classes (GCs) compared to transcriptomic classes (n = 303). b 12-gene qPCR-based progression risk score compared to GCs. Colors indicate transcriptomic classes. c Kaplan–Meier plot of progression-free survival (PFS) for 154 patients (including only class 2a and 2b tumors) stratified by GC. d Number of RNA-derived mutations according to transcriptomic classes. e Landscape of genomic alterations according to transcriptomic classes. Samples are ordered after the combined contribution of the APOBEC-related mutational signatures. Panels: RNA-derived mutational load, relative contribution of four RNA-derived mutational signatures (inferred from 441 tumors having more than 100 single nucleotide variations), selected RNA-derived mutated genes, copy number alterations in selected disease driver genes (derived from SNP arrays). Asterisks indicate p-values below 0.05. Daggers indicate BH-adjusted p-values below 0.05. f Comparison of RNA-derived single nucleotide variations to whole-exome sequencing (WES) data from 38 patients for 11,016 mutations in all genes, 280 mutations in the genes most frequently mutated or differentially affected between the classes (n = 82, Supplementary Fig. 5b) and 93 mutations in 19 selected bladder cancer genes (Fig. 3e). Only mutations with > 10 reads in tumor and germline DNA were considered and a mutation was called observed when the frequency of the alternate allele was above 2%. g Genomic alterations significantly enriched in one transcriptomic class vs. all others. h Overview of p53 pathway alterations for all tumors with available copy number data and RNA-Seq data (n = 303). i Amount of genome altered according to p53 pathway alteration. j Number of mutations according to mutations in DNA-damage response (DDR) genes (including TP53, ATM, BRCA1, ERCC2, ATR, MDC1). k RNA-based immune score according to GCs. l RNA-derived mutational load according to GCs. m Relative contribution of the APOBEC-related mutational signatures according to transcriptomic class. P-values were calculated using two-sided Fisher’s exact test for categorical variables, Kruskal–Wallis rank-sum test for continuous variables and two-sided log-rank test for comparing survival curves. For all boxplots, the center line represents the median, box hinges represent first and third quartiles and whiskers represent ± 1.5× interquartile range. Source data are provided as a Source data file.
Fig. 4
Fig. 4. Spatial proteomics analysis of tumor immune contexture.
a Multiplex immunofluorescence staining with Panel 1 (CD3, CD8, and FOXP3) of tumors with high- and low immune infiltration with magnifications of T helper cells (CD3+, CD8− and FOXP3−), a cytotoxic T lymphocyte (CTL; CD3+, CD8−, FOXP3−) and a regulatory T cell (Treg; CD3+, CD8− and FOXP3+). Yellow dashed lines divide the tumor tissue into parenchymal and stromal regions. Scale bar: 20 µm. All protein measurements were performed once for each distinct sample. b Spatial organization of immune cell infiltration and antigen recognition/escape mechanisms (MHC class 1 and PD-L1) with associated data for genomic class, transcriptomic class, and recurrence rate. The immune cells and immune evasion markers are defined as the percentage of positive cells in the different regions (stroma and parenchyma) and normalized using z-scores, (1) z=(xμ)σ. Columns are sorted by the degree of immune infiltration into the tumor parenchyma in descending order from left to right. c Immune infiltration stratified by transcriptomic class. Immune infiltration is defined as the percentage of total cells in the parenchyma classified as immune cells. The p-value was calculated using two-sided Wilcoxon rank-sum test. d Immune infiltration stratified by recurrence rate. The p-value was calculated by the one-sided Jonckheere–Terpstra test for trend. e Kaplan–Meier plot of recurrence-free survival (RFS) for patients with tumors with few genomic alterations (GC1 + 2) stratified by immune infiltration. P-value was calculated using two-sided log-rank test. f Distribution of CK5/6 and GATA3 positive carcinoma cells stratified by transcriptomic class. Each column represents a patient. The p-value reflects the difference in CK5/6 expression across classes and was calculated by chi-squared test. For boxplots, the center line represents the median, box hinges represent first and third quartiles and whiskers represent ± 1.5× interquartile range. Source data are provided as a Source data file.
Fig. 5
Fig. 5. Prediction models and summary characteristics of classes.
a Overview of hazard ratios calculated from univariate Cox regressions of progression-free survival using clinical and molecular features. Black dots indicate hazard ratios and horizontal lines show 95% confidence intervals (CI). Asterisks indicate p-values below 0.05 and the sample sizes, n, used to derive statistics are written to the right. CIS carcinoma in situ, EORTC European Organisation for Research and Treatment of Cancer, EAU European Association of Urology. b Receiver operating characteristic (ROC) curves for predicting progression within 5 years using logistic regression models (n = 301, events = 19). Asterisks indicate significant model improvement compared to the EORTC model (Likelihood ratio test, BH-adjusted p-value below 0.05). AUC area under the curve, CI  confidence interval. c Summary characteristics of the transcriptomic classes. Molecular features associated with the classes are mentioned, and suggestions for therapeutic options with potential clinical benefit are listed. MIBC muscle-invasive bladder cancer, EMT epithelial-mesenchymal transition, CTLs cytotoxic T lymphocytes. Source data are provided as a Source data file.
Fig. 6
Fig. 6. Validation of transcriptomic classes in independent cohorts.
a Summary of classification results and stage distribution for all tumors, tumors with microarray data and tumors with RNA-Seq data (1228 tumors were classified in total and 1225 of these were assigned to a class). b Association of tumor stage, tumor grade and FGFR3 and TP53 mutation status with transcriptomic classes. P-values were calculated using two-sided Fisher’s exact test. c Kaplan–Meier plot of progression-free survival (PFS) for 511 patients stratified by transcriptomic class. The p-value was calculated using two-sided log-rank test. d Association of regulon activities (active vs. repressed status) with transcriptomic classes in the UROMOL cohort (including samples with positive silhouette scores, n = 505) and transcriptomic classes in the independent cohorts (pooled). The heatmap illustrates BH-adjusted p-values from two-sided Fisher’s exact tests. e Pathway enrichment scores within transcriptomic classes in the UROMOL cohort (including samples with positive silhouette scores, n = 505) and transcriptomic classes in the independent cohorts (pooled). Asterisks indicate significant association between pathway and class (one class vs. all other classes, two-sided Wilcoxon rank-sum test, BH-adjusted p-value below 0.05). Triangles indicate direction swaps of pathway enrichment in the independent cohorts compared to the UROMOL cohort. GSVA  gene set variation analysis. Source data are provided as a Source data file.

Comment in

References

    1. Babjuk M, et al. EAU Guidelines on non-muscle-invasive urothelial carcinoma of the bladder: update 2016. Eur. Urol. 2017;71:447–461. doi: 10.1016/j.eururo.2016.05.041. - DOI - PubMed
    1. Svatek RS, et al. The economics of bladder cancer: costs and considerations of caring for this disease. Eur. Urol. 2014;66:253–262. doi: 10.1016/j.eururo.2014.01.006. - DOI - PubMed
    1. Dyrskjøt L, Ingersoll MA. Biology of nonmuscle-invasive bladder cancer: pathology, genomic implications, and immunology. Curr. Opin. Urol. 2018;28:598–603. doi: 10.1097/MOU.0000000000000543. - DOI - PubMed
    1. Dyrskjøt L, et al. A molecular signature in superficial bladder carcinoma predicts clinical outcome. Clin. Cancer Res. 2005;11:4029–4036. doi: 10.1158/1078-0432.CCR-04-2095. - DOI - PubMed
    1. Dyrskjøt L, et al. Gene expression in the urinary bladder: a common carcinoma in situ gene expression signature exists disregarding histopathological classification. Cancer Res. 2004;64:4040–4048. doi: 10.1158/0008-5472.CAN-03-3620. - DOI - PubMed

Publication types

MeSH terms