. 2021 Apr 16;12(1):2279.
doi: 10.1038/s41467-021-22650-x.

multiSLIDE is a web server for exploring connected elements of biological pathways in multi-omics data

Affiliations

multiSLIDE is a web server for exploring connected elements of biological pathways in multi-omics data

Soumita Ghosh et al. Nat Commun. .

Abstract

Quantitative multi-omics data are difficult to interpret and visualize due to large volume of data, complexity among data features, and heterogeneity of information represented by different omics platforms. Here, we present multiSLIDE, a web-based interactive tool for the simultaneous visualization of interconnected molecular features in heatmaps of multi-omics data sets. multiSLIDE visualizes biologically connected molecular features by keyword search of pathways or genes, offering convenient functionalities to query, rearrange, filter, and cluster data on a web browser in real time. Various querying mechanisms make it adaptable to diverse omics types, and visualizations are customizable. We demonstrate the versatility of multiSLIDE through three examples, showcasing its applicability to a wide range of multi-omics data sets, by allowing users to visualize established links between molecules from different omics data, as well as incorporate custom inter-molecular relationship information into the visualization. Online and stand-alone versions of multiSLIDE are available at https://github.com/soumitag/multiSLIDE .


Conflict of interest statement

The authors declare no competing interests.

Figures
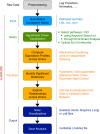
Fig. 1
Fig. 1. Visualization workflow of multiSLIDE.
Inputs to multiSLIDE are preprocessed quantitative expression profiles, formatted as delimited text files, with a separate file for each omics data. Users can select features to visualize, using keyword-based search, using the “Upload Pathways” option, or through enrichment analysis. Users can interact with the selected data using the many options for ordering/clustering of molecules and samples, as well as the customizable filtering of molecules based on differential expression levels. Once the exploration of the data reveals interesting patterns, users can save the visualizations as scalable vector graphics (SVG) or PDF files. The analysis workspace can also be saved as a.mslide file, retaining user selections and interactions, for sharing among collaborators. Snapshots of the visualization interface corresponding to this workflow are presented in Supplementary Fig. 1.
Fig. 2
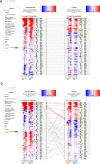
Fig. 2. Visualization of unfolded protein response in mammalian cells responding to stress.
mRNA and protein-level expressions, across eight time-points (0, 0.5. 1, 2, 8, 16, 24, and 30 h after treatment) and two replicates, are jointly visualized in multiSLIDE to understand the dynamics of UPR under ER stress. The Legends panel, on the left, enumerates the selected GO terms and pathways. The colored tags in vertical tracks alongside the heatmap indicate associations between genes and GO terms/pathways. Panels a and b represent the two modes of visualization, synchronized and independent (unsynchronized), respectively. In the synchronized clustering mode, the same order of genes is applied to both the mRNA and protein levels. In the independent clustering mode, mRNA and protein data were clustered independently, using Euclidean distance and complete linkage.
Fig. 3
Fig. 3. Visualization of kinase-substrate relationships in the CPTAC Ovarian Cancer data.
a Visualization of the subset of kinases-substrate pairs, which are upregulated in the proliferative subtype. The custom “Upload” option is used to select the molecules here. Kinase-substrate interactions were curated from PhosphoSitePlus, PhosphoNetworks, and a predictive network inference approach to build a kinase-substrate map, which was uploaded into multiSLIDE using the upload network feature. The connecting lines show these curated relationships, with the highlighted (brown) lines connecting cyclin-dependent kinases CDK1 and CDK2 with known substrates. Supplementary Fig. S5 visualizes all the kinases-substrate pairs. b A UMAP visualization of the whole proteomics data for 3329 proteins. The ellipse highlights a cluster of proliferative subtype patients in the protein data. c A UMAP visualization of the whole phosphoproteome data for 5746 phosphosites. The ellipsis highlights a cluster of proliferative subtype patients in the phosphoproteome data.
Fig. 4
Fig. 4. Visualization of plasma proteins and microRNAs associated with insulin resistance.
Shown in the heatmap are the molecules matched by the keywords: metabolism, inflammatory response, glucose transport, and lipid homeostasis are visualized here after filtering by Mann–Whitney U-test (p value ≤ 0.05 followed by FDR 5%). Proteins and miRNA are independently clustered using correlation distance (1 minus Pearson correlation) and complete linkage function. The relationships between miRNA family names and their target proteins are extracted from TargetScanMap. The original list of 414 proteins and 69 miRNAs, before filtering, is shown in Supplementary Fig. S7.

Similar articles

Cited by

References

    1. Hasin Y, Seldin M, Lusis A. Multi-omics approaches to disease. Genome Biol. 2017;18:83. doi: 10.1186/s13059-017-1215-1. - DOI - PMC - PubMed
    1. Gao J, et al. Integrative analysis of complex cancer genomics and clinical profiles using the cBioPortal. Sci. Signal. 2013;6:l1–pl1. doi: 10.1126/scisignal.2004088. - DOI - PMC - PubMed
    1. Goldman M, et al. Visualizing and interpreting cancer genomics data via the Xena platform. Nat. Biotechnol. 2020;38:675–678. doi: 10.1038/s41587-020-0546-8. - DOI - PMC - PubMed
    1. Vasaikar SV, Straub P, Wang J, Zhang B. LinkedOmics: analyzing multi-omics data within and across 32 cancer types. Nucleic Acids Res. 2018;46:D956–D963. doi: 10.1093/nar/gkx1090. - DOI - PMC - PubMed
    1. Weinstein JN, et al. The cancer genome atlas pan-cancer analysis project. Nat. Genet. 2013;45:1113. doi: 10.1038/ng.2764. - DOI - PMC - PubMed

Publication types

LinkOut - more resources