. 2021 Apr 16;7(1):37.
doi: 10.1038/s41522-021-00209-4.

Experimental parameters defining ultra-low biomass bioaerosol analysis

Affiliations

Experimental parameters defining ultra-low biomass bioaerosol analysis

Irvan Luhung et al. NPJ Biofilms Microbiomes. .

Abstract

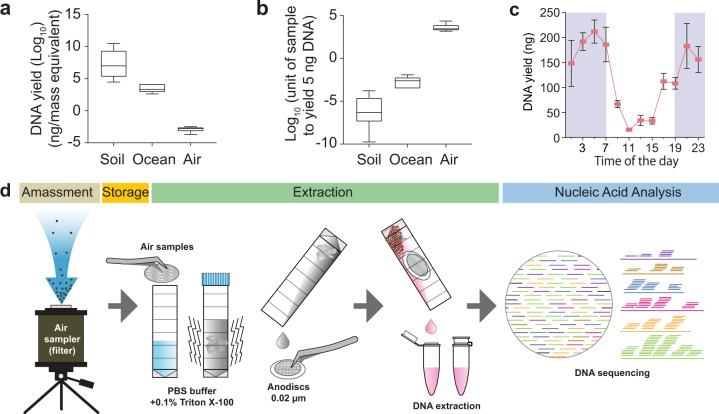
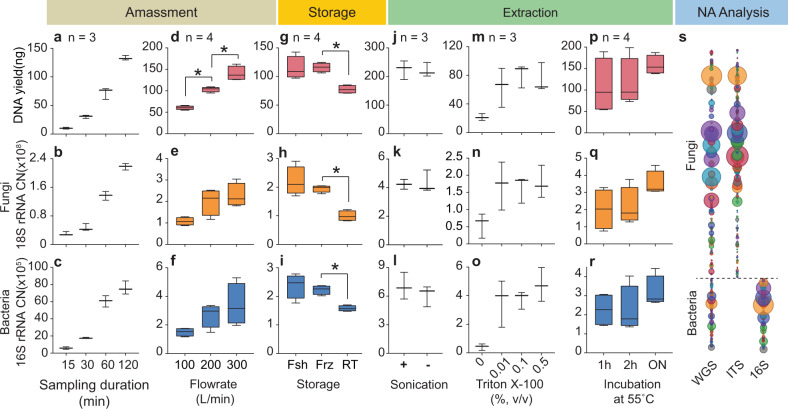
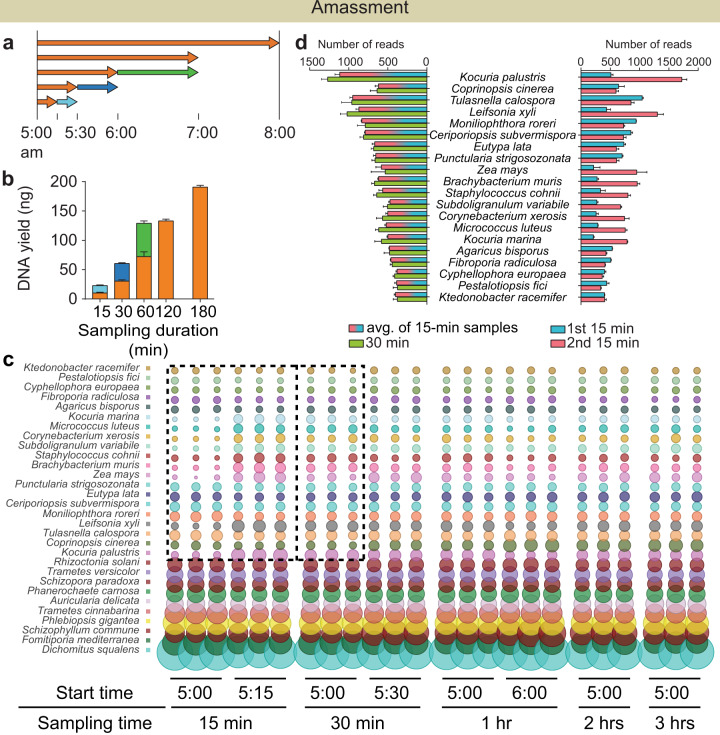
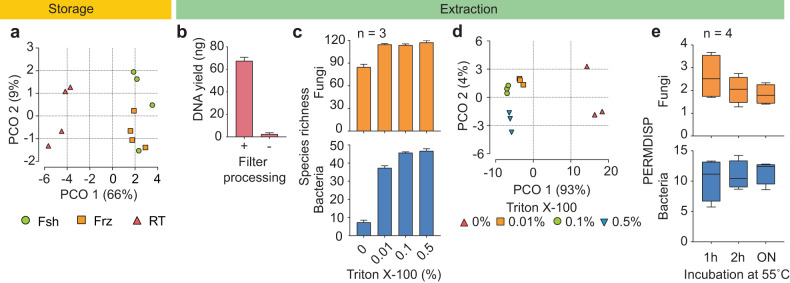
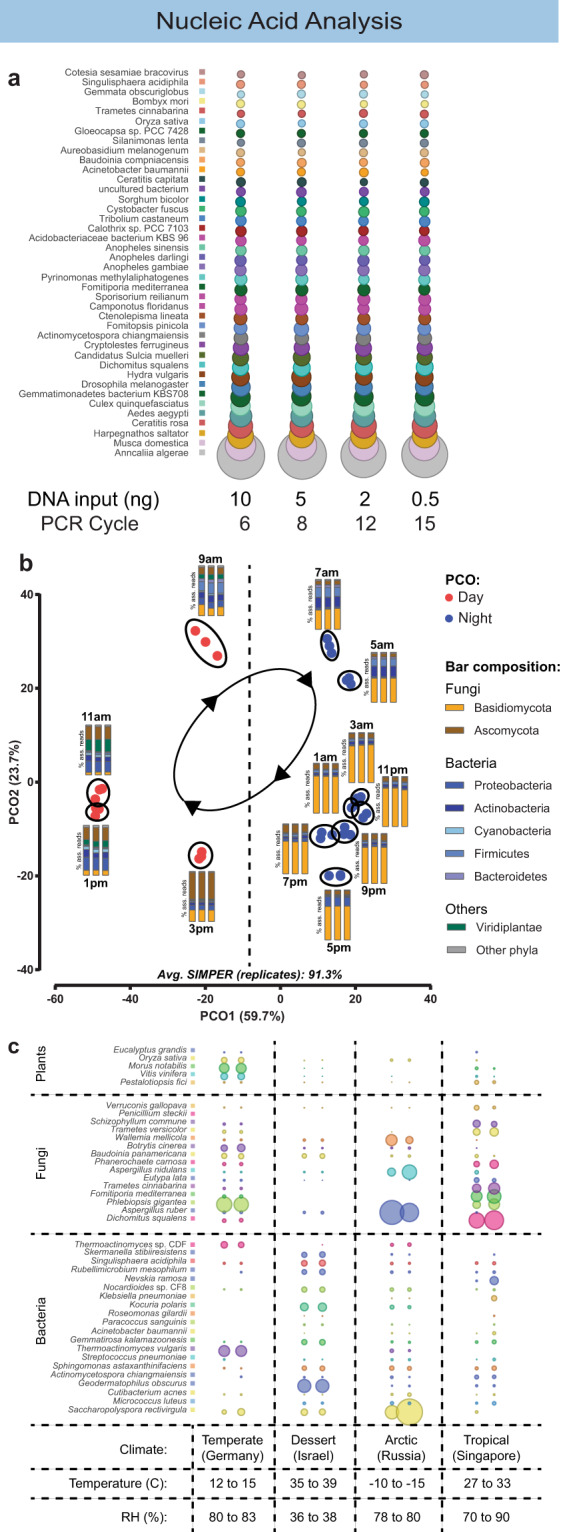
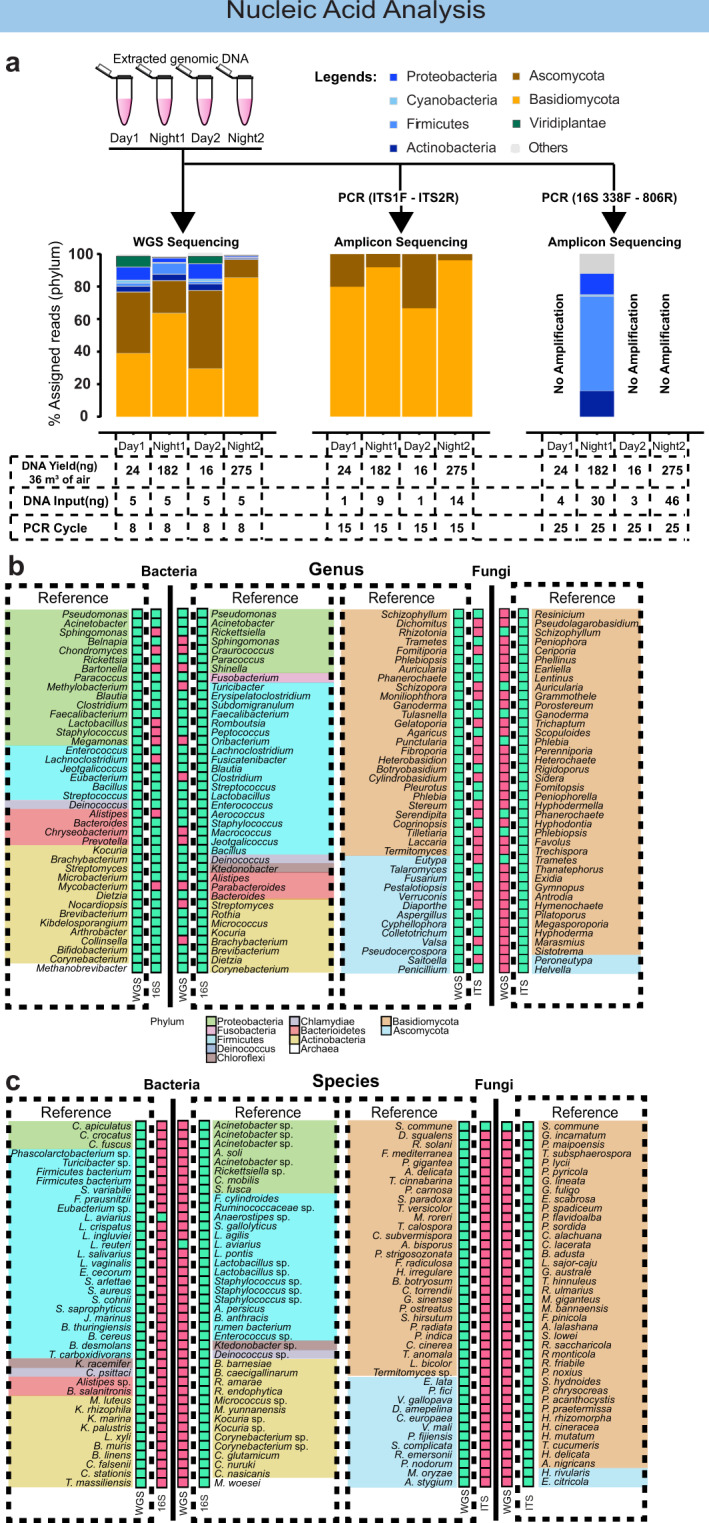
Investigation of the microbial ecology of terrestrial, aquatic and atmospheric ecosystems requires specific sampling and analytical technologies, owing to vastly different biomass densities typically encountered. In particular, the ultra-low biomass nature of air presents an inherent analytical challenge that is confounded by temporal fluctuations in community structure. Our ultra-low biomass pipeline advances the field of bioaerosol research by significantly reducing sampling times from days/weeks/months to minutes/hours, while maintaining the ability to perform species-level identification through direct metagenomic sequencing. The study further addresses all experimental factors contributing to analysis outcome, such as amassment, storage and extraction, as well as factors that impact on nucleic acid analysis. Quantity and quality of nucleic acid extracts from each optimisation step are evaluated using fluorometry, qPCR and sequencing. Both metagenomics and marker gene amplification-based (16S and ITS) sequencing are assessed with regard to their taxonomic resolution and inter-comparability. The pipeline is robust across a wide range of climatic settings, ranging from arctic to desert to tropical environments. Ultimately, the pipeline can be adapted to environmental settings, such as dust and surfaces, which also require ultra-low biomass analytics.


Conflict of interest statement

The authors declare no competing interests.

Figures

Fig. 1
Fig. 1. Challenges in air microbiome analysis.
a Total DNA yield (ng/mass equivalent) for soil, ocean water and air sample collected from the same proximity and processed with the same method. b estimated sample volume required to yield 5 ng of DNA. For box plots, the centre line, bound of box and whiskers represent median, 25th–75th percentile and min-to-max values, respectively. c Fluctuation of airborne biomass (ng) at different times of the day. The red dots and error bars are mean and standard deviation among the replicates. d Developed sampling and analysis pipeline for metagenomic analysis of ultra-low biomass environmental samples.
Fig. 2
Fig. 2. Summary of quantitative analysis with DNA yield, 18S copy number (CN) and 16S copy number (CN).
ac Assessment of air sampling duration from 15 min to 3 h. df Assessment of air sampling flow rate from 100 L/min to 300 L/min. gi The integrity of sampled biomass when processed fresh (Fsh), stored in freezer for 5 d (Frz) or stored at room temperature for 5 d (RT). jl Impact of sonication on DNA yield. (mo) Impact of detergent addition at different concentrations (0.01–0.5% v/v) during filter sample wash. pr Impact of extended pre-incubation (1 h to overnight) at 55 °C during DNA extraction. The centre line, bound of box and whiskers represent median, 25th–75th percentile and min-to-max values, respectively. s Whole-genome shotgun (WGS) and amplicon (ITS/16S) sequencing approaches. * denotes statistical significance (p < 0.05) tested with Mann–Whitney tests.
Fig. 3
Fig. 3. Sampling duration assessment.
a Illustration of different time-based sampling regimes. b Comparison of DNA yield (ng) between the corresponding sampling regimes, e.g. first 15-min yield (orange) + second 15-min yield (light blue) compared to first 30-min yield (orange). The bars represent mean values and the error bars were standard deviation among the replicates. c Taxonomic compositions of the top 30 species, the highlighted portion focuses on species which shifted in abundance between the first and second 15-min samples. d Comparison of relative abundances of the selected species, the first and second 15-min samples were averaged and compared to the taxonomic composition of first 30-min sample. The bars represent mean values and the error bars were standard deviation among the replicates.
Fig. 4
Fig. 4. Storage and biomass extraction.
a Principal coordinate analysis (Bray-Curtis) on genus level for samples processed fresh (Fsh), stored in freezer (Frz) and room temperature (RT). b Comparison of DNA yield (ng) with (+) and without (−) the filter wash step. c Total identified species for fungi (orange) and bacteria (blue) for samples processed with different concentration of detergent (0–0.5% v/v) during the wash step. The bars represent mean values and the error bars were standard deviation among the replicates. d Principal coordinate analysis (Bray-Curtis) on genus level for samples processed with different concentration of detergent (0–0.5% v/v) during the wash step. e PERMDISP analysis for samples processed with extended incubation at 55 °C prior to cell lysis. The centre line, bound of box and whiskers represent median, 25th–75th percentile and min-to-max values, respectively.
Fig. 5
Fig. 5. Whole genome shotgun (WGS) sequencing of air samples.
a Comparison of taxonomic profile at species level for the same air sample that was subjected to WGS sequencing with different DNA input amounts (10–0.5 ng). b Reproducibility of samples collected at the same time and location (triplicates) illustrated in principal coordinate analysis (Bray–Curtis) at species level. The bars show the microbial community composition of the triplicates in % of assigned reads. c Robustness of air sampling and processing pipeline tested at locations with temperate, dessert, sub-arctic and tropical climates.
Fig. 6
Fig. 6. Comparison of taxonomic profiles between WGS and amplicon sequencing pipelines.
a Taxonomic profile of WGS, ITS amplicon and 16S amplicon pipeline at phylum level of four independently collected air samples (two days and two nights). b Presence–absence comparison of the top 40 most abundant genus for bacteria (WGS vs 16S) and fungi (WGS vs ITS). c Presence–absence comparison of the top 40 most abundant species for bacteria (WGS vs 16S) and fungi (WGS vs ITS).

References

    1. Darwin, C. The Voyage of the Beagle (Cosimo Inc., 2008).
    1. Von Humboldt, A. & Aimé B. Personal Narrative of Travels to the Equinoctial Regions of America: During the Years 1799-1804 (Cosimo Inc., 2013).
    1. Gilbert JA, Jansson JK, Knight R. The Earth Microbiome project: successes and aspirations. BMC Biol. 2014;12:1–4. doi: 10.1186/s12915-014-0069-1. - DOI - PMC - PubMed
    1. Silvia, C. M. & Stal. J. L. The Marine Microbiome (Springer International, 2016).
    1. Burrows SM, Elbert W, Lawrence MG. Bacteria in the global atmosphere. Atmos. Chem. Phys. 2009;9:9263–9280. doi: 10.5194/acp-9-9263-2009. - DOI

Publication types

LinkOut - more resources