. 2021 Apr 16;12(1):2302.
doi: 10.1038/s41467-021-22577-3.

Detecting protein and DNA/RNA structures in cryo-EM maps of intermediate resolution using deep learning

Affiliations

Detecting protein and DNA/RNA structures in cryo-EM maps of intermediate resolution using deep learning

Xiao Wang et al. Nat Commun. .

Abstract

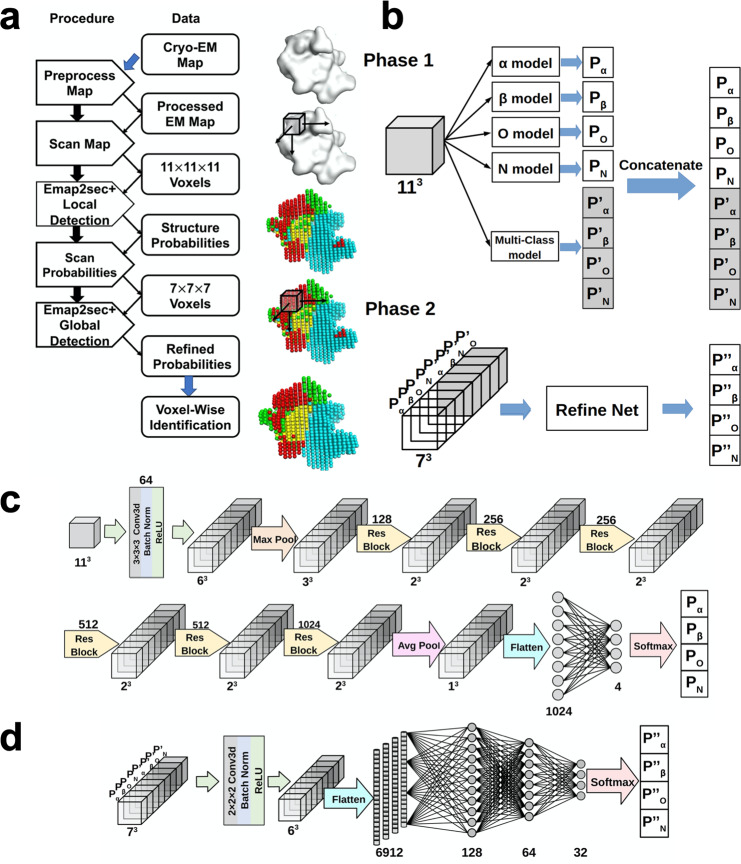
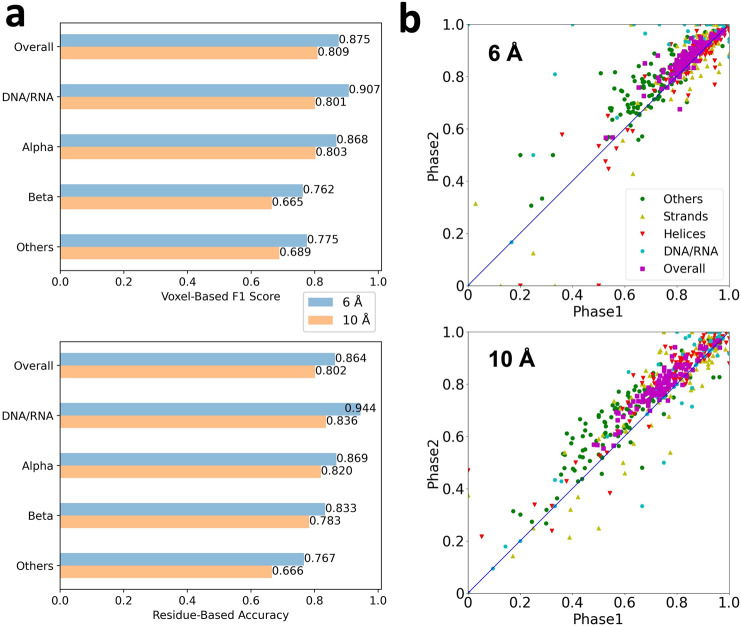
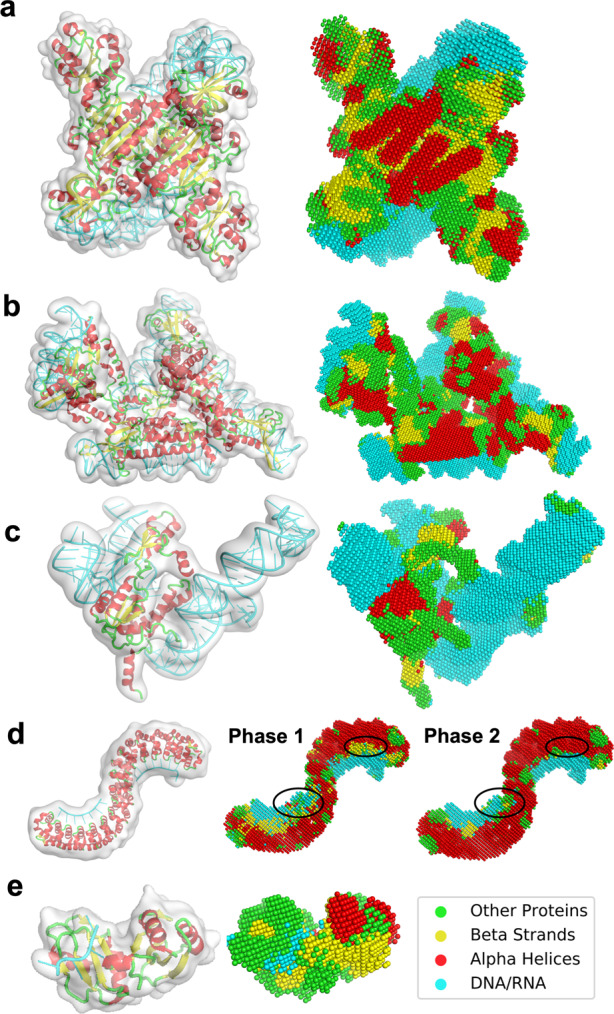
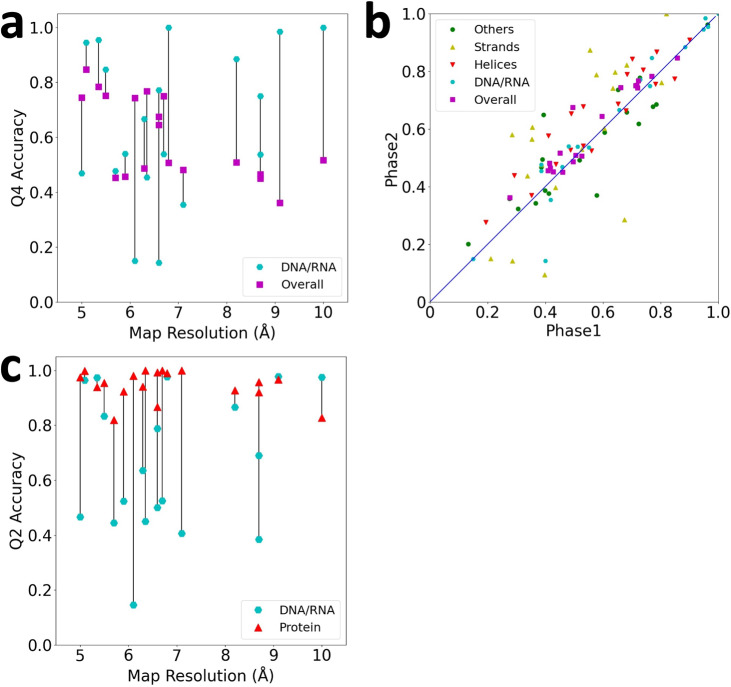
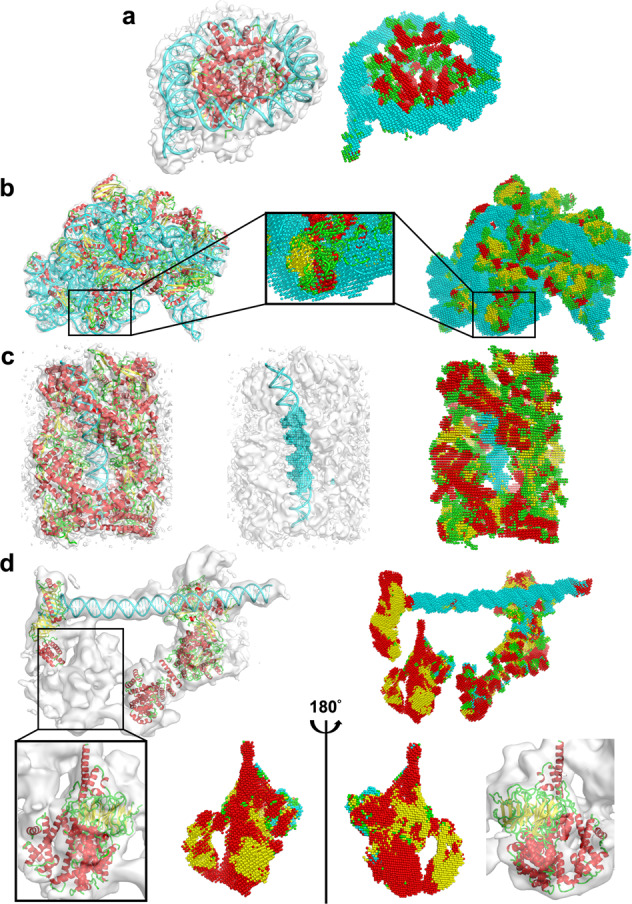
An increasing number of density maps of macromolecular structures, including proteins and DNA/RNA complexes, have been determined by cryo-electron microscopy (cryo-EM). Although lately maps at a near-atomic resolution are routinely reported, there are still substantial fractions of maps determined at intermediate or low resolutions, where extracting structure information is not trivial. Here, we report a new computational method, Emap2sec+, which identifies DNA or RNA as well as the secondary structures of proteins in cryo-EM maps of 5 to 10 Å resolution. Emap2sec+ employs the deep Residual convolutional neural network. Emap2sec+ assigns structural labels with associated probabilities at each voxel in a cryo-EM map, which will help structure modeling in an EM map. Emap2sec+ showed stable and high assignment accuracy for nucleotides in low resolution maps and improved performance for protein secondary structure assignments than its earlier version when tested on simulated and experimental maps.


Conflict of interest statement

The authors declare no competing interests.

Figures

Fig. 1
Fig. 1. The network Architecture of Emap2sec+.
Emap2sec+ scans an EM map with a voxel of 11*11*11 Å3 of size with a stride of 2 and outputs the probabilities that the voxel has α helix, β strand, other structures, or DNA/RNA in the middle of the voxel. It consists of two networks, phase 1 and phase 2, where the phase 2 network refines the initial output by considering assignments given to neighboring 7 × 7 × 7 voxels by the phase 1 network. a logical steps of the pipeline. b the architecture of phase 1 and phase 2 networks. Phase 1 consists of 4 binary classifiers and one multi (four) -class classifier. The phase 2 network takes outputs from the phase 1 network and outputs refined, final probability values. c a detailed network architecture of phase 1. It uses 6 Residual blocks (Supplementary Fig. 1). d a detailed architecture of phase 2. The main part is a fully connected network.
Fig. 2
Fig. 2. The structure detection performance on the simulated map dataset.
The dataset consists of 108 structures computed at two different resolutions, 6 Å and 10 Å. a Voxel-based F1 score and Q4 residue/nucleotide-based accuracy for 6 Å (blue) and 10 Å (orange) maps. b Comparison of Q4 of phase 1 and phase 2 network outputs for each of 108 test simulated maps computed at 6 Å and 10 Å. Green, other structures; yellow triangles, β strands; red triangles, α helices; cyan, DNA/RNA; magenta, overall Q4.
Fig. 3
Fig. 3. Example of the structure detection for simulated maps.
For each panel, the macromolecular structure in the simulated EM map is shown on the left while the structure detection result of the phase 2 network is shown on the right. Colors of spheres in the structure detection panels indicate structure types: red α helices; yellow, β strands; green, other structures (loop); and cyan, RNA/DNA. Detailed evaluation metrics are included in Supplementary Data 1. a Aspartyl-tRNA synthase complexed with tRNA(Asp) (PDB ID: 1IL2. Simulated map resolution: 6 Å. The complex contains 1170 amino acids (AA) and 129 nucleotides (nt). Voxel-based F1 score (F1): 0.879; Voxel-based accuracy (Acc): 0.880; Q4: 0.842. b Large serine recombinase (LSR) – DNA complex (PDB ID: 4KIS. Simulated at 7.56 Å. 1216 AA and 208 nt. F1: 0.864; Acc: 0.863; Q4: 0.867. c Ribosomal protein L30, L37a, S13 complexed with 3 ribosomal RNAs (PDB ID: 1YSH. Simulated Resolution: 10 Å. 261 AA and 163 nt. F1: 0.818; Acc: 0.800; Q4: 0.770. d Pumilio homology domain complexed with RNA (PDB ID: 1M8X. Simulated resolution: 10 Å. 682 AA and 15 nt. Phase 1 results: F1: 0.806; Acc: 0.780; Q4: 0.793. Phase 2 results: F1: 0.858; Acc: 0.861; Q4: 0.941. e IMP3 RRM12 in complex with RNA (PDB ID: 6GX6. Simulated resolution: 6 Å; 170 AA and 4 nt. F1: 0.712; Acc: 0.715; Q4: 0.753. Accuracies for RNA were: F1(RNA): 0.416; Acc(RNA): 0.270; Q4(RNA): 0.50.
Fig. 4
Fig. 4. Structure class detection on 19 experimental maps.
See Supplementary Data 2 for the phase 1 and phase 2 accuracy of individual maps. a Q4 accuracy of experimental maps relative to the map resolution. Overall Q4 is shown in magenta squares and Q4 of DNA/RNA is shown in cyan circles. Lines connect values of the same map. b The residue-based accuracy comparison between the Phase 1 and Phase 2 networks. c Q2 binary classification accuracy for distinguishing the protein and DNA/RNA classes in experimental maps. Note that values for DNA/RNA can be different from panel a, which reports the results of four-class classification. Since the probability of the protein class was computed as the sum of probabilities of three secondary structure classes, a DNA/RNA assignment in the four-class classification can be changed to protein in the binary classification. Results of individual maps are provided in Supplementary Data 2.
Fig. 5
Fig. 5. Examples of structure detection of experimental maps.
The density maps and associated structures are shown on the left and the detection results of Emap2sec+ are shown on the right. Spheres in red represent detected α helices; yellow, β strands; green, other structures; and cyan, RNA/DNA. Detailed evaluation metrics are shown in Supplementary Data 2. a nucleosome breathing Class 3. EMD-3949; 6ESH 10.2210/pdb6ESH/pdb. Resolution: 5.10 Å. 738 amino acids (aa) and 274 nucleotides (nt). Voxel-based F1 score: 0.887; Voxel-based accuracy (Acc): 0.870; Q4: 0.846. b bacterial 30S-IF1-IF3-mRNA translation pre-initiation complex. EMD-4075; 5LMP 10.2210/pdb5LMP/pdb. Res.: 5.35 Å. 2622 aa and 1534 nt. F1: 0.855; Acc: 0.846; Q4: 0.784. c dihedral oligomeric complex gyrA. EMD-9316; 6N1P 10.2210/pdb6N1P/pdb. Res.: 6.35 Å. 3828 aa and 88 nt. F1: 0.760; Acc: 0.749; Q4: 0.767. In the middle panel, only the DNA is shown with voxels as DNA. d. human TFIID-IIA bound to core promoter DNA. EMD-3305; 5FUR 10.2210/pdb5FUR/pdb. Resolution: 8.7 Å; 1857 aa and 39 nt. In a box, another PDB entry, 6MZC 10.2210/pdb6MZC/pdb, is shown, which is for the TFIID BC core and fills the missing structure in lobe B. 6MZC 10.2210/pdb6MZC/pdb was associated with another newer EM map, EMD-9298, determined at a 4.5 Å resolution. F1: 0.487 (0.371); Acc: 0.493 (0.402); Q4: 0.516 (0.438). In the parentheses, values were shown that were computed only for the part of the structure in 6MZC 10.2210/pdb6MZC/pdb that fill the density (953 aa). The structure of lob B and Emap2sec+’s detection is shown from two opposite angles. The detection results using the newer map, EMD-9298, is provided as Supplementary Fig. 4.

Similar articles

Cited by

References

    1. Glaeser RM. How good can single-particle cryo-EM become? what remains before it approaches its physical limits? Annu Rev. Biophys. 2019;48:45–61. doi: 10.1146/annurev-biophys-070317-032828. - DOI - PubMed
    1. Nogales E. The development of cryo-EM into a mainstream structural biology technique. Nat. Methods. 2016;13:24–27. doi: 10.1038/nmeth.3694. - DOI - PMC - PubMed
    1. Patwardhan A. Trends in the electron microscopy data bank (EMDB) Acta Crystallogr. Sect. D: Struct. Biol. 2017;73:503–508. doi: 10.1107/S2059798317004181. - DOI - PMC - PubMed
    1. Elmlund D, Le SN, Elmlund H. High-resolution cryo-EM: the nuts and bolts. Curr. Opin. Struct. Biol. 2017;46:1–6. doi: 10.1016/j.sbi.2017.03.003. - DOI - PubMed
    1. Alnabati E, Kihara D. Advances in structure modeling methods for cryo-electron microscopy maps. Molecules. 2020;25:82. doi: 10.3390/molecules25010082. - DOI - PMC - PubMed

Publication types