

Data valuation for medical imaging using Shapley value and application to a large-scale chest X-ray dataset
- PMID: 33863957
- PMCID: PMC8052417
- DOI: 10.1038/s41598-021-87762-2
Data valuation for medical imaging using Shapley value and application to a large-scale chest X-ray dataset
Abstract
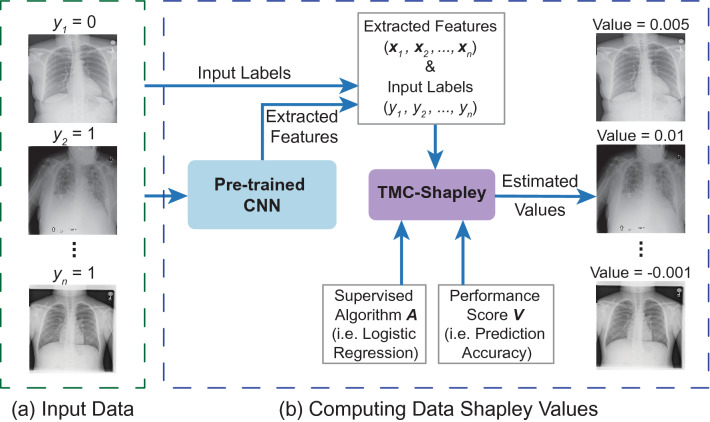
The reliability of machine learning models can be compromised when trained on low quality data. Many large-scale medical imaging datasets contain low quality labels extracted from sources such as medical reports. Moreover, images within a dataset may have heterogeneous quality due to artifacts and biases arising from equipment or measurement errors. Therefore, algorithms that can automatically identify low quality data are highly desired. In this study, we used data Shapley, a data valuation metric, to quantify the value of training data to the performance of a pneumonia detection algorithm in a large chest X-ray dataset. We characterized the effectiveness of data Shapley in identifying low quality versus valuable data for pneumonia detection. We found that removing training data with high Shapley values decreased the pneumonia detection performance, whereas removing data with low Shapley values improved the model performance. Furthermore, there were more mislabeled examples in low Shapley value data and more true pneumonia cases in high Shapley value data. Our results suggest that low Shapley value indicates mislabeled or poor quality images, whereas high Shapley value indicates data that are valuable for pneumonia detection. Our method can serve as a framework for using data Shapley to denoise large-scale medical imaging datasets.
Conflict of interest statement
The authors declare no competing interests.
Figures


Similar articles
-
Validation of expert system enhanced deep learning algorithm for automated screening for COVID-Pneumonia on chest X-rays.Sci Rep. 2021 Dec 1;11(1):23210. doi: 10.1038/s41598-021-02003-w. Sci Rep. 2021. PMID: 34853342 Free PMC article.
-
COVID19XrayNet: A Two-Step Transfer Learning Model for the COVID-19 Detecting Problem Based on a Limited Number of Chest X-Ray Images.Interdiscip Sci. 2020 Dec;12(4):555-565. doi: 10.1007/s12539-020-00393-5. Epub 2020 Sep 21. Interdiscip Sci. 2020. PMID: 32959234 Free PMC article.
-
Detection of COVID-19 from Chest X-Ray Images Using Convolutional Neural Networks.SLAS Technol. 2020 Dec;25(6):553-565. doi: 10.1177/2472630320958376. Epub 2020 Sep 18. SLAS Technol. 2020. PMID: 32948098 Free PMC article.
-
RIL-Contour: a Medical Imaging Dataset Annotation Tool for and with Deep Learning.J Digit Imaging. 2019 Aug;32(4):571-581. doi: 10.1007/s10278-019-00232-0. J Digit Imaging. 2019. PMID: 31089974 Free PMC article. Review.
-
Artificial intelligence applications for thoracic imaging.Eur J Radiol. 2020 Feb;123:108774. doi: 10.1016/j.ejrad.2019.108774. Epub 2019 Dec 11. Eur J Radiol. 2020. PMID: 31841881 Review.
Cited by
-
Towards More Efficient Data Valuation in Healthcare Federated Learning using Ensembling.Distrib Collab Fed Learn Afford AI Healthc Resour Div Glob Health (2022). 2022 Sep;13573:119-129. doi: 10.1007/978-3-031-18523-6_12. Epub 2022 Oct 7. Distrib Collab Fed Learn Afford AI Healthc Resour Div Glob Health (2022). 2022. PMID: 36745141 Free PMC article.
-
Development and validation of interpretable machine learning models for inpatient fall events and electronic medical record integration.Clin Exp Emerg Med. 2022 Dec;9(4):345-353. doi: 10.15441/ceem.22.354. Epub 2022 Sep 21. Clin Exp Emerg Med. 2022. PMID: 36128798 Free PMC article.
-
Generalization-a key challenge for responsible AI in patient-facing clinical applications.NPJ Digit Med. 2024 May 21;7(1):126. doi: 10.1038/s41746-024-01127-3. NPJ Digit Med. 2024. PMID: 38773304 Free PMC article.
-
Evaluation of perceived urgency from single-trial EEG data elicited by upper-body vibration feedback using deep learning.Sci Rep. 2024 Aug 23;14(1):19604. doi: 10.1038/s41598-024-70508-1. Sci Rep. 2024. PMID: 39179642 Free PMC article.
-
Data Valuation with Gradient Similarity.ArXiv [Preprint]. 2024 May 13:arXiv:2405.08217v1. ArXiv. 2024. PMID: 38800649 Free PMC article. Preprint.
References
-
- Ronneberger, O., Fischer, P. & Brox, T. U-Net: Convolutional networks for biomedical image segmentation. in Medical Image Computing and Computer-Assisted Intervention -- MICCAI 2015 234–241 (Springer International Publishing, 2015).
Publication types
MeSH terms
Grants and funding
LinkOut - more resources
Full Text Sources
Other Literature Sources
Medical
