. 2021 Nov;26(11):6845-6867.
doi: 10.1038/s41380-021-01096-z. Epub 2021 Apr 16.

FXR1 regulation of parvalbumin interneurons in the prefrontal cortex is critical for schizophrenia-like behaviors

Affiliations

FXR1 regulation of parvalbumin interneurons in the prefrontal cortex is critical for schizophrenia-like behaviors

Minjie Shen et al. Mol Psychiatry. 2021 Nov.

Abstract

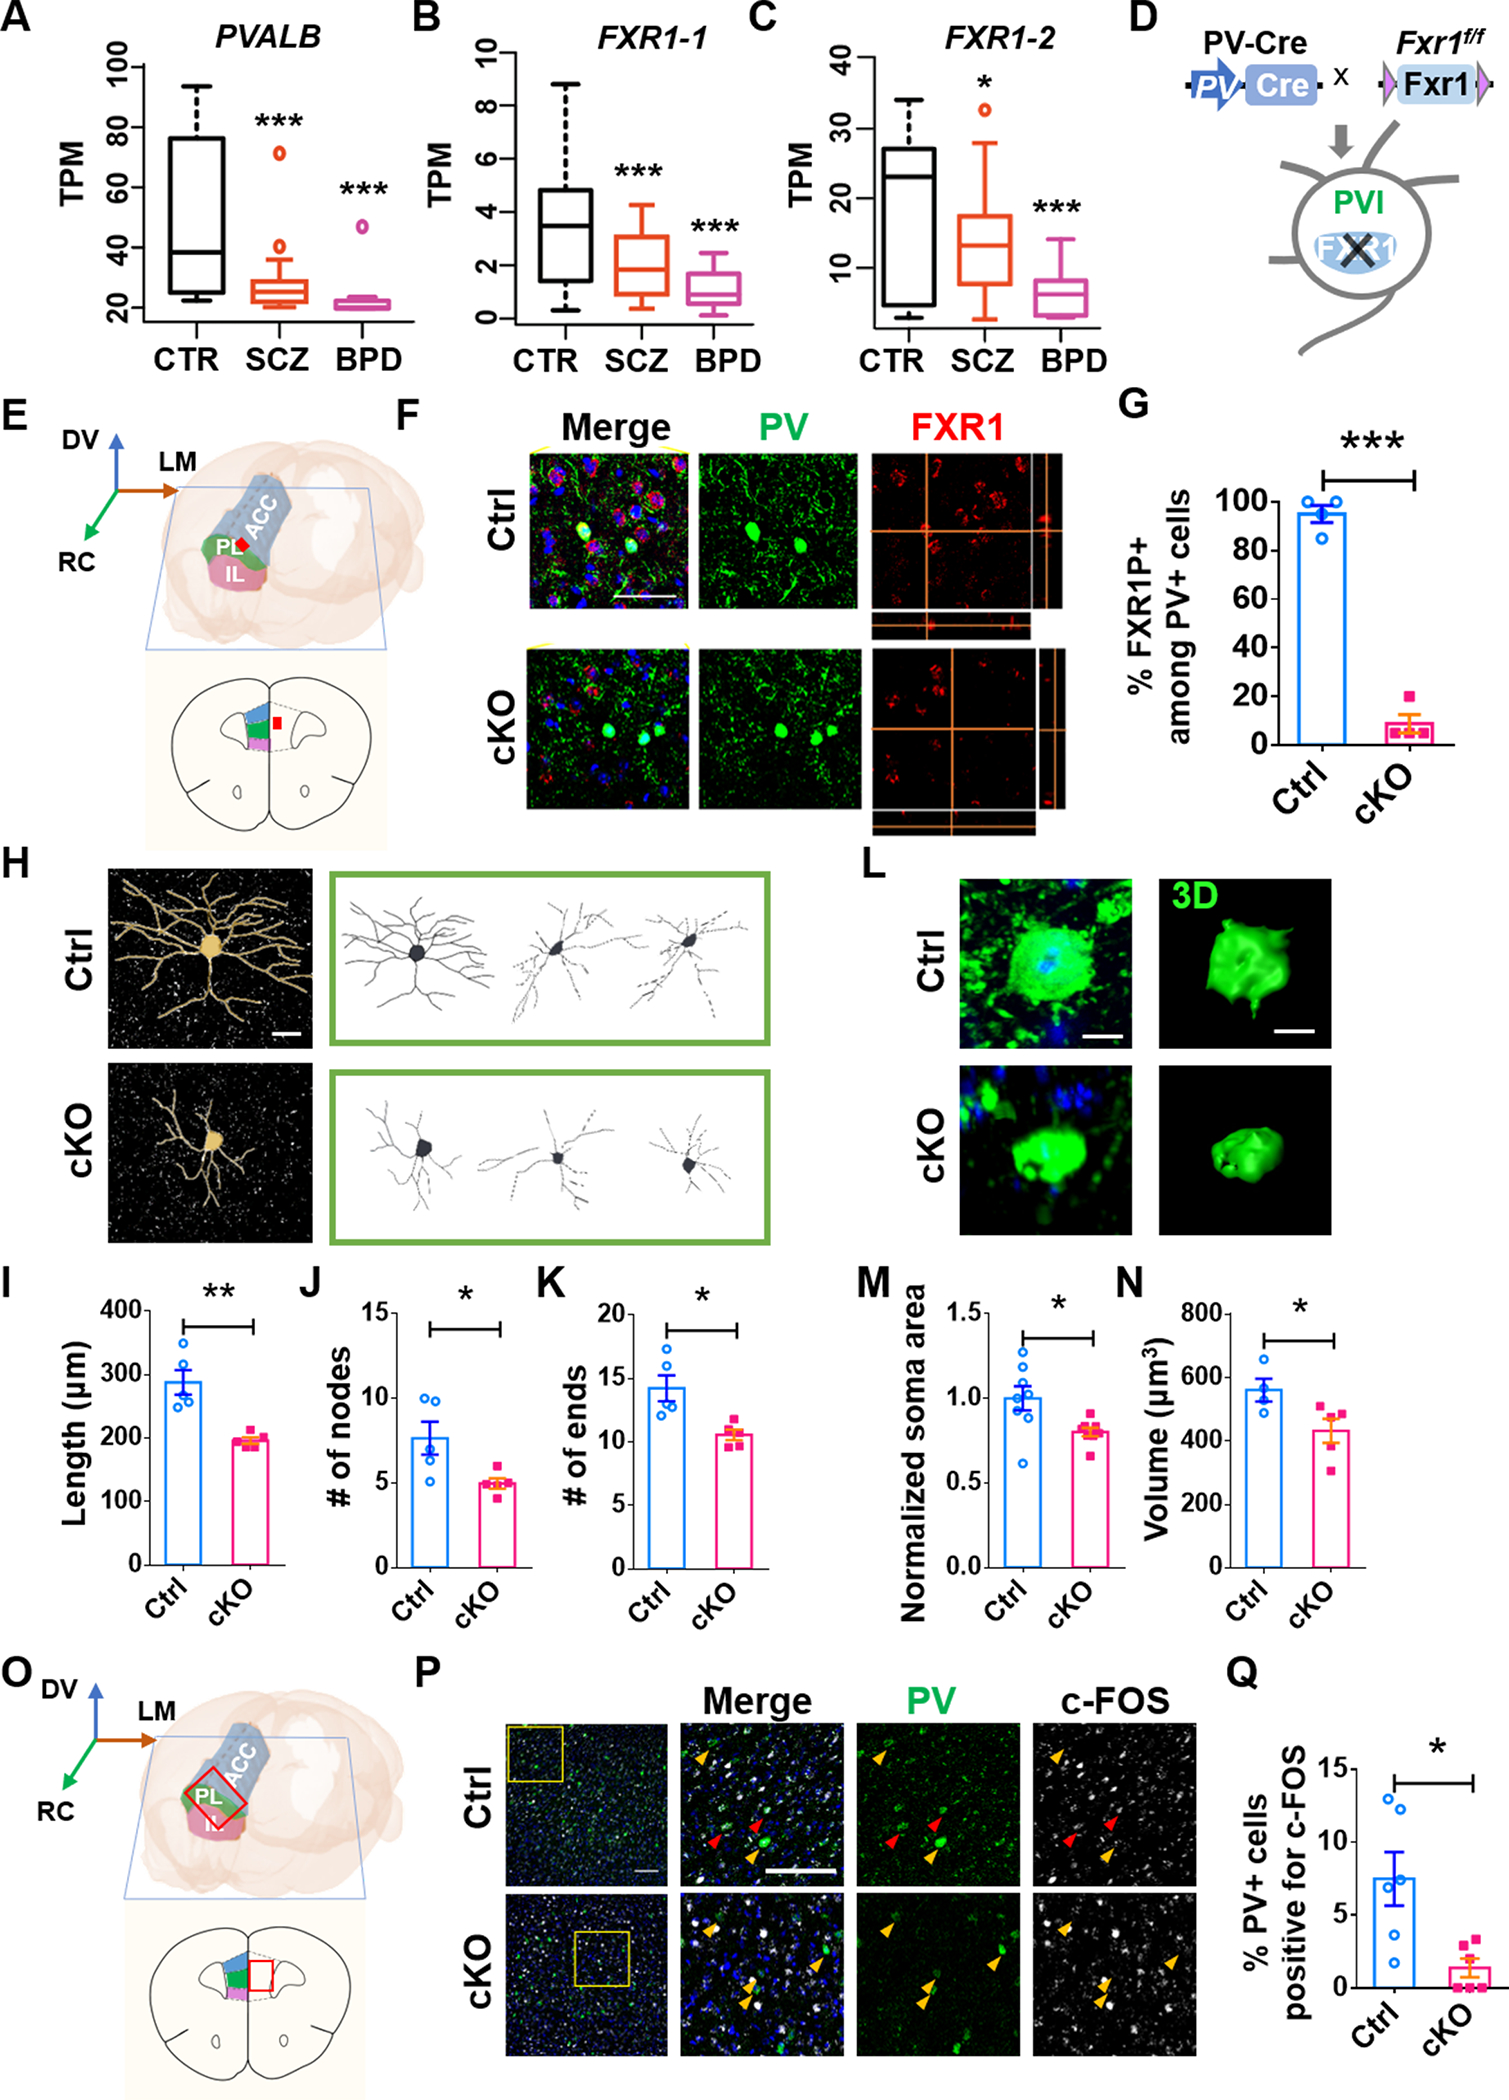
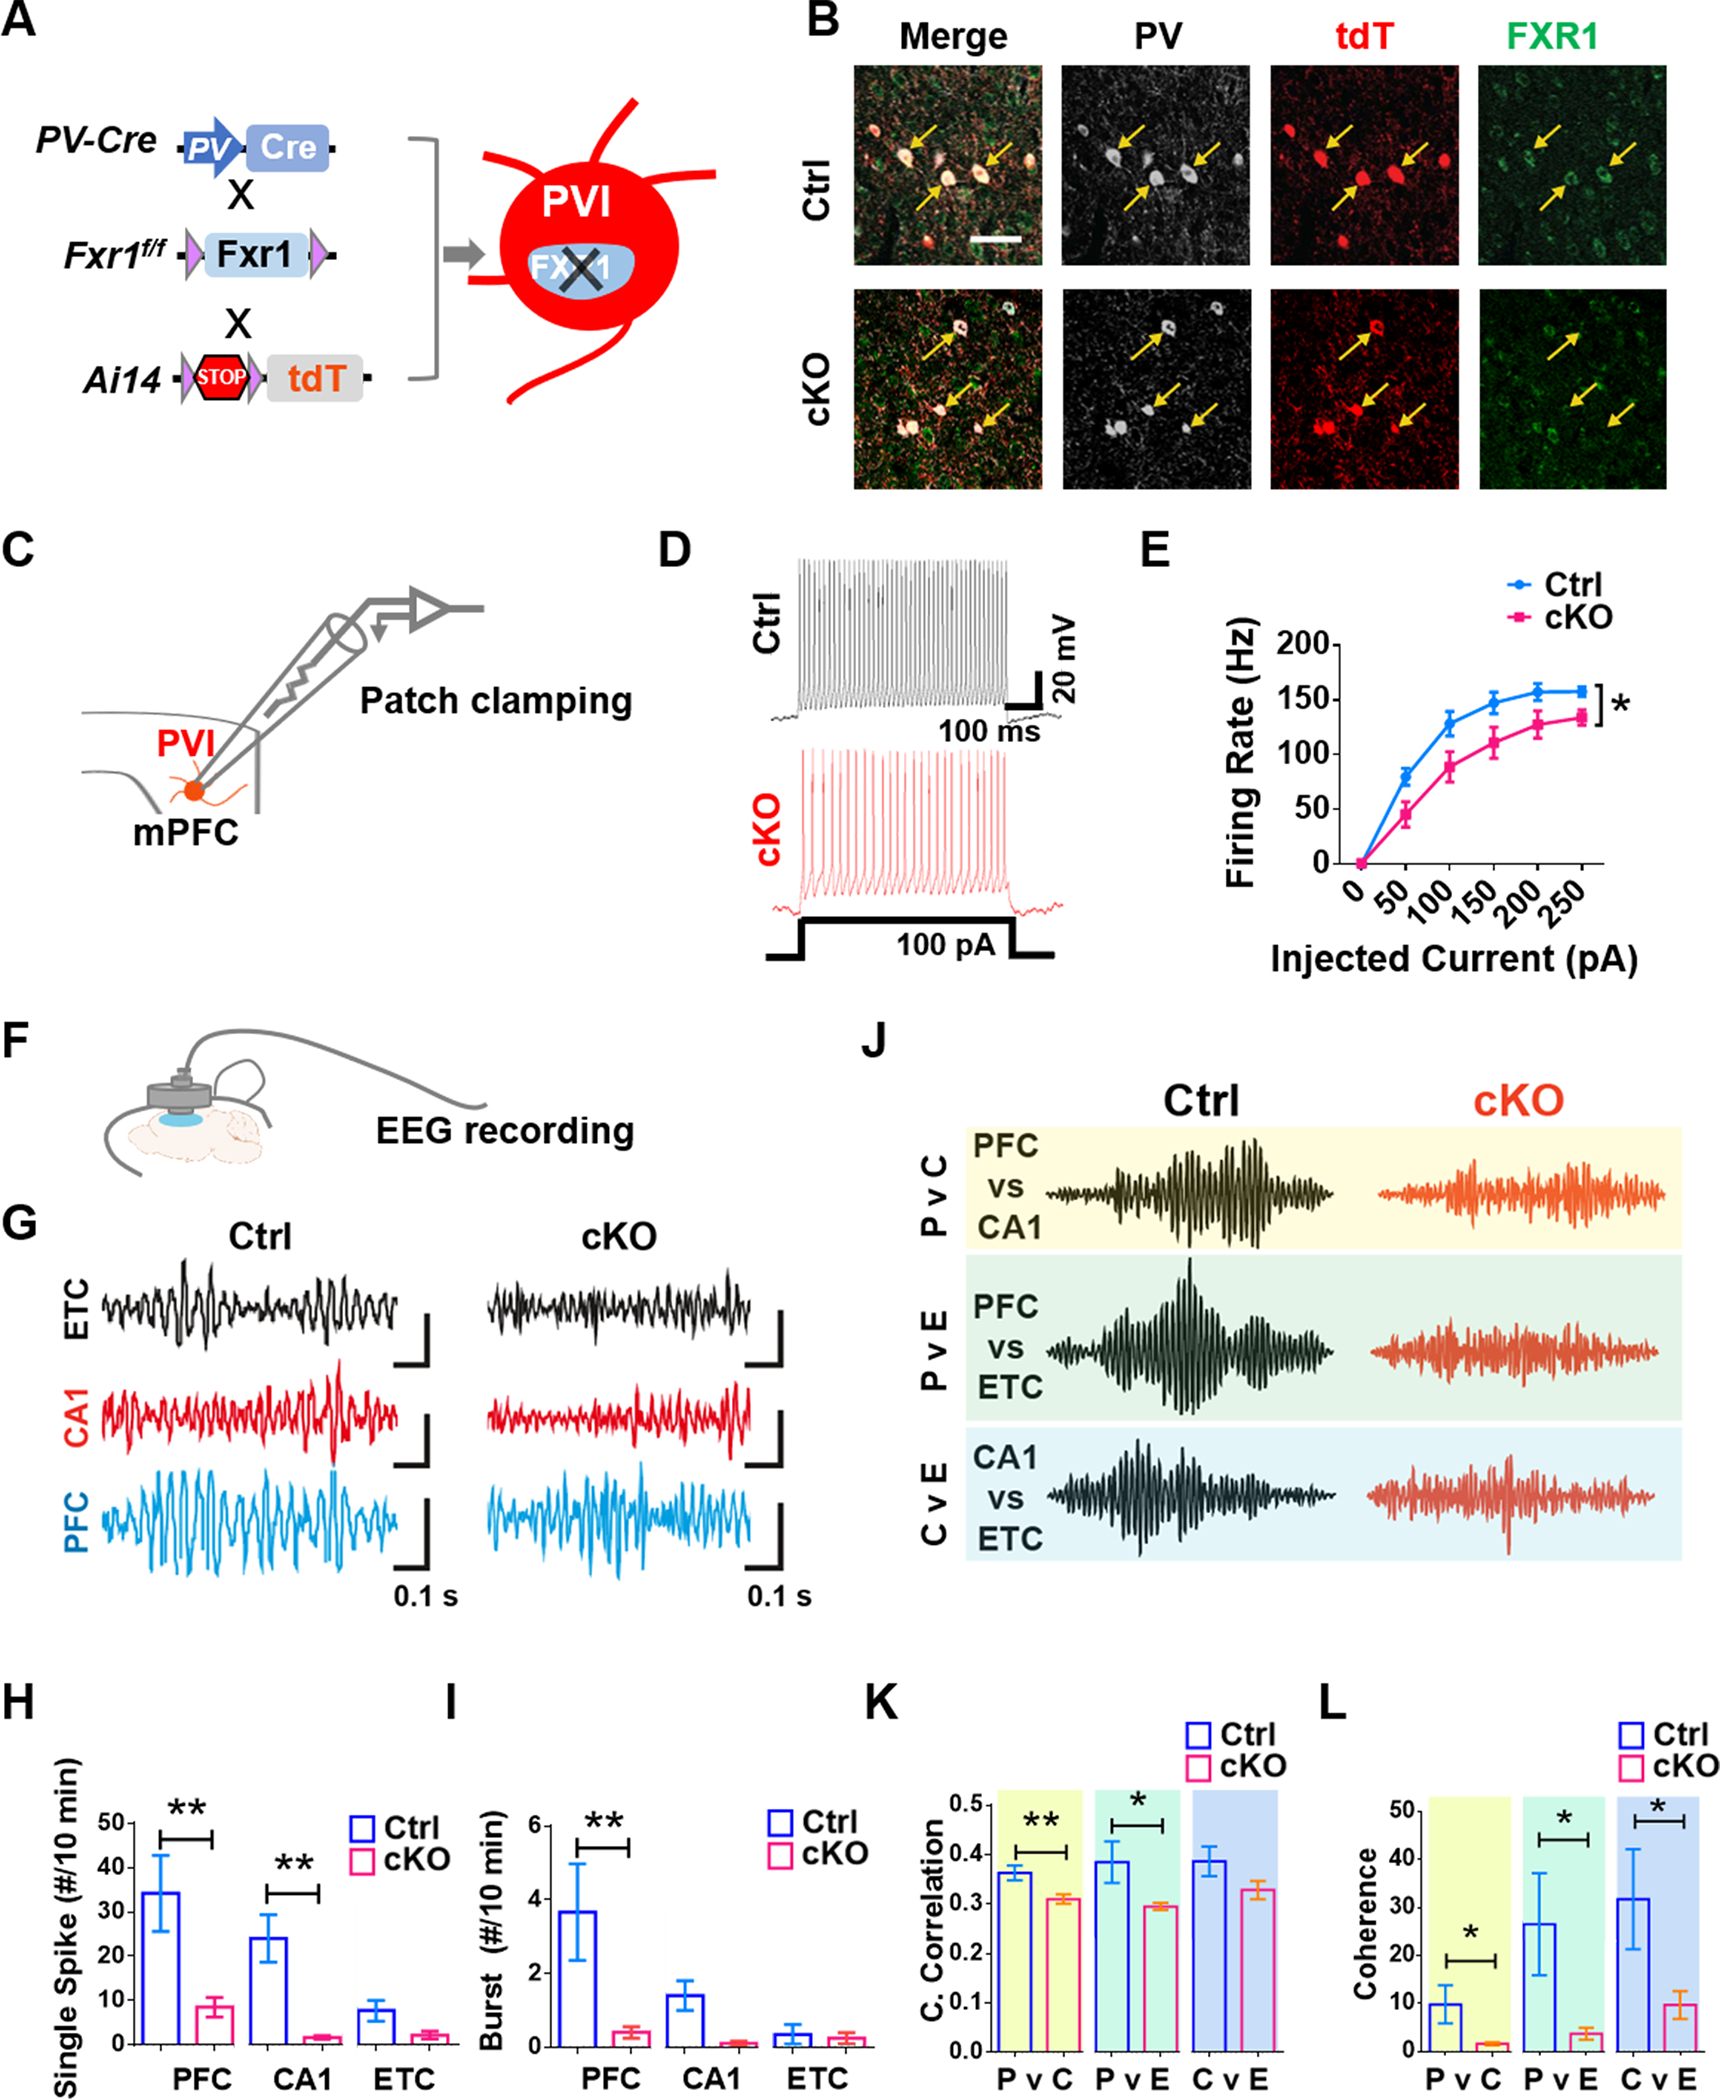
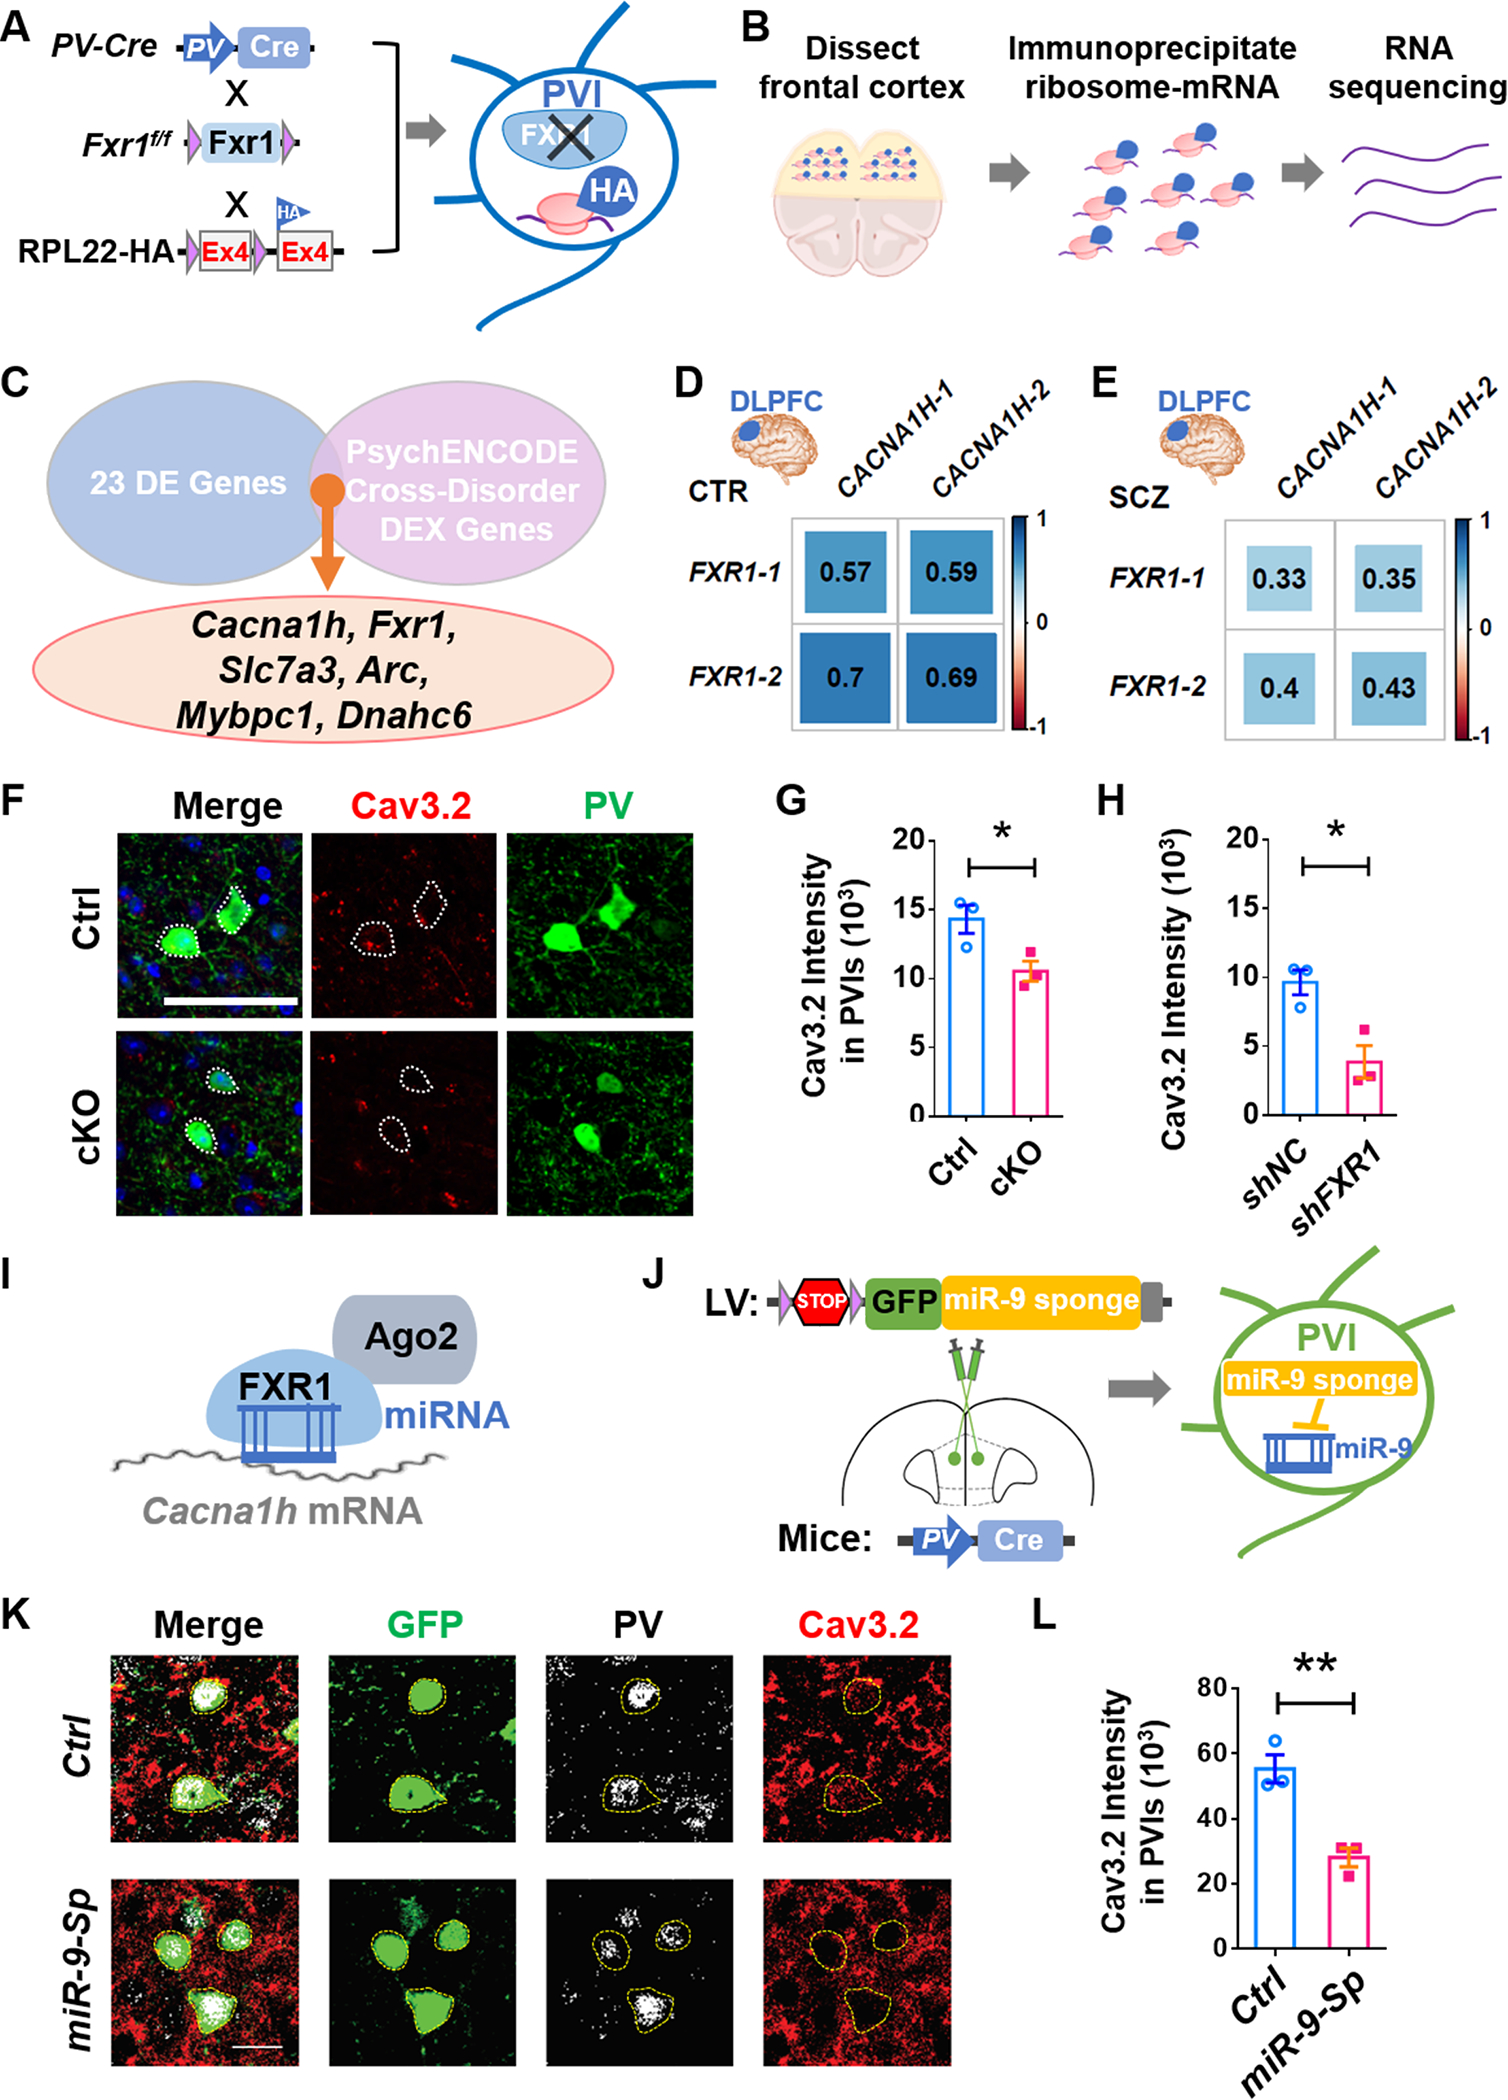
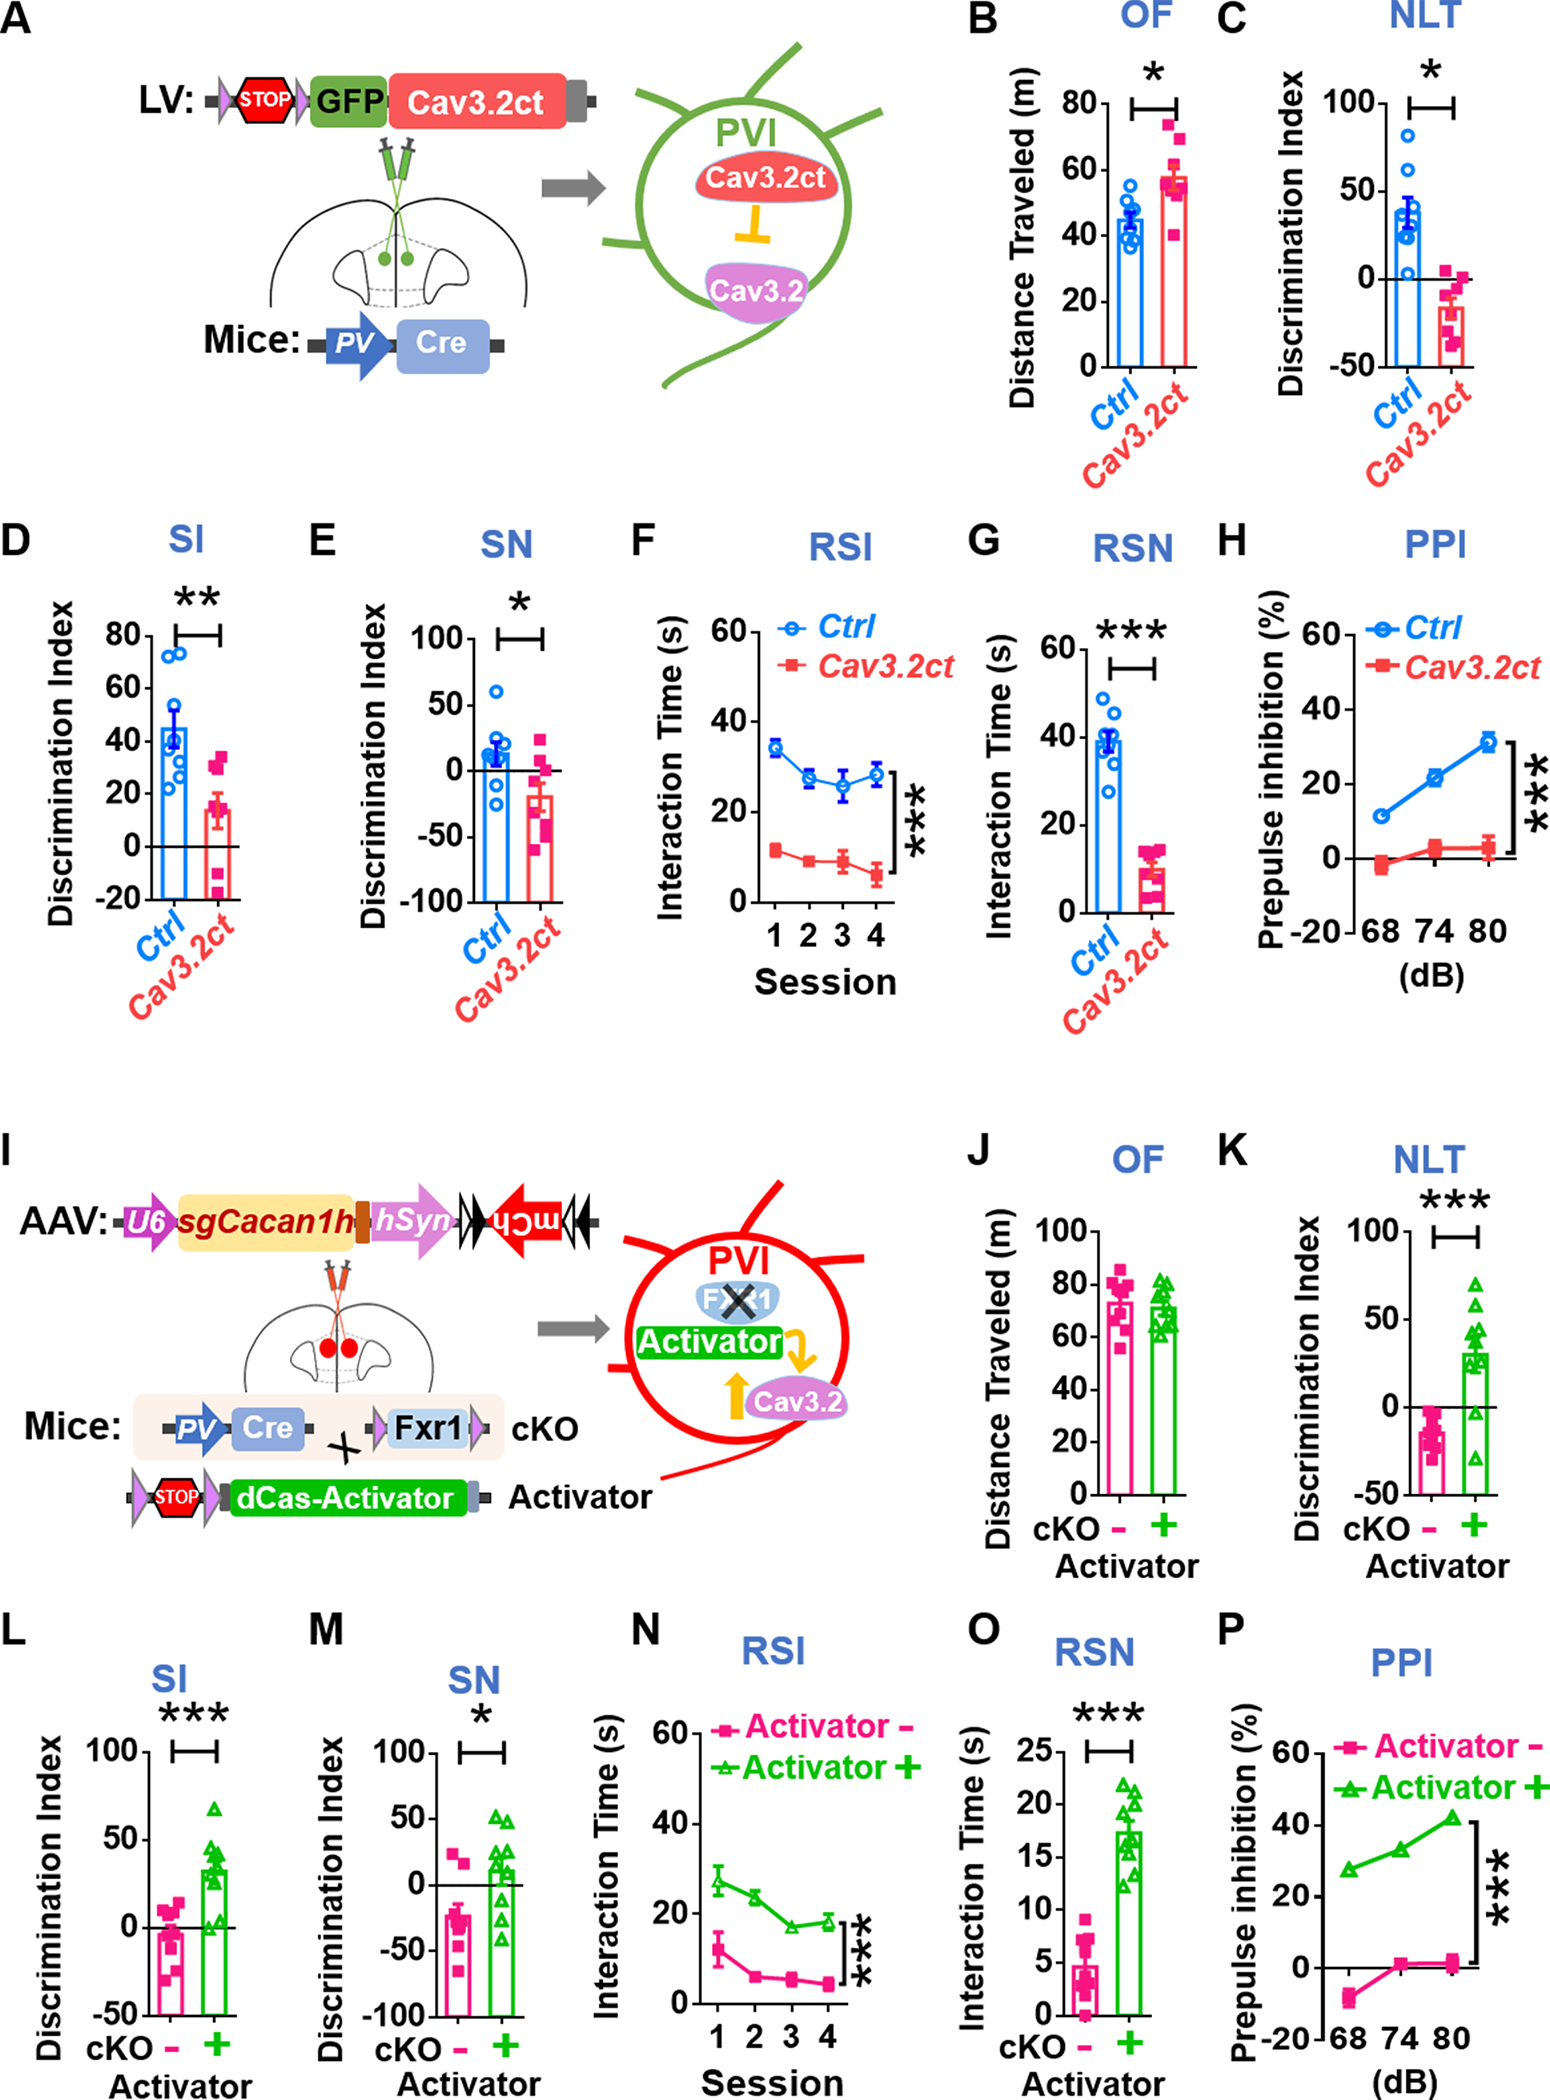
Parvalbumin interneurons (PVIs) are affected in many psychiatric disorders including schizophrenia (SCZ), however the mechanism remains unclear. FXR1, a high confident risk gene for SCZ, is indispensable but its role in the brain is largely unknown. We show that deleting FXR1 from PVIs of medial prefrontal cortex (mPFC) leads to reduced PVI excitability, impaired mPFC gamma oscillation, and SCZ-like behaviors. PVI-specific translational profiling reveals that FXR1 regulates the expression of Cacna1h/Cav3.2 a T-type calcium channel implicated in autism and epilepsy. Inhibition of Cav3.2 in PVIs of mPFC phenocopies whereas elevation of Cav3.2 in PVIs of mPFC rescues behavioral deficits resulted from FXR1 deficiency. Stimulation of PVIs using a gamma oscillation-enhancing light flicker rescues behavioral abnormalities caused by FXR1 deficiency in PVIs. This work unveils the function of a newly identified SCZ risk gene in SCZ-relevant neurons and identifies a therapeutic target and a potential noninvasive treatment for psychiatric disorders.


Conflict of interest statement

Conflict of interests:

The authors declare no competing interests.

Figures

Fig. 1
Fig. 1. FXR1 deletion in PVIs leads to morphological defects of PVIs in the mPFC.
A-C Quantitative comparison of PV (A), FXR1–1 (B), FXR1–2 (C) in the top PV samples (DLPFC) in PsychENCODE from three categories: normal CTR (n=28), SCZ (n=20) and BPD (n=7). D-F FXR1-cKO mice with conditional FXR1 deletion in PVIs. D Schematic diagram showing the generation of FXR1-cKO mice. E mPFC (marked by the red dot) for analysis. F Representative confocal images of PV (green), FXR1 (red) staining of brain sections from Ctrl and FXR1-cKO mice. Scale bars: 50 μm. G Percentage of FXR1+ in PV+ cells in mPFC of FXR1-cKO and Ctrl mice. n = 4 mice for each group. H Representative confocal images and Neurolucida software-created traces of PVIs in mPFC from Ctrl and FXR1-cKO mice. Scale bar, 20 μm. I-K Quantification of length (I), nodes (J) and ends (K) of PVIs in the mPFC. n = 5 mice for each group. L-N Representative confocal images and 3D reconstruction (Scale bars: 10 μm) and quantification of soma area and 3D volume of PVIs in the mPFC. O-Q FXR1-cKO PVIs in mPFC showed reduced activity. O mPFC (marked by the red frame) for analysis. P Representative confocal images of c-FOS positive PVIs (red arrows, scale bars: 100 μm). Q Quantification of numbers of c-FOS+ PVIs. n = 6 mice for each group. In a-c, data are presented as Min to Max; In other panels, data are presented as mean ± SEM; *p < 0.05, **p < 0.01, ***p < 0.001; One-way ANOVA with Bonferroni post hoc test (A-C), Student’s two-tailed, unpaired t test (G, I-K, M, N and Q).
Fig. 2
Fig. 2. FXR1 deletion in PVIs leads to impaired membrane excitability of PVIs and reduced gamma oscillation in the PFC.
A, B FXR1-cKO-Ai14 mice with tdT+ expression in PVIs. A Schematic diagram showing the generation of FXR1-cKO-Ai14 mice. B Representative confocal images of FXR1 (white), tdT (red) and PV (green) staining of brain sections from Ctrl-Ai14 and FXR1-cKO-Ai14 mice. Scale bars: 50 μm. C-H Whole recording. FXR1-cKO PVIs in mPFC showed impaired membrane excitability (D, E). C Schematic diagram of patch clamping recording. D Representative recording trace of AP trains. E Quantification of action potential spikes upon current injections. n = 3 mice. F-L iEEG. FXR1-cKO mice showed reduced gamma oscillation in the PFC (G-I) and impaired synchronization of PFC and other regions (J-L). F Schematic diagram showing iEEG recording of prefrontal regions. G Representative EEG recording from the right entorhinal cortex (ETC), right CA1 (CA1) and right PFC (PFC). EEG recordings were bandpass-filtered (25–100Hz) to isolate gamma-band activities. Scale bars showing different amplitude and same time (0.1 s): ETC, Ctrl = 0.1 mV, KO = 1 mV; CA1, Ctrl = 0.04 mV, cKO = 0.01 mV; PFC, Ctrl = 0.08 mV, cKO = 0.008 mV. H, I Quantification of total number of spikes per 10 minutes recording period (40 ms, 600 μV) in three different regions (H) and frequency of burst (defined as the number of bursts within 10 minutes (I). J Representative gamma-band oscillations for cross-correlation analysis between ETC, CA1 and PFC. K, L Quantification of cross-correlation (K) and coherence (L) between the three brain regions. n ≥ 6 mice. All data are presented as mean ± SEM; *p < 0.05, **p < 0.01; Two-way ANOVA with Bonferroni post hoc test (E), student’s two-tailed, unpaired t test (H, I, K and L).
Fig. 3
Fig. 3. Selective knockdown of FXR1 in PVIs within the mPFC leads to schizophrenia-like behavioral deficits.
A Specific knockdown of FXR1 in mPFC PVIs through injection of AAV expressing Fxr1 targeting guide RNA (AAV8-sgRNA-hSyn1-flex-mcherry) into the mPFC of PV-Cre;cCas9 mice. B-H Schizophrenia-like behavioral phenotypes. B No change in locomotion activity in OF test. C Impaired spatial learning ability in NLT test. D-G Sociability deficits in SI, SN, RSI and RSN. H Impaired sensory gating in PPI test. n = 14 mice. I-K Impaired activity of mPFC PVIs during reciprocal interactions. I Mice were sacrificed at 45 min after reciprocal interaction. J, K Representative confocal images (J) and quantification (K) of c-FOS+ mPFC PVIs. Scale bars: 100 μm. n = 3 mice. All data are presented as mean ± SEM; *p < 0.05, **p < 0.01, ***p < 0.001; Student’s two-tailed, unpaired t test (B-E, G and K), two-way ANOVA with Bonferroni post hoc test (F and H).
Fig. 4
Fig. 4. FXR1 deficiency leads to reduced Cav3.2 levels in PVIs.
A, B Generation of FXR1-cKO-Ribotag mice expressing HA-tagged ribosomal protein specifically in PVIs and schematic diagram showing Ribotag-seq. C 6 DE genes (Fxr1, Cacna1h, Slc7a3, Mybpc1, Arc, Dnahc6) were identified among PsychENCODE consortium’s Cross-Disorder Differentially expressed (DEX) Genes. D, E Pearson correlation coefficients of FXR1 isoforms and CACNA1H isoforms of the PsychENCODE DLPFC samples with top 5% PV levels in CTR (n=28) and SCZ (n=20). F, G Representative confocal images and quantifications of Cav3.2 intensity in PVIs in mPFC. n = 3 mice. H Quantifications of Cav3.2 intensity in human inhibitory neurons infected with lentivirus-shFXR1 or shNC. n = 3 differentiations. I Schematic illustration of model for FXR1-AGO2-miRNA promoting translation of Cav3.2. J Inhibition of miR-9 in mPFC PVIs through injection of lenti-LSL-miR-9-Sp in the mPFC of PV-Cre mice. K, L Representative confocal images and quantifications of Cav3.2 intensity in GFP+ PVIs in mPFC. n = 3 mice. All data are presented as mean ± SEM; *p < 0.05, **p < 0.01, ***p < 0.001; Student’s two-tailed, unpaired t test (G, H, and L).
Fig. 5
Fig. 5. Targeted manipulations of Cav3.2 PVIs of the mPFC directly impact behaviors.
A Specific inhibition of Cav3.2 in mPFC PVIs. Stereotaxic injection of lentivirus expressing Cre-dependent Cav3.2 inhibitory peptide (lentivirus-LSL-Cav3.2ct) into mPFC of PV-Cre mice. B-H SCZ-like behavioral phenotypes. B Increased locomotion activity in OF test. C Impaired spatial learning ability in NLT test. D-G Sociability deficits in SI, SN, RSI and RSN. H Impaired sensory gating in PPI test. n = 8 mice. I Specific activation of Cacna1h transcription in FXR1-cKO PVIs in the mPFC. Achievement of activation of Cav3.2 in mPFC FXR1-cKO PVIs through generation of FXR1-cKO; dCas9 activator mice with PVI-specific dCas9-SPH activator expression and stereotaxic injection of AAV expressing Cacna1h targeting guide RNA (AAV8-sgCacna1h-hSyn1-flex-mcherry) into the mPFC. J-P Rescue of SCZ-like behavioral deficits. J Hyper-activity is not rescued in OF test. K Improved spatial learning ability in NLT test. L-O Rescue of sociability deficits in SI, SN, RSI and RSN. P Rescue of impaired sensory gating in PPI test. n = 9 mice. All data are presented as mean ± SEM; Het: #p < 0.05, ##p < 0.01, ###p < 0.001; cKO: *p < 0.05, **p < 0.01, ***p < 0.001; Student’s two-tailed, unpaired t test (B-E, G, J-M, O), two-way ANOVA with Bonferroni post hoc test (F, H, N and P).

Comment in

References

    1. Kessler RC, Aguilar-Gaxiola S, Alonso J, Chatterji S, Lee S, Ormel J et al. The global burden of mental disorders: an update from the WHO World Mental Health (WMH) surveys. Epidemiol Psichiatr Soc 2009; 18(1): 23–33. - PMC - PubMed
    1. Sullivan PF, Kendler KS, Neale MC. Schizophrenia as a complex trait: evidence from a meta-analysis of twin studies. Arch Gen Psychiatry 2003; 60(12): 1187–1192. - PubMed
    1. Niwa M, Cash-Padgett T, Kubo KI, Saito A, Ishii K, Sumitomo A et al. DISC1 a key molecular lead in psychiatry and neurodevelopment: No-More Disrupted-in-Schizophrenia 1. Mol Psychiatry 2016; 21(11): 1488–1489. - PMC - PubMed
    1. Schizophrenia-Working-Group. Biological insights from 108 schizophrenia-associated genetic loci. Nature 2014; 511(7510): 421–427. - PMC - PubMed
    1. Takata A, Matsumoto N, Kato T. Genome-wide identification of splicing QTLs in the human brain and their enrichment among schizophrenia-associated loci. Nat Commun 2017; 8: 14519. - PMC - PubMed

Publication types