

An IgD-Fc-Ig fusion protein restrains the activation of T and B cells by inhibiting IgD-IgDR-Lck signaling in rheumatoid arthritis
- PMID: 33864023
- PMCID: PMC8791948
- DOI: 10.1038/s41401-021-00665-w
An IgD-Fc-Ig fusion protein restrains the activation of T and B cells by inhibiting IgD-IgDR-Lck signaling in rheumatoid arthritis
Abstract
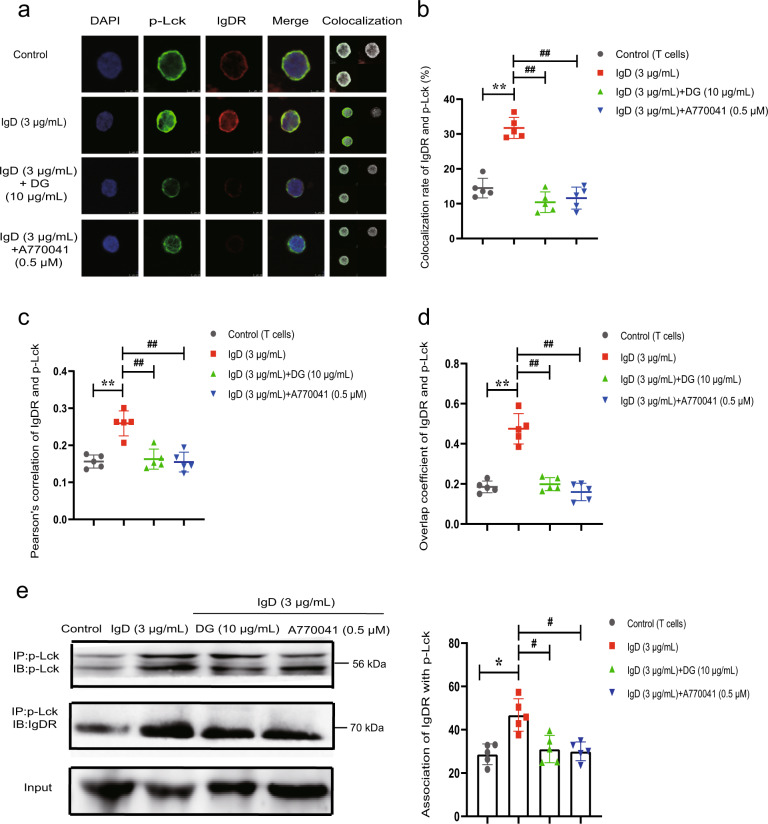
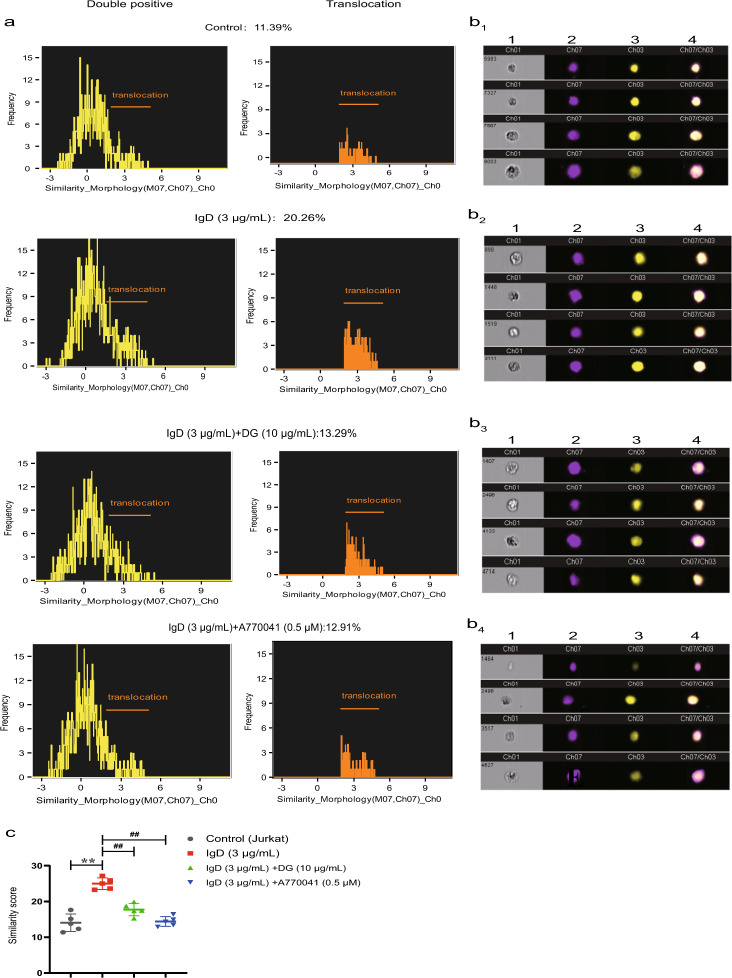
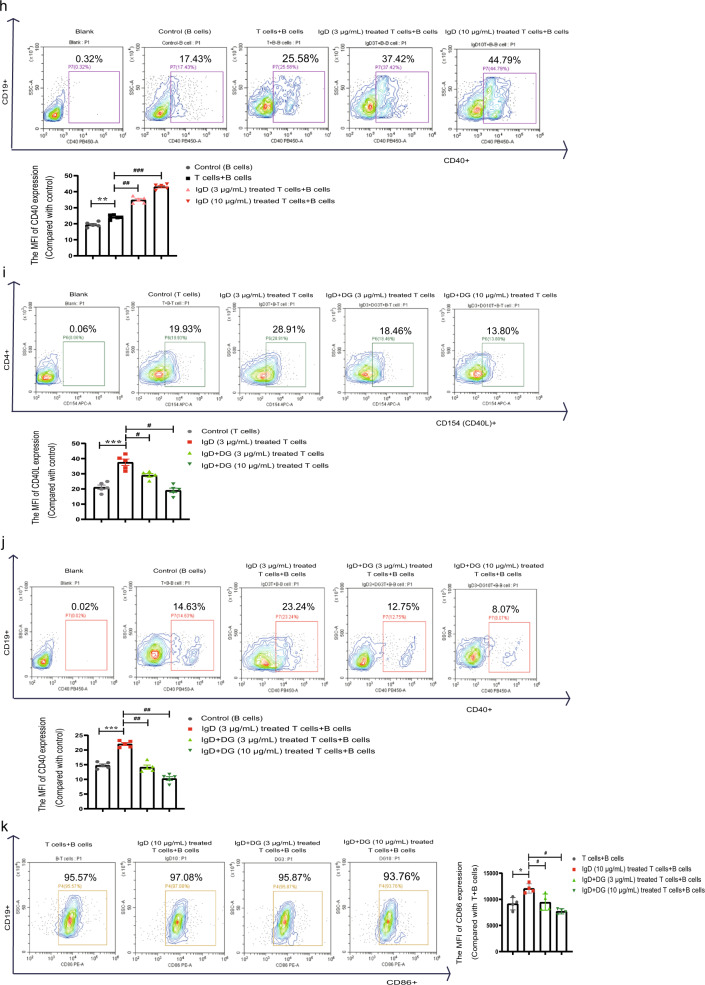
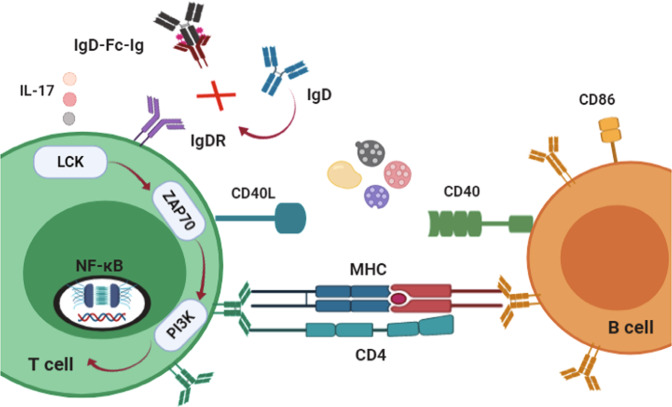
Rheumatoid arthritis (RA) is a chronic systemic autoimmune disease characterized by synovitis and the destruction of small joints. Emerging evidence shows that immunoglobulin D (IgD) stimulation induces T-cell activation, which may contribute to diseases pathogenesis in RA. In this study, we investigated the downstream signaling pathways by which IgD activated T cells as well as the possible role of IgD in the T-B interaction. Peripheral blood mononuclear cells were isolated from peripheral blood of healthy controls and RA patients. We demonstrated that IgD activated T cells through IgD receptor (IgDR)-lymphocyte-specific protein tyrosine kinase (Lck)-zeta-associated protein 70 (ZAP70)/phosphatidylinositol 3-kinase (PI3K)/nuclear factor kappa-B (NF-κB) signaling pathways; IgD-induced CD4+ T cells promoted the proliferation of CD19+ B cells in RA patients. A novel fusion protein IgD-Fc-Ig (composed of human IgD-Fc domain and IgG1 Fc domain, which specifically blocked the IgD-IgDR binding) inhibited the coexpression of IgDR and phosphorylated Lck (p-Lck) and the expression levels of p-Lck, p-ZAP70, p-PI3K on CD4+ T cells, and decreased NF-κB nuclear translocation in Jurkat cells. Meanwhile, IgD-Fc-Ig downregulated the expression levels of CD40L on CD4+ T cells as well as CD40, CD86 on CD19+ B cells in RA patients and healthy controls. It also decreased the expression levels of CD40L on CD4+ T cells and CD40 on CD19+ B cells from spleens of collagen-induced arthritis (CIA) mice and reduced IL-17A level in mouse serum. Moreover, administration of IgD-Fc-Ig (1.625-13 mg/kg, iv, twice a week for 4 weeks) in CIA mice dose-dependently decreased the protein expression levels of CD40, CD40L, and IgD in spleens. IgD-Fc-Ig restrains T-cell activation through inhibiting IgD-IgDR-Lck-ZAP70-PI3K-NF-κB signaling, thus inhibiting B-cell activation. Our data provide experimental evidences for application of IgD-Fc-Ig as a highly selective T cell-targeting treatment for RA.
Keywords: CD19+ B cells; CD4+ T cells; IgD-Fc-Ig; immunoglobulin D; immunoglobulin D receptor; rheumatoid arthritis.
© 2021. The Author(s), under exclusive licence to CPS and SIMM.
Conflict of interest statement
The authors declare no competing interests.
Figures


Similar articles
-
IgD-Fc-Ig fusion protein, a new biological agent, inhibits T cell function in CIA rats by inhibiting IgD-IgDR-Lck-NF-κB signaling pathways.Acta Pharmacol Sin. 2020 Jun;41(6):800-812. doi: 10.1038/s41401-019-0337-2. Epub 2020 Jan 14. Acta Pharmacol Sin. 2020. PMID: 31937932 Free PMC article.
-
Regulation of T Cell Activities in Rheumatoid Arthritis by the Novel Fusion Protein IgD-Fc-Ig.Front Immunol. 2020 May 15;11:755. doi: 10.3389/fimmu.2020.00755. eCollection 2020. Front Immunol. 2020. PMID: 32499775 Free PMC article.
-
IgD promotes pannus formation by activating Wnt5A-Fzd5-CTHRC1-NF-κB signaling pathway in FLS of CIA rats and the regulation of IgD-Fc-Ig fusion protein.Int Immunopharmacol. 2021 Dec;101(Pt A):108261. doi: 10.1016/j.intimp.2021.108261. Epub 2021 Oct 20. Int Immunopharmacol. 2021. PMID: 34688134
-
CTLA-4 blockade in the treatment of rheumatoid arthritis: an update.Expert Rev Clin Immunol. 2016;12(4):417-25. doi: 10.1586/1744666X.2016.1133295. Epub 2016 Jan 22. Expert Rev Clin Immunol. 2016. PMID: 26679631 Review.
-
The prospects for targeting FcR as a novel therapeutic strategy in rheumatoid arthritis.Biochem Pharmacol. 2021 Jan;183:114360. doi: 10.1016/j.bcp.2020.114360. Epub 2020 Dec 7. Biochem Pharmacol. 2021. PMID: 33301760 Review.
Cited by
-
Identification of essential genes and immune cell infiltration in rheumatoid arthritis by bioinformatics analysis.Sci Rep. 2023 Feb 4;13(1):2032. doi: 10.1038/s41598-023-29153-3. Sci Rep. 2023. PMID: 36739468 Free PMC article.
-
Identification of immunological characterization and Anoikis-related molecular clusters in rheumatoid arthritis.Front Mol Biosci. 2023 Nov 17;10:1202371. doi: 10.3389/fmolb.2023.1202371. eCollection 2023. Front Mol Biosci. 2023. PMID: 38046810 Free PMC article.
-
PSTPIP2 regulates synovial macrophages polarization and dynamics via ERβ in the joint microenvironment.Arthritis Res Ther. 2022 Nov 2;24(1):247. doi: 10.1186/s13075-022-02939-y. Arthritis Res Ther. 2022. PMID: 36324152 Free PMC article.
-
Therapeutic Fusion Proteins.AAPS J. 2023 Nov 30;26(1):3. doi: 10.1208/s12248-023-00873-8. AAPS J. 2023. PMID: 38036919 Review.
References
-
- Smolen JS, Landewé RBM, Bijlsma JWJ, Burmester GR, Dougados M, Kerschbaumer A, et al. EULAR recommendations for the management of rheumatoid arthritis with synthetic and biological disease-modifying antirheumatic drugs: 2019 update. Ann Rheum Dis. 2020;79:685–99. doi: 10.1136/annrheumdis-2019-216655. - DOI - PubMed
MeSH terms
Substances
LinkOut - more resources
Full Text Sources
Other Literature Sources
Medical
Research Materials
Miscellaneous
