. 2021 Aug 16;224(4):620-631.
doi: 10.1093/infdis/jiab212.

Cytomegalovirus Viral Load Kinetics Predict Cytomegalovirus End-Organ Disease and Mortality After Hematopoietic Cell Transplant

Affiliations

Cytomegalovirus Viral Load Kinetics Predict Cytomegalovirus End-Organ Disease and Mortality After Hematopoietic Cell Transplant

Anat Stern et al. J Infect Dis. .

Abstract

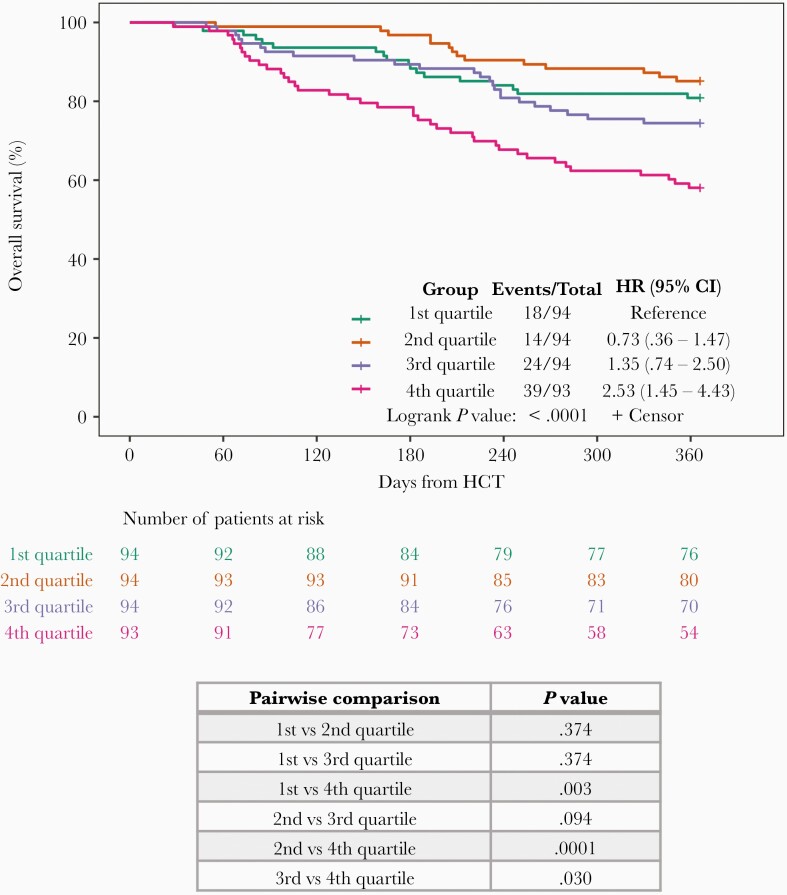
Background: We investigatedthe association between time-averaged area under the curve (AAUC) of cytomegalovirus (CMV) viral load (VL) by day 100 and overall survival (OS) at 1-year after hematopoietic cell transplantation (HCT).

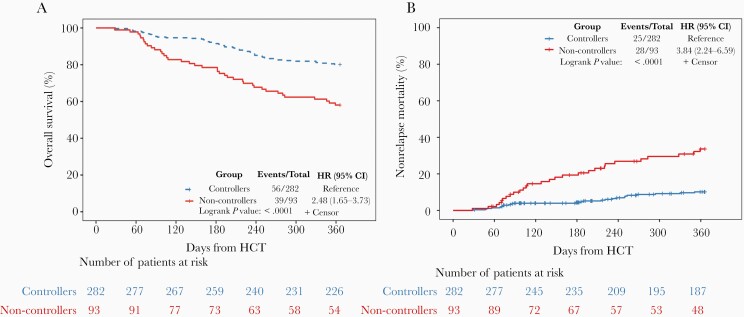
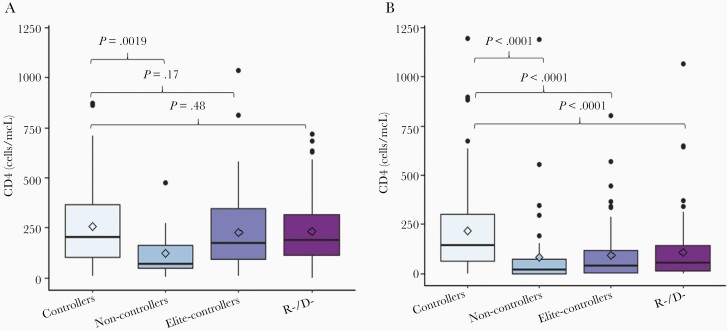
Methods: In a retrospective cohort study, including patients receiving HCT between June 2010 and December 2017 from Memorial Sloan Kettering Cancer Center, AAUC was calculated for patients with detected VL. Patients were categorized into non-controllers (Q4) and controllers (Q1-Q3) using the highest AAUC quartile as cutoff. Cox models were used to estimate the association between AAUC and OS. Patients with non-detected CMV VL were categorized into elite-controllers (recipient+ [R+] or R-/donor+ [D+]) and R-/D-.

Results: The study (N = 952) included 282 controllers, 93 non-controllers, 275 elite-controllers, and 302 R-/D-. OS was 80.1% and 58.1% for controllers and non-controllers, respectively. In multivariable models, non-controllers had worse OS versus controllers (adjusted hazard ratio [HR] = 2.65; 95% confidence interval [CI], 1.71-4.12). In landmark analyses, controllers had similar OS as elite-controllers (HR = 1.26; 95% CI, .83-1.91) or R-/D- (HR = 0.98; 95% CI, .64-1.5).

Conclusions: Non-controllers had worse OS 1-year post-HCT. Controllers had similar OS as elite-controllers or R-/D-. Future studies are needed to validate our AAUC cutoff across different cohorts and CMV management strategies.

Keywords: averaged area under the curve (AAUC); cytomegalovirus (CMV); end-organ disease (EOD); hematopoietic cell transplantation (HCT); non-relapse mortality (NRM); overall survival (OS); viral load (VL).


Figures

Figure 1.
Figure 1.
Overall survival at 1 year by AAUC quartile. AAUC was calculated for all patients with CMV viremia by day 100 post-HCT (n = 375). Patients were categorized by quartiles based on AAUC values. Kaplan-Meier curves of overall 1-year survival were generated and P values calculated using log rank test with Benjamini-Hochberg adjustment for each pair of AAUC quartiles separately. Abbreviations: AAUC, averaged area under the curve of CMV viral load; CI, confidence interval; CMV, cytomegalovirus; HCT, hematopoietic cell transplant; HR, hazard ratio.
Figure 2.
Figure 2.
Comparison of overall survival and non-relapse mortality amongst all patients with CMV viremia by day 100 post-HCT (n = 375) between CMV controllers and non-controllers. A, Kaplan-Meier curves for overall survival at 1 year by CMV controller status. B, Cumulative incidence curves for non-relapse mortality at 1 year by CMV controller status. Abbreviations: CI, confidence interval; CMV, cytomegalovirus; HCT, hematopoietic cell transplant; HR, hazard ratio.
Figure 3.
Figure 3.
Comparison of CMV kinetics and outcomes between CMV controllers (n = 282) and non-controllers (n = 93). CMV AAUC, maximum CMV VL, duration of CMV viremia, PET initiation by day 100, late CMV infection (occurring > day 100–180), CMV end-organ disease, and CMV-related mortality by 1-year post-HCT were compared between the 2 groups. All patients with CMV viremia by day 100 post-HCT were included (n = 375). A, Comparison of CMV viral kinetics by day 100. Horizontal lines represent median, boxes interquartile ranges, and whiskers range. P values were calculated with the Mann-Whitney U tests. B, Number (%) of CMV-related outcomes in CMV controllers and non-controllers. C, Unadjusted ORs (95% CI) for CMV outcomes in non-controllers (CMV controllers is the reference group). Abbreviations: AAUC, averaged area under the curve of CMV viral load; CI, confidence interval; CMV, cytomegalovirus; EOD, end-organ disease; HCT, hematopoietic cell transplant; OR, odds ratio; PET, preemptive therapy; VL, viral load.
Figure 4.
Figure 4.
Landmark analyses for overall survival and non-relapse mortality across the 4 groups including patients alive by day 100 (n = 883). One-year overall survival and non-relapse mortality were compared between CMV non-controllers, controllers, elite-controllers, and R−/D−. P values for pairwise comparison between groups were calculated using logrank tests and Gray's tests with Benjamini-Hochberg adjustment for overall survival and non-relapse mortality, respectively. A, Kaplan-Meier curves for overall survival for the 4 groups. B, Cumulative incidence curves for non-relapse mortality for the 4 groups. Abbreviations: CI, confidence interval; CMV, cytomegalovirus; D, donor; HCT, hematopoietic cell transplant; HR, hazard ratio; R, recipient.
Figure 5.
Figure 5.
Comparison of CD4+ counts across the 4 groups. CD4+ counts at day 100 were compared between CMV controllers and each of the 3 remaining study groups for unmodified and TCD HCT recipients separately. CD4+ results between day 80 and day 150 were included in the analyses. If > 1 result was available for the same patient within this time frame, only the CD4 number obtained closest to day 100 was included. Horizontal lines represent medians, boxes interquartile ranges, and whiskers ranges. P values were calculated using Mann-Whitney test. A, Unmodified HCT (n = 342). B, TCD HCT (n = 357). Abbreviations: CMV, cytomegalovirus; D, donor; HCT, hematopoietic cell transplant; R, recipient; TCD, T-cell depleted.

Comment in

References

    1. Boeckh M, Nichols WG. The impact of cytomegalovirus serostatus of donor and recipient before hematopoietic stem cell transplantation in the era of antiviral prophylaxis and preemptive therapy. Blood 2004; 103: 2003–8. - PubMed
    1. Schmidt-Hieber M, Labopin M, Beelen D, et al. . CMV serostatus still has an important prognostic impact in de novo acute leukemia patients after allogeneic stem cell transplantation: a report from the Acute Leukemia Working Party of EBMT. Blood 2013; 122:3359–64. - PubMed
    1. Schmidt-Hieber M, Tridello G, Ljungman P, et al. . The prognostic impact of the cytomegalovirus serostatus in patients with chronic hematological malignancies after allogeneic hematopoietic stem cell transplantation: a report from the Infectious Diseases Working Party of EBMT. Ann Hematol 2019; 98:1755–63. - PubMed
    1. Green ML, Leisenring W, Xie H, et al. . Cytomegalovirus viral load and mortality after haemopoietic stem cell transplantation in the era of pre-emptive therapy: a retrospective cohort study. Lancet Haematol 2016; 3:e119–27. - PMC - PubMed
    1. Teira P, Battiwalla M, Ramanathan M, et al. . Early cytomegalovirus reactivation remains associated with increased transplant-related mortality in the current era: a CIBMTR analysis. Blood 2016; 127:2427–38. - PMC - PubMed

Publication types