. 2021 Aug;51(8):1968-1979.
doi: 10.1002/eji.202048924. Epub 2021 May 5.

Peptidylprolyl isomerase C (Ppic) regulates invariant Natural Killer T cell (iNKT) differentiation in mice

Affiliations

Peptidylprolyl isomerase C (Ppic) regulates invariant Natural Killer T cell (iNKT) differentiation in mice

Ricardo S Paiva et al. Eur J Immunol. 2021 Aug.

Abstract

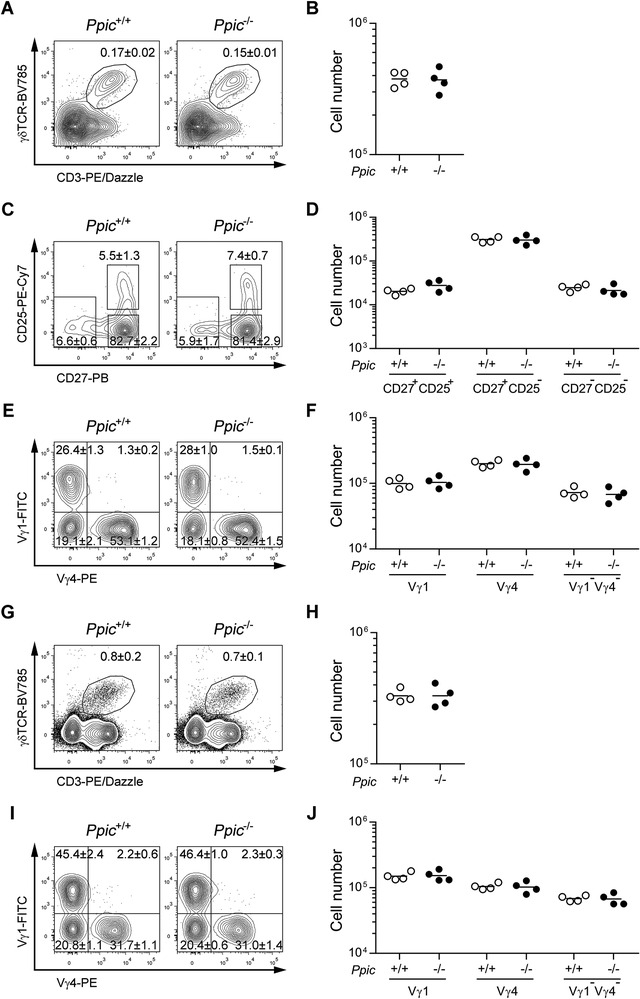
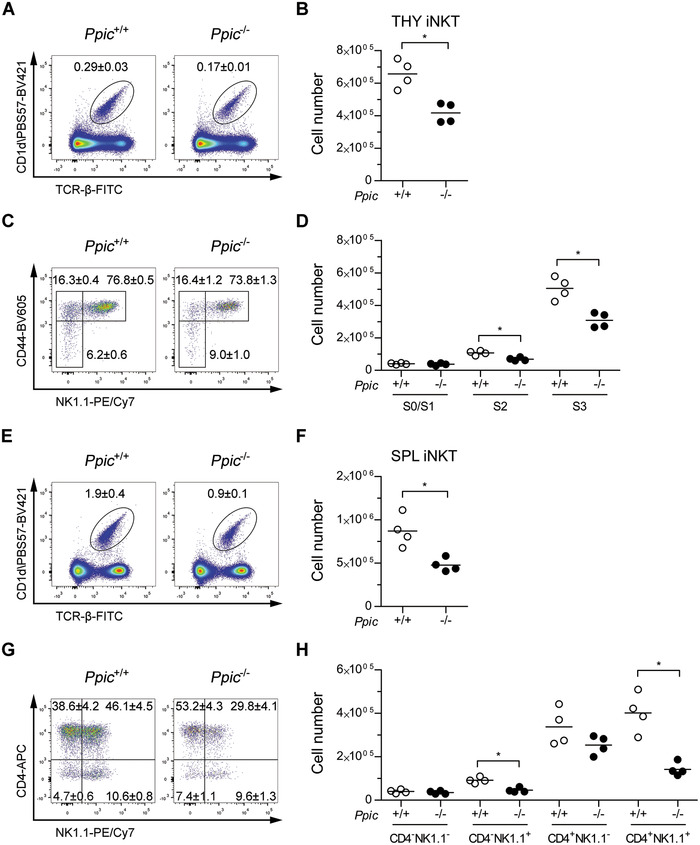
Peptidyl-prolyl cis-trans isomerase C (Ppic) is expressed in several bone marrow (BM) hematopoietic progenitors and in T-cell precursors. Since the expression profile of Ppic in the hematoimmune system was suggestive that it could play a role in hematopoiesis and/or T lymphocyte differentiation, we sought to test that hypothesis in vivo. Specifically, we generated a Ppic-deficient mouse model by targeting the endogenous locus by CRISPR/Cas9 and tested the requirement of Ppic in hematopoiesis. Several immune cell lineages covering BM progenitors, lymphocyte precursors, as well as mature cells at the periphery were analyzed. While most lineages were unaffected, invariant NKT (iNKT) cells were reduced in percentage and absolute cell numbers in the Ppic-deficient thymus. This affected the most mature stages in the thymus, S2 and S3, and the phenotype was maintained at the periphery. Additionally, immature transitional T1 and T2 B lymphocytes were increased in the Ppic-deficient spleen, but the phenotype was lost in mature B lymphocytes. In sum, our data show that Ppic is dispensable for myeloid cells, platelets, erythrocytes, αβ, and γδ T lymphocytes in vivo in the steady state, while being involved in B- and iNKT cell differentiation.

Keywords: Cyclophilin C; Hematopoiesis; Peptidylprolyl isomerase C; Ppic; T-cell development; Thymopoiesis.


Conflict of interest statement

The authors declare no commercial or financial conflict of interest.

Figures

Figure 1
Figure 1
Generation of Ppic‐deficient mice. (A) Ppic expression levels as measured by RNA seq were retrieved from the ImmGen Database [13] for the indicated cell populations in the BM (top), thymus (middle), and spleen (bottom). (B) Schematic representation of the Ppic endogenous locus (not to scale) showing the sequence targeted by the gRNA (magenta, in capitals), with the ATG (bold) and protospacer‐adjacent motif (underline) highlighted, and the primers used to genotype the progeny (arrows flanking exon 1). (C) Schematic representation of the wild type (Ppic WT, top) and mutant (Ppic Mut, bottom) predicted cDNA. Below is the alignment of the WT and mutant sequences of Ppic, highlighting the 4‐nucleotide insertion in the latter that causes a frameshift followed by early STOP codons, which are marked in the schematics by red triangles.
Figure 2
Figure 2
Ppic deficiency does not affect the hematopoietic progenitors in the BM. The BM of age‐ and gender‐matched Ppic+/+ and Ppic−/− mice were analyzed by flow cytometry. (A) Shown are FACS plots of the gate used for LSK in live lineage‐negative cells. (B) Quantification of the absolute cell numbers in (A). (C) FACS plots of LSK‐gated cells, as in (A), defining: hematopoietic stem cells (HSC), further analyzed in (D), multipotent progenitors (MPP) 2, and MPP3‐4, further detailed in (E) (from left to right and top to bottom). (D) HSC were further gated to distinguish long‐term HSC (LT‐HSC, left gate) and short‐term HSC (ST‐HSC, right gate). (E) MPP3‐4 in (C) were further gated to distinguish MPP3 (top gate) and MPP4 (bottom gate). (F) Quantification of the absolute number of cells in (C), (D), and (E). (G) Cells shown were gated on Lineage‐negative, Kit‐positive, Sca1‐negative, CD127‐negative, and gates correspond to MEP, GMP, and CMP (left to right and top to bottom). (H) Quantification of the absolute cell numbers in (G). (I) FACS plots of the gate used for CLP, showing cells gated on lineage‐negative cells. (J) Quantification of the absolute cell numbers in (H). Numbers above the gates represent mean ± SD of the percentages of the corresponding gate in one representative experiment (A, C, D, E, G, I). In the graphs depicting the quantification of absolute numbers, cells were normalized to 105 live BM cells. Each symbol represents one mouse and the horizontal line is the mean (B, F, H, J). Data shown are from one representative experiment of a total of three independent experiments, each with a minimum n = 3 mice per group. Mann–Whitney U test revealed no statistical difference.
Figure 3
Figure 3
Ppic−/− mice have an increase in immature transitional T1 and T2 B cells in the spleen. (A) The BM of Ppic +/+ and Ppic −/− mice were analyzed for the indicated cell populations, and cell numbers were normalized for 105 total live BM cells. (B) Shown is the cell number of the indicated subpopulations in the spleen. (C) Cell number of the indicated mature B‐cell subsets in the spleen. Each symbol represents one mouse and the horizontal line is the mean. Data are from one representative of a total of three independent experiments, each with a minimum n = 3 mice per group. *p < 0.05 Mann–Whitney U test.
Figure 4
Figure 4
αβ Tcell development is unaffected in Ppic / mice. (A) Thymοcytes of age‐ and gender‐matched Ppic+/+ and Ppic−/− mice were analyzed by flow cytometry for the indicated markers. (B) Absolute cell numbers were quantified for CD4+CD8+ double positive (DP), CD8 single positive (CD8SP), and CD4 single positive (CD4SP) gated as in (A). (C) CD4CD8 double‐negative thymocytes in (A) were further gated as CD3‐negative and analyzed for the indicated markers. Gates from top left to bottom right identify early thymus progenitors (ETP), the double‐negative 2 (DN2), and the double‐negative 3 (DN3) thymocytes. (D) Quantification of the absolute number of cells in (C), as well as DN4 (CD117CD25CD44). (E) The spleen of the same animals was analyzed and shown are representative histograms of live cells, showing the identification of αβ T lymphocytes (top), further gated (below) as CD4 and CD8 T lymphocytes. (F) Quantification of the absolute cell numbers in (E). (G) Ratio of CD4 to CD8 T lymphocytes in the spleen. Numbers in the FACS plots are the mean ± SD of the percentage of the populations gated in one representative experiment (A, C, E). Each symbol represents one mouse and the horizontal line is the mean (B, D, F, G). Data are from one representative of a total of six independent experiments each with a minimum n = 3 mice per group. Mann–Whitney U test revealed no statistical differences.
Figure 5
Figure 5
γδ Tcell development is unaffected in Ppic / mice. Thymocytes of age‐ and gender‐matched Ppic+/+ and Ppic−/− mice were analyzed by flow cytometry (A‐F). (A) Representative FACS plots of the gate used for defining γδ T lymphocytes, depicting cells gated on CD4‐CD8‐ double negative. (B) Quantification of the absolute cell numbers in (A). (C) γδ T lymphocytes gated in (A) were further gated as shown for the distinction of differentiation stages. (D) Quantification of the absolute number of cells gated in (C). (E) γδ T lymphocytes gated in (A) were further gated as shown for the expression of the Vγ distribution. (F) Quantification of the absolute cell numbers in (E). Splenocytes of the same mice were analyzed (G‐J). (G) Representative FACS plots of the gate used for defining γδ T lymphocytes, depicting cells gated on live cells. (H) Quantification of the absolute number of cells gated in (G). (I) γδ T lymphocytes gated in (G) were further gated as shown for the expression of the Vγ distribution. (J) Quantification of the absolute cell numbers as gated in (I). Values in the FACS plots are the mean ± SD of the percentages of the populations gated in one representative experiment (A, C, E, G, I). Each symbol represents one mouse and the horizontal line is the mean (B, D, F, H, J). Data are from one representative of a total of three independent experiments each with a minimum n = 3 mice per group. Mann–Whitney U test revealed no statistical differences.
Figure 6
Figure 6
iNKT cell differentiation is impaired in Ppic‐deficient mice, and the phenotype persists in the spleen. Thymocytes of age‐ and gender‐matched Ppic+/+ and Ppic−/− mice were analyzed by flow cytometry to assess iNKT cell development (A‐D). (A) Representative FACS plots of the gate used for defining iNKT cells, depicting live thymocytes and identifying PBS57‐loaded CD1d tetramers versus TCR‐β. (B) Quantification of the absolute number of cells in (A). (C) iNKT cells in (A) were further analyzed as shown for the distinction of differentiation stages. (D) Quantification of the absolute number of cells gated in (C). Splenocytes of the same mice were analyzed (E‐H). (E) Representative FACS plots of the gate used for defining iNKT cells, depicting live cells. (F) Quantification of the absolute number of cells in (E). (G) iNKT cells gated in (E) were further gated as shown to define functional subsets. (H) Quantification of the absolute number of cells in (G). Values in the FACS plots are the mean ± SD of the gated populations in one representative experiment (A, C, E, G). Each symbol represents one mouse and the horizontal line is the mean (B, D, F, H). Data are from one representative of a total of two independent experiments each with a minimum n = 3 mice per group. *p < 0.05 Mann–Whitney U test.

References

    1. Friedman, J. and Weissman, I., Two cytoplasmic candidates for immunophilin action are revealed by affinity for a new cyclophilin: one in the presence and one in the absence of CsA. Cell 1991. 66: 799–806. - PubMed
    1. Otsuka, M., Terada, Y., Yang, T., Nonoguchi, H., Tomita, K. and Marumo, F., Localization of cyclophilin A and cyclophilin C mRNA in murine kidney using RT‐PCR. Kidney Int. 1994. 45: 1340–1345. - PubMed
    1. Friedman, J., Weissman, I., Friedman, J. and Alpert, S., An analysis of the expression of cyclophilin C reveals tissue restriction and an intriguing pattern in the mouse kidney. Am. J. Pathol. 1994. 144: 1247–1256. - PMC - PubMed
    1. Bram, R. J., Hung, D. T., Martin, P. K., Schreiber, S. L. and Crabtree, G. R., Identification of the immunophilins capable of mediating inhibition of signal transduction by cyclosporin A and FK506: roles of calcineurin binding and cellular location. Mol. Cell. Biol. 1993. 13: 4760–4769. - PMC - PubMed
    1. Stocki, P., Chapman, D. C., Beach, L. A. and Williams, D. B., Depletion of cyclophilins B and C leads to dysregulation of endoplasmic reticulum redox homeostasis. J. Biol. Chem. 2014. 289: 23086–23096. - PMC - PubMed

Publication types