

Improving the design of an oxidative stress sensing biosensor in yeast
- PMID: 33864457
- PMCID: PMC8088429
- DOI: 10.1093/femsyr/foab025
Improving the design of an oxidative stress sensing biosensor in yeast
Abstract
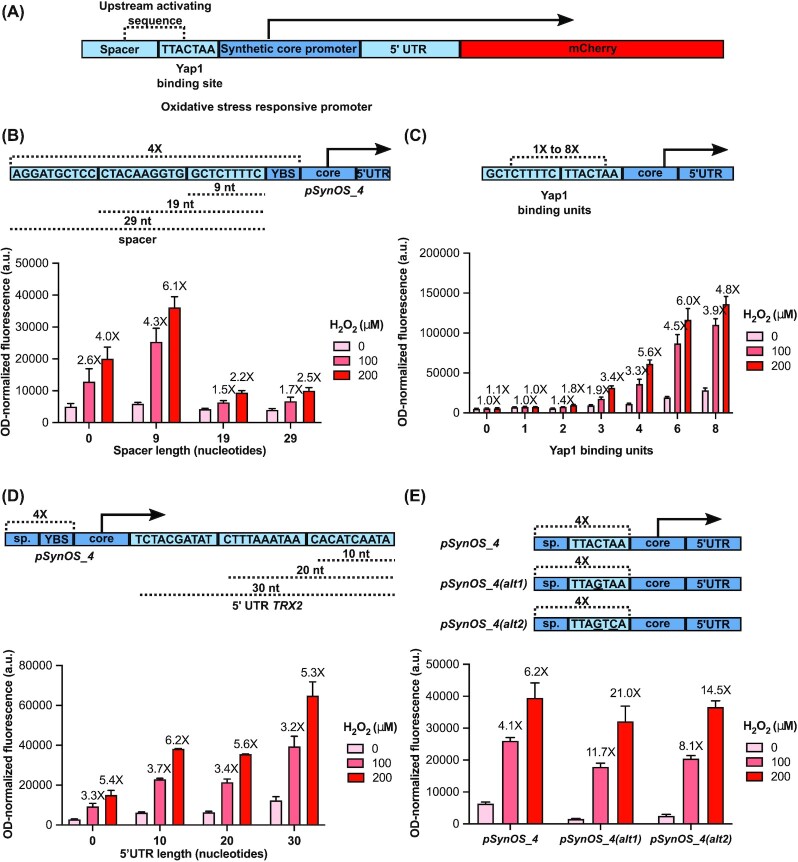
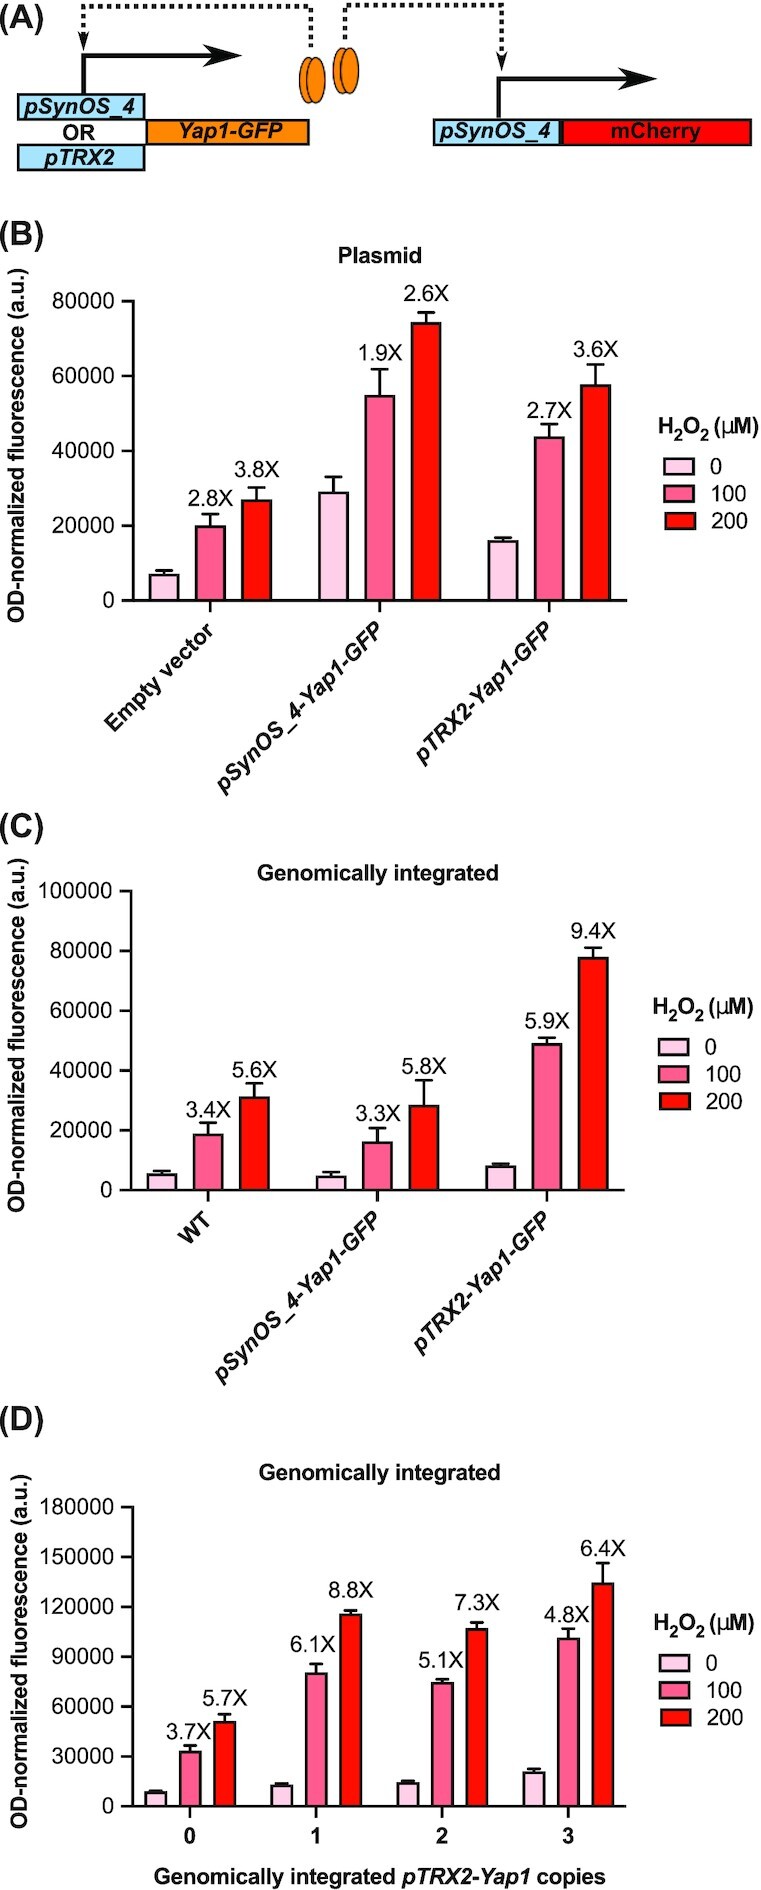
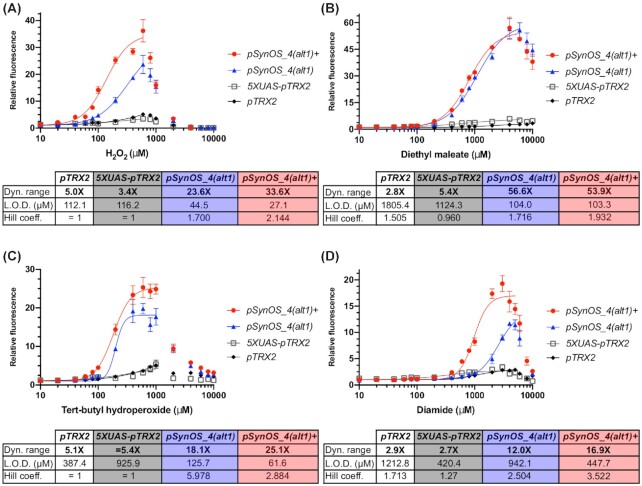
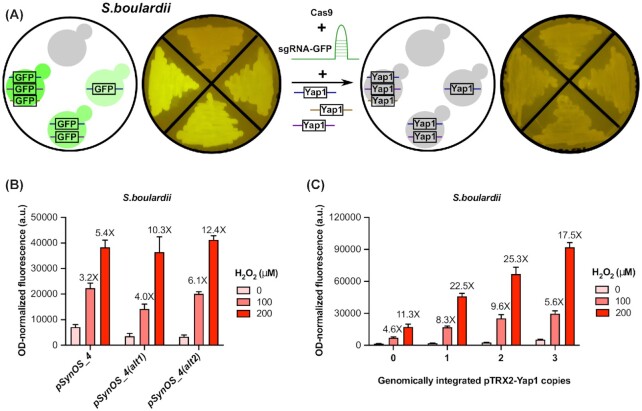
Transcription factor (TF)-based biosensors have proven useful for increasing biomanufacturing yields, large-scale functional screening, and in environmental monitoring. Most yeast TF-based biosensors are built from natural promoters, resulting in large DNA parts retaining considerable homology to the host genome, which can complicate biological engineering efforts. There is a need to explore smaller, synthetic biosensors to expand the options for regulating gene expression in yeast. Here, we present a systematic approach to improving the design of an existing oxidative stress sensing biosensor in Saccharomyces cerevisiae based on the Yap1 transcription factor. Starting from a synthetic core promoter, we optimized the activity of a Yap1-dependent promoter through rational modification of a minimalist Yap1 upstream activating sequence. Our novel promoter achieves dynamic ranges of activation surpassing those of the previously engineered Yap1-dependent promoter, while reducing it to only 171 base pairs. We demonstrate that coupling the promoter to a positive-feedback-regulated TF further improves the biosensor by increasing its dynamic range of activation and reducing its limit of detection. We have illustrated the robustness and transferability of the biosensor by reproducing its activity in an unconventional probiotic yeast strain, Saccharomyces boulardii. Our findings can provide guidance in the general process of TF-based biosensor design.
Keywords: Saccharomyces boulardii; cell-based biosensor; oxidative stress; promoter engineering; reactive oxygen species; synthetic biology.
© The Author(s) 2021. Published by Oxford University Press on behalf of FEMS.
Figures
Similar articles
-
Engineered Saccharomyces cerevisiae strain BioS-OS1/2, for the detection of oxidative stress.Biotechnol Prog. 2005 Sep-Oct;21(5):1373-9. doi: 10.1021/bp050104j. Biotechnol Prog. 2005. PMID: 16209540
-
Expanding the Dynamic Range of a Transcription Factor-Based Biosensor in Saccharomyces cerevisiae.ACS Synth Biol. 2019 Sep 20;8(9):1968-1975. doi: 10.1021/acssynbio.9b00144. Epub 2019 Aug 9. ACS Synth Biol. 2019. PMID: 31373795
-
Engineering transcription factor-based biosensors for repressive regulation through transcriptional deactivation design in Saccharomyces cerevisiae.Microb Cell Fact. 2020 Jul 20;19(1):146. doi: 10.1186/s12934-020-01405-1. Microb Cell Fact. 2020. PMID: 32690010 Free PMC article.
-
Biosensors design in yeast and applications in metabolic engineering.FEMS Yeast Res. 2019 Dec 1;19(8):foz082. doi: 10.1093/femsyr/foz082. FEMS Yeast Res. 2019. PMID: 31778177 Review.
-
Natural and modified promoters for tailored metabolic engineering of the yeast Saccharomyces cerevisiae.Methods Mol Biol. 2014;1152:17-42. doi: 10.1007/978-1-4939-0563-8_2. Methods Mol Biol. 2014. PMID: 24744025 Review.
Cited by
-
Engineering Saccharomyces cerevisiae for medical applications.Microb Cell Fact. 2025 Jan 9;24(1):12. doi: 10.1186/s12934-024-02625-5. Microb Cell Fact. 2025. PMID: 39789534 Free PMC article. Review.
-
Biosensors for point-of-care testing and personalized monitoring of gastrointestinal microbiota.Front Microbiol. 2023 May 5;14:1114707. doi: 10.3389/fmicb.2023.1114707. eCollection 2023. Front Microbiol. 2023. PMID: 37213495 Free PMC article. Review.
-
Advances in the dynamic control of metabolic pathways in Saccharomyces cerevisiae.Eng Microbiol. 2023 Jun 21;3(4):100103. doi: 10.1016/j.engmic.2023.100103. eCollection 2023 Dec. Eng Microbiol. 2023. PMID: 39628908 Free PMC article. Review.
-
Reactive Oxygen Species: A Double-Edged Sword in the Modulation of Cancer Signaling Pathway Dynamics.Cells. 2025 Aug 6;14(15):1207. doi: 10.3390/cells14151207. Cells. 2025. PMID: 40801639 Free PMC article. Review.
-
Extending dynamic and operational range of the biosensor responding to l-carnitine by directed evolution.Synth Syst Biotechnol. 2025 Apr 22;10(3):897-906. doi: 10.1016/j.synbio.2025.04.012. eCollection 2025 Sep. Synth Syst Biotechnol. 2025. PMID: 40386442 Free PMC article.
References
-
- Archer EJ, Robinson AB, Süel GM. Engineered E. Coli That Detect and Respond to Gut Inflammation through Nitric Oxide Sensing. ACS Synthetic Biology. 2012;1:451–7. - PubMed
-
- Cai S, Shen Y, Zou Yet al. . Engineering Highly Sensitive Whole-Cell Mercury Biosensors Based on Positive Feedback Loops from Quorum-Sensing Systems. Analyst. 2018;143:630–4. - PubMed
Publication types
MeSH terms
Substances
LinkOut - more resources
Full Text Sources
Other Literature Sources
Molecular Biology Databases
Research Materials
Miscellaneous
