

Estimating the reference interval from a fixed effects meta-analysis
- PMID: 33864652
- PMCID: PMC8924903
- DOI: 10.1002/jrsm.1488
Estimating the reference interval from a fixed effects meta-analysis
Abstract
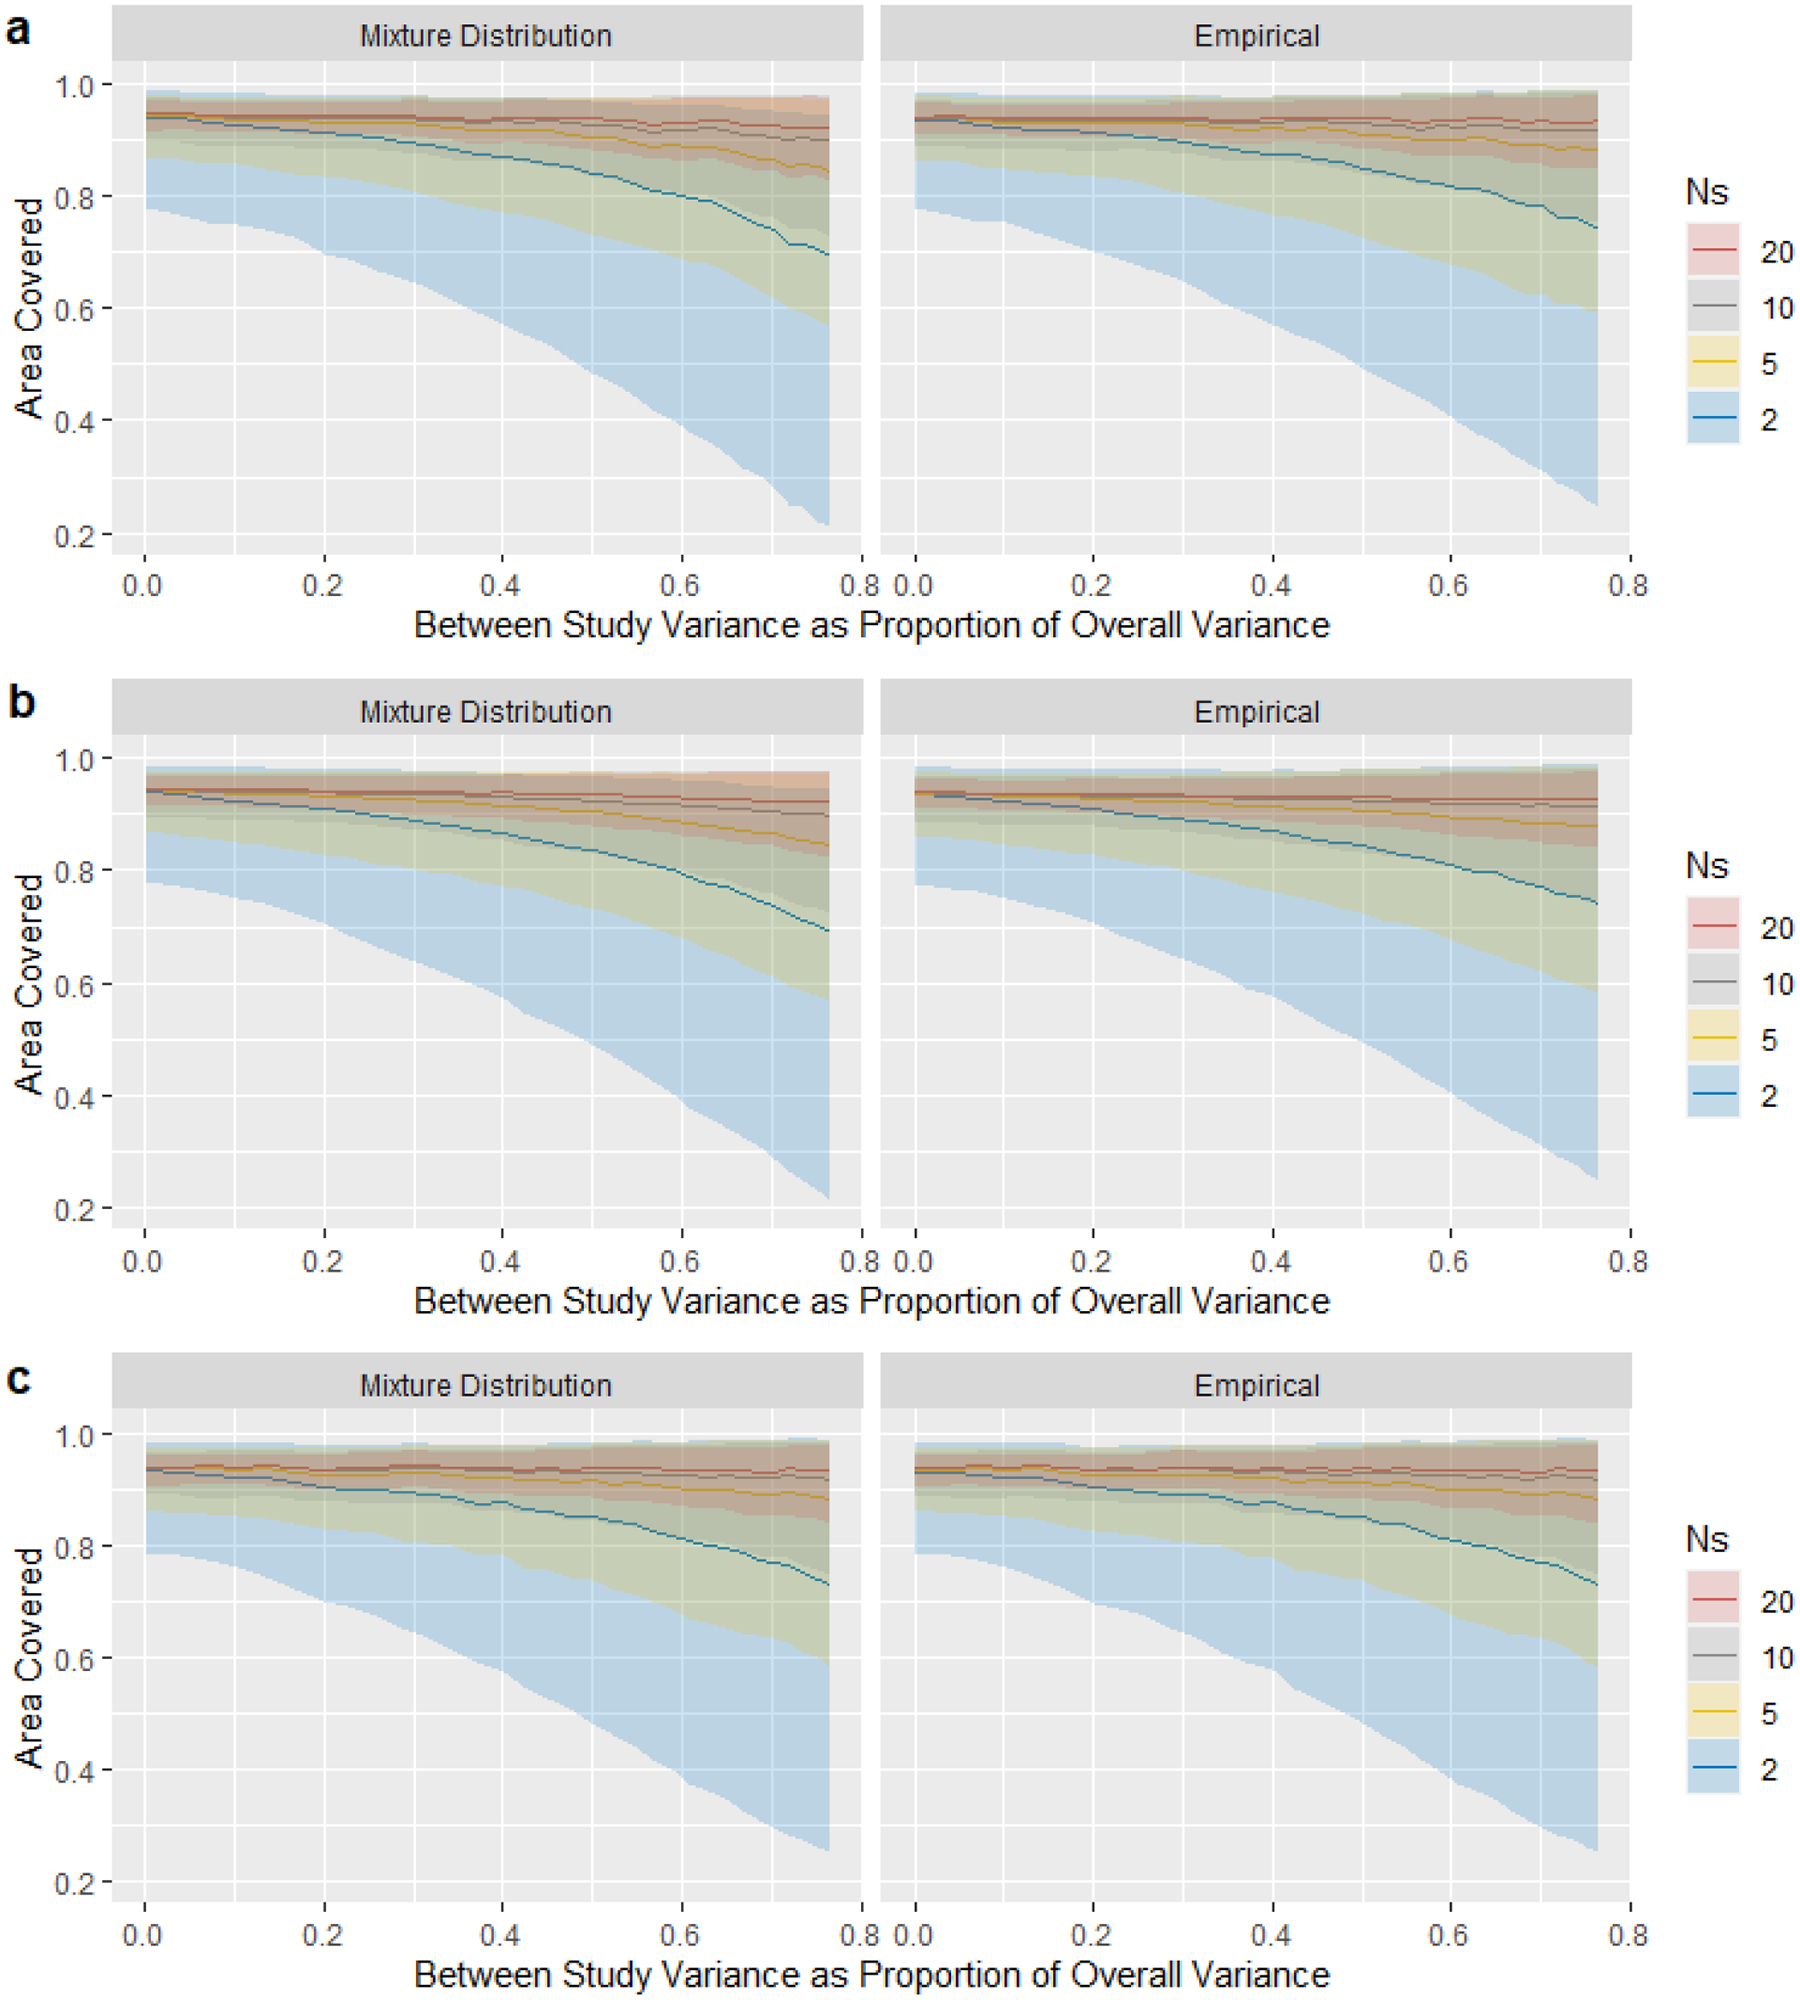
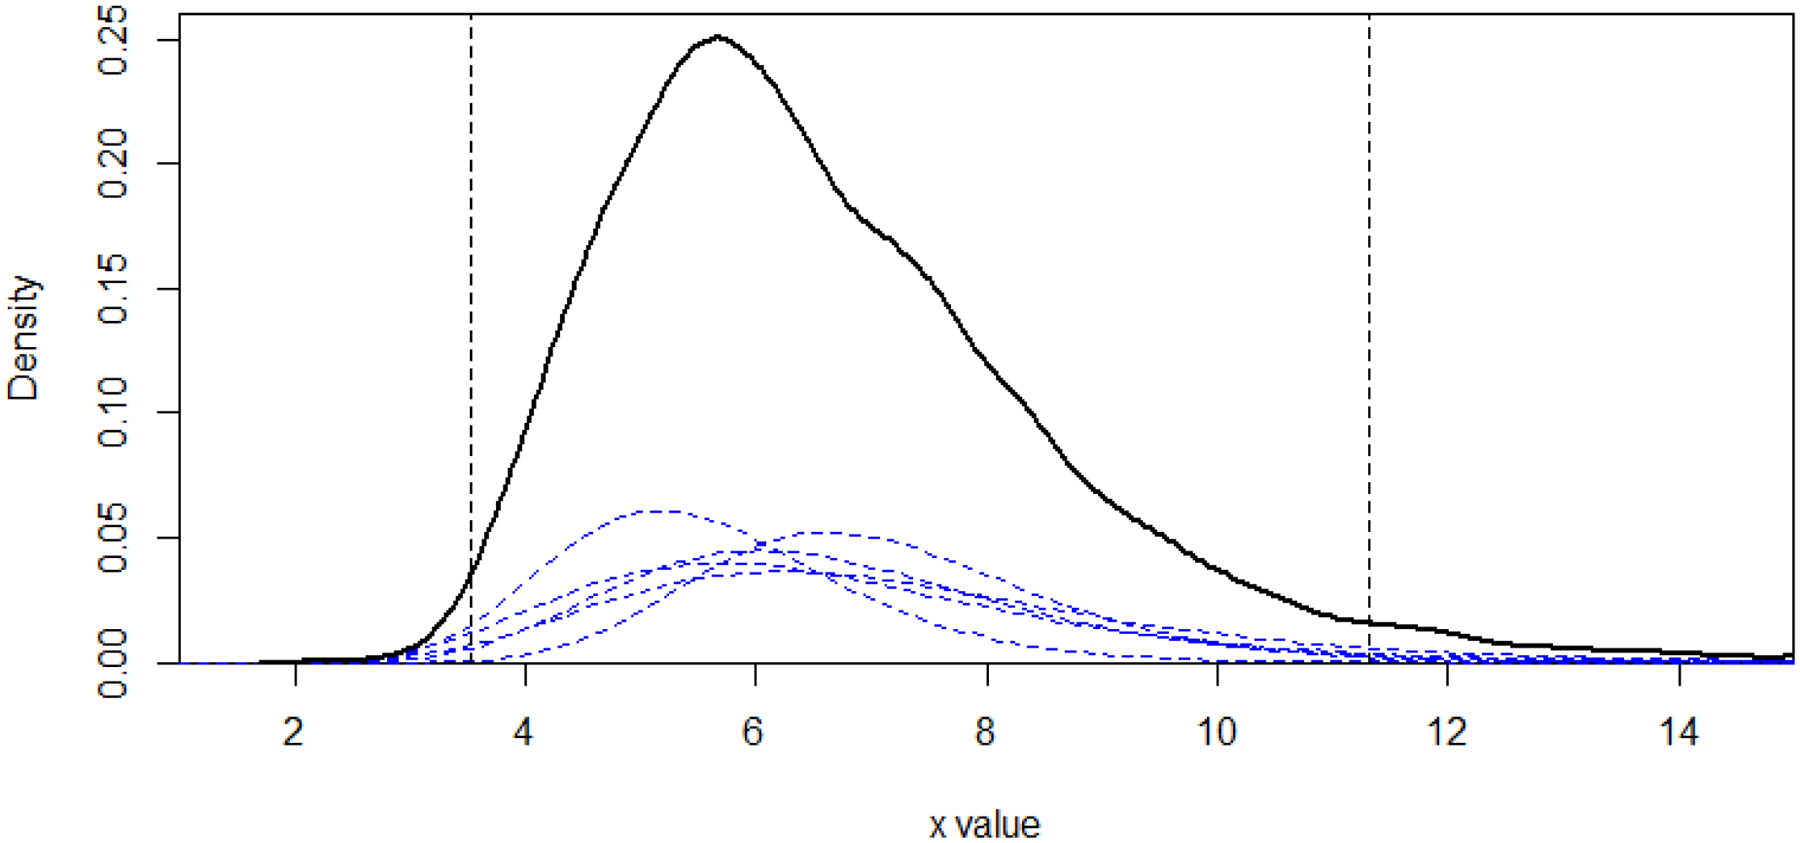
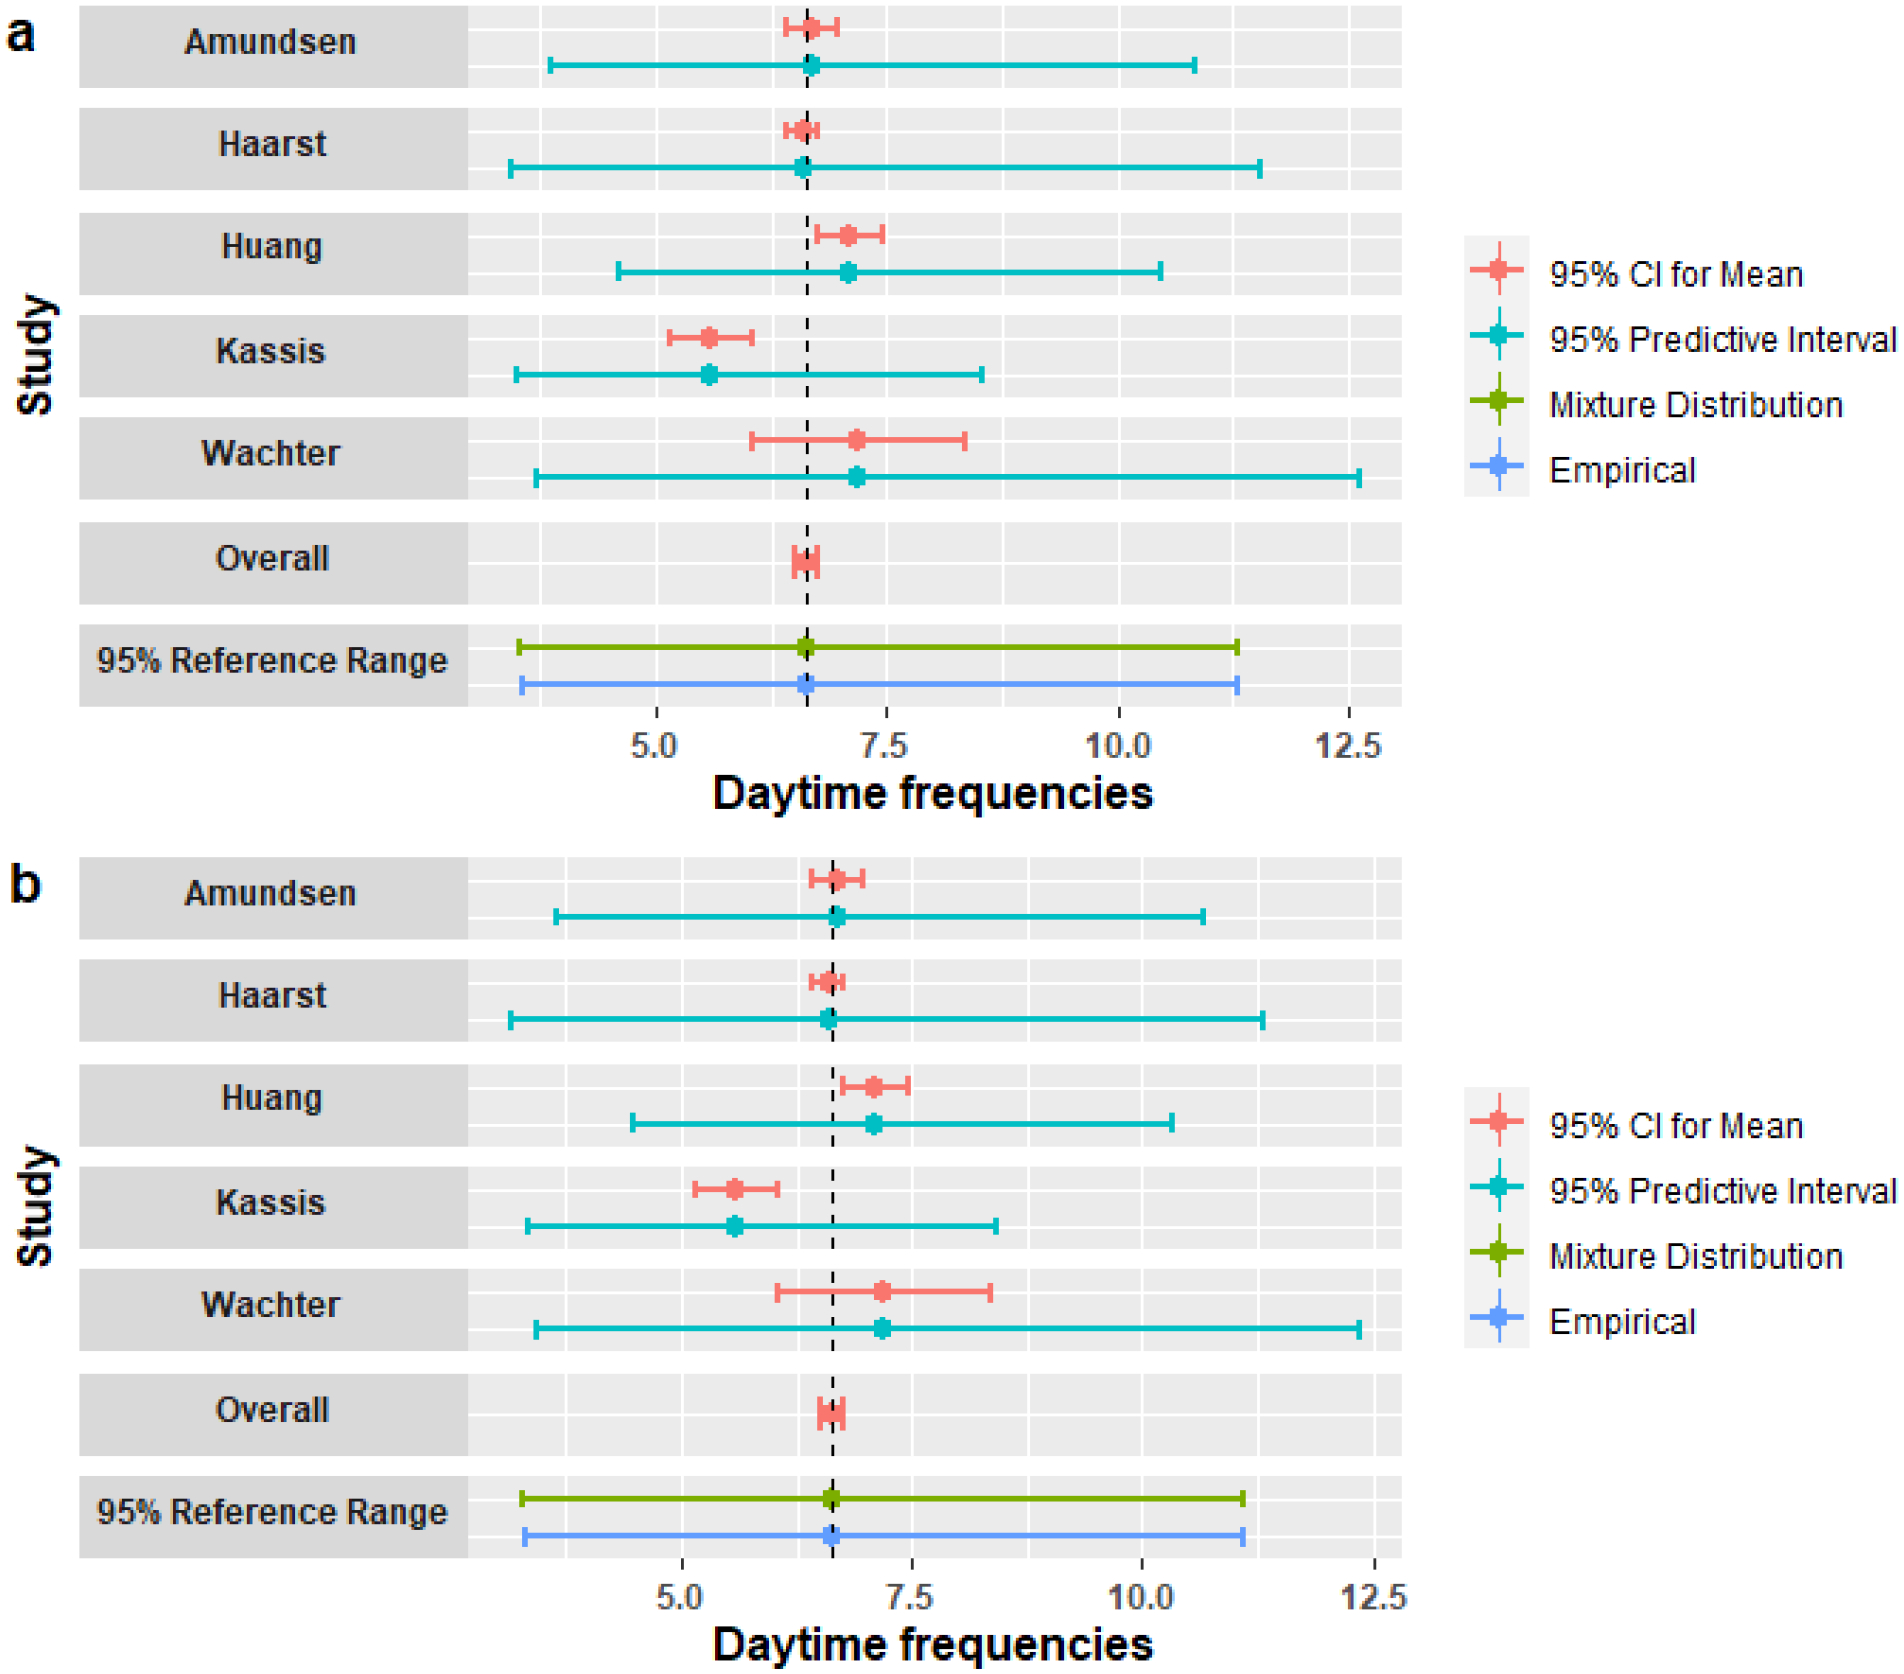
A reference interval provides a basis for physicians to determine whether a measurement is typical of a healthy individual. It can be interpreted as a prediction interval for a new individual from the overall population. However, a reference interval based on a single study may not be representative of the broader population. Meta-analysis can provide a general reference interval based on the overall population by combining results from multiple studies. Methods for estimating the reference interval from a random effects meta-analysis have been recently proposed to incorporate the within and between-study variation, but a random effects model may give imprecise estimates of the between-study variation with only few studies. In addition, the normal distribution of underlying study-specific means, and equal within-study variance assumption in these methods may be inappropriate in some settings. In this article, we aim to estimate the reference interval based on the fixed effects model assuming study effects are unrelated, which is useful for a meta-analysis with only a few studies (e.g., ≤5). We propose a mixture distribution method only assuming parametric distributions (e.g., normal) for individuals within each study and integrating them to form the overall population distribution. This method is compared to an empirical method only assuming a parametric overall population distribution. Simulation studies have shown that both methods can estimate a reference interval with coverage close to the targeted value (i.e., 95%). Meta-analyses of women daytime urination frequency and frontal subjective postural vertical measurements are reanalyzed to demonstrate the application of our methods.
Keywords: fixed effects model; meta-analysis; reference interval; very few studies.
© 2021 John Wiley & Sons Ltd.
Conflict of interest statement
Conflict of Interest
The author reported no conflict of interest.
Figures

References
-
- Horn PS, Pesce AJ. A robust approach to reference interval estimation and evaluation. Clin Chim Acta. 2003;334(1–2):5–23. - PubMed
-
- Horn PS, Pesce AJ, Copeland BE. A robust approach to reference interval estimation and evaluation. Clin Chem. 1998;44(3):622–631. - PubMed
-
- Pathan F, D’Elia N, Nolan MT, Marwick TH, Negishi K. Normal ranges of left atrial strain by speckle-tracking echocardiography: a systematic review and meta-analysis. J Am Soc Echocardiogr. 2017;30(1):59–70. - PubMed
Publication types
MeSH terms
Grants and funding
LinkOut - more resources
Full Text Sources
Other Literature Sources
