. 2021 May 13;184(10):2633-2648.e19.
doi: 10.1016/j.cell.2021.03.050. Epub 2021 Apr 16.

Population-scale tissue transcriptomics maps long non-coding RNAs to complex disease

Collaborators, Affiliations

Population-scale tissue transcriptomics maps long non-coding RNAs to complex disease

Olivia M de Goede et al. Cell. .

Abstract

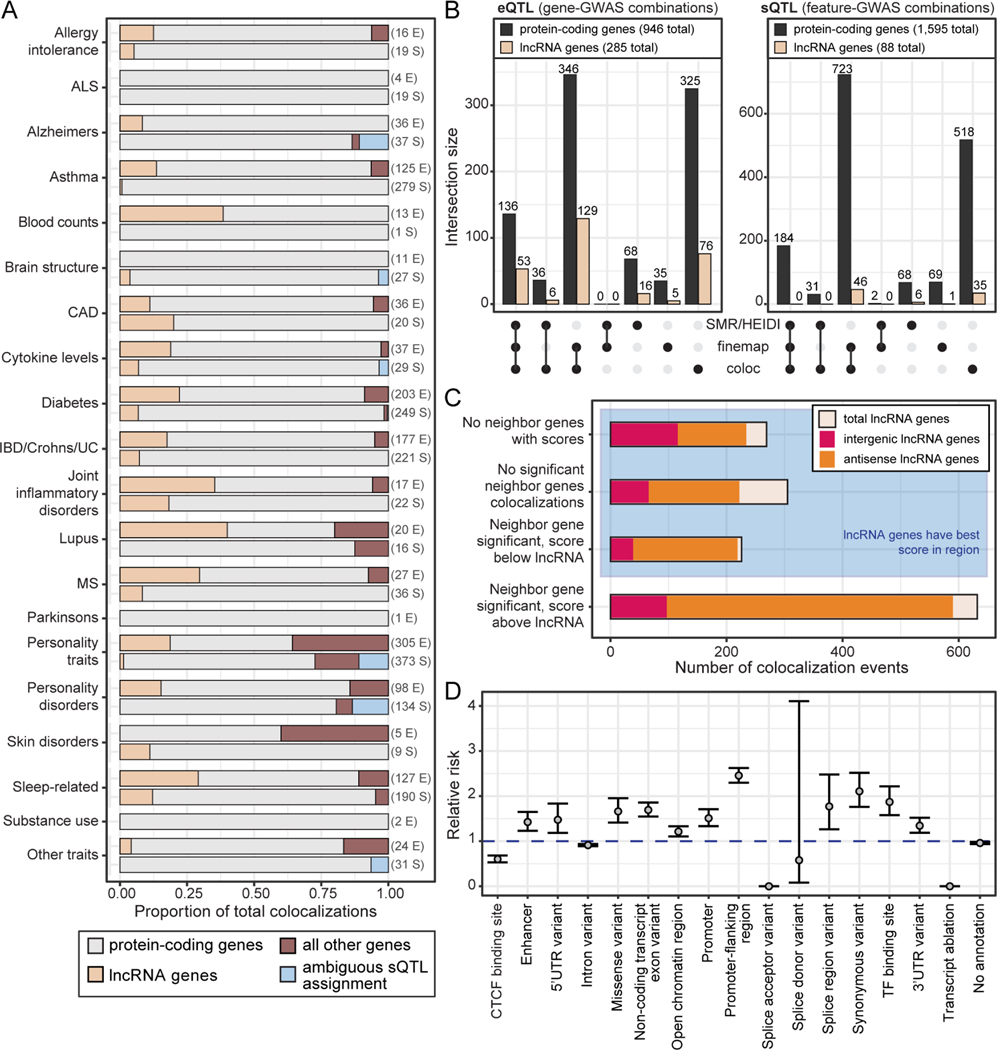
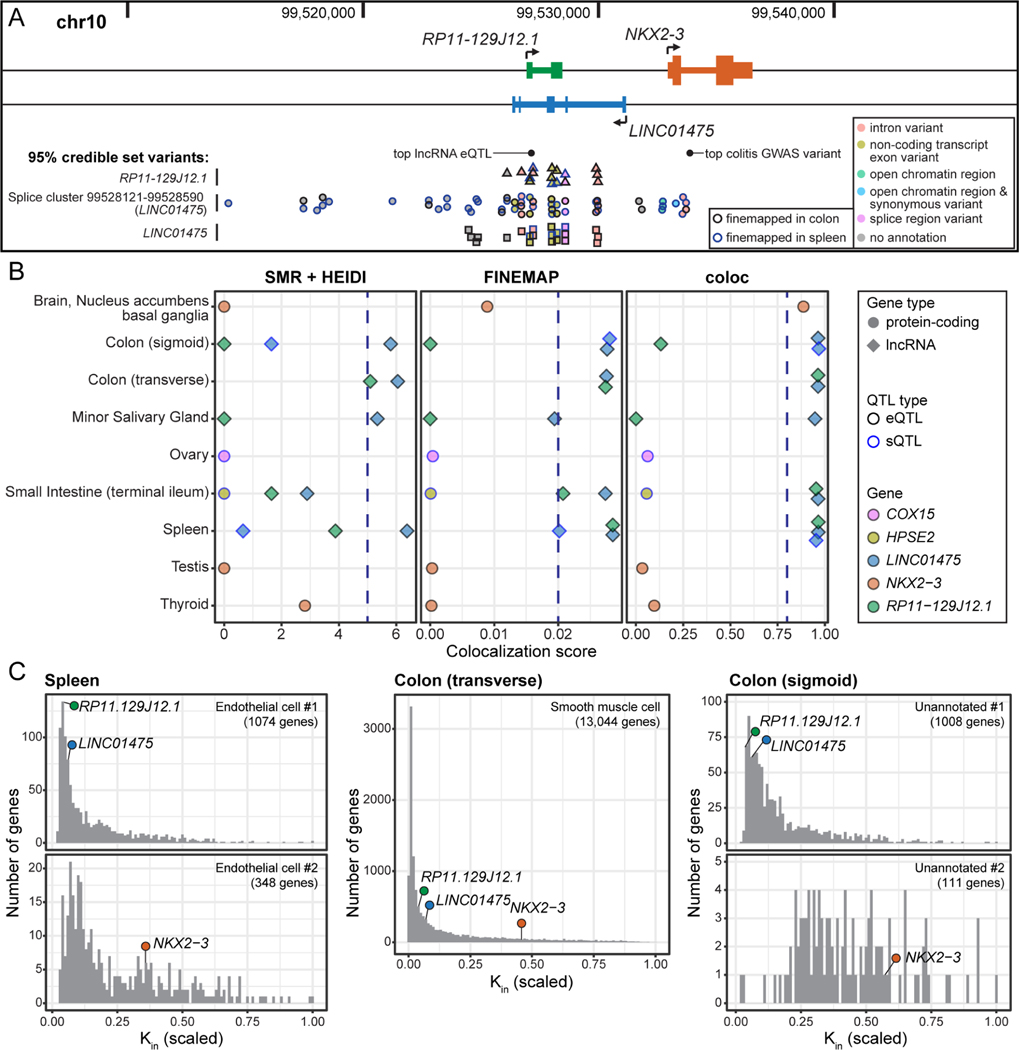
Long non-coding RNA (lncRNA) genes have well-established and important impacts on molecular and cellular functions. However, among the thousands of lncRNA genes, it is still a major challenge to identify the subset with disease or trait relevance. To systematically characterize these lncRNA genes, we used Genotype Tissue Expression (GTEx) project v8 genetic and multi-tissue transcriptomic data to profile the expression, genetic regulation, cellular contexts, and trait associations of 14,100 lncRNA genes across 49 tissues for 101 distinct complex genetic traits. Using these approaches, we identified 1,432 lncRNA gene-trait associations, 800 of which were not explained by stronger effects of neighboring protein-coding genes. This included associations between lncRNA quantitative trait loci and inflammatory bowel disease, type 1 and type 2 diabetes, and coronary artery disease, as well as rare variant associations to body mass index.

Keywords: GTEx; co-expression; colocalization; complex trait; disease; eQTL; expression quantitative trait loci; lncRNA; long non-coding RNA.


Conflict of interest statement

Declaration of interests F.A. is an inventor on a patent application related to TensorQTL; S.E.C. is a co-founder and chief technology officer at Variant Bio and owns stock in Variant Bio; T.L. is on the scientific advisory board of Variant Bio, Goldfinch Bio, and GSK and owns stock in Variant Bio; and S.B.M. is on the scientific advisory board of MyOme. All other authors report no competing interests.

Figures

Figure 1.
Figure 1.
Specificity of gene expression and presence of eQTLs across GTEx tissues. (A) The numbers of lncRNA genes with tissue-specific expression across the broad tissue categories of GTEx. (B) Proportion of expressed genes that were eGenes (MashR LFSR <0.05). Boxplots reflect the range of proportions across the 49 GTEx tissues. (C) Distribution of distance between the eVariant and the gene’s transcription start site for the top eQTL for each gene in each tissue. The plot is truncated at 200kb for visibility, but the maximum outlier value was 1Mb. Gene group differences were significant (p <0.05/15, Wilcoxon test) between each lncRNA group and the protein-coding genes and the expression-matched coding genes, but not between lncRNA gene groups. (D)Absolute effect size of the top eQTL for each gene in each tissue. Effect size was measured as log2(allelic fold-change). The dashed line separates the main comparison gene groups from the lncRNA gene types. Gene group differences were significant (p <0.05/23, Wilcoxon test) between all main gene groups (left of dashed line) except for expression-matched protein-coding genes vs. total lncRNA genes. Between lncRNA gene types, all differences were significant except for antisense vs. sense intronic and other lncRNAs, sense intronic vs. other lncRNAs, and processed transcript vs. sense overlapping and other lncRNAs. (E) Summary of the π1 replication values between GTEx lncRNA gene eQTLs and other QTL studies. (F) Proportion of each gene group that was an eGene in a certain number of tissues. Bar labels show the number of genes. (G) The number of tissues expressing protein-coding genes (left) and lncRNA genes (right) at a threshold of ≥0.1 TPM in >20% of samples, compared to the subset of tissue-specific eGenes. Note the y-axis is on log scale. For all boxplots, data represented are medians with first and third quartiles as boxes, and whiskers extending to 1.5 times the interquartile range. See also Figure S1, Tables S1–S2.
Figure 2.
Figure 2.
Co-expression networks annotate cellular contexts of lncRNA genes. (A) Summary of gene assignment to modules by gene group. The underlying boxplot shows the proportion of a gene group falling into that module status across tissues. Outlier point color indicates the tissue. (B) Proportion of lncRNA genes in modules across all tissues, binned by module size. “uncl.” = unclustered genes. (C) lncRNA genes with high confidence annotations in brain tissues, based on agreement of WGCNA annotations and correlation with CIBERSORTx estimated cell type proportions. The correlation coefficient is the median correlation across all relevant brain tissues between the estimated proportion of that cell type, and the lncRNA gene’s expression. The bar fill indicates the number of brain tissues in which the lncRNA gene’s expression level was significantly correlated with the estimated cell type proportion. (D) Proportion of gene groups binned by intra-modular connectivity (kin) ranking. The most highly connected genes within their module are in the first kin rank decile, and the least connected genes within their module are in the tenth kin rank decile. (E) Module annotations of genes in the top kin rank decile of their modules. The bottom panel shows the proportion of these highly-connected genes in each annotation group. The top panel shows the number of tissues in which a module is assigned that annotation term. In some cases, the association of many highly connected genes with a certain annotation term may reflect how common that module is across tissues: for example, there is at least one “mitochondria” module in all 49 tissues, which may result in the same hub genes for mitochondria being counted multiple times. For all boxplots, data represented are medians with first and third quartiles as boxes, and whiskers extending to 1.5 times the interquartile range. See also Figures S2–S3, Data S1, Table S3.
Figure 3.
Figure 3.
Patterns in allele-specific expression (ASE) associated with lncRNA gene eQTLs. (A) Scheme for calculating gene-level and neighbor gene-level ASE scores. aFC = allelic fold-change. (B) ASE-sharing results for genes, grouped by gene type. Odds ratios (OR) were calculated for the lncRNA gene types relative to the protein-coding genes, with the background being total genes with ASE results. “High ASE” = mean gene Z score >3; “High ASE-sharing” = mean gene Z score >3 and mean neighbor Z score >3. (C) Genome-wide distribution of high ASE-sharing genes. A dot’s horizontal position is its mean neighbor Z score, with a further left dot having a higher Z score and the blue horizontal line marking the Z=3 threshold. The grey shading illustrates stretches of the genome where, starting from a given gene with high ASE, at least one other gene within 500kb also has high ASE. See also Table S4.
Figure 4.
Figure 4.
Rare variation impacts intergenic lncRNA gene expression and complex traits. (A) Percent of multi-tissue intergenic lncRNA gene outliers out of all gene-individual combinations tested. Labels indicate the number of outliers. (B) Enrichment of variants within 10kb of the outlier gene in outlier individuals. Dots represent relative risk point estimate, with bars showing the 95% confidence intervals. (C) Enrichment of rare variants (MAF <1%) within 10 kb of the outlier gene in outlier individuals. Left panel: the enrichment of rare variants in intergenic lncRNA outliers relative to non-outliers. Right panel: the enrichment values from the left relative to those same enrichment values for expression-matched protein-coding genes. Data are represented as in (B). (D) The mean effect size in the UK Biobank GWAS for body-mass index of rare variants associated with intergenic lncRNA gene expression outlier events, compared to matched rare variants associated with non-outlier events. The heightened GWAS effect size of outlier-associated variants increases with gene expression outlier Z score (figure panels). * indicates p-value <0.05, Wilcoxon test. The boxplot represents medians with first and third quartiles as boxes, and whiskers extending to 1.5 times the interquartile range. lincRNA: intergenic lncRNA, TSS: transcription splice site, TE: transposable element insertion, BND: breakend, DEL: deletion, CNV: copy number variation, DUP: duplication, INV: inversion. See also Figure S4, Table S5.
Figure 5.
Figure 5.
GWAS-QTL colocalization identifies trait-associated lncRNA genes. (A) Contribution of each gene type to significant colocalization events, collapsed across tissues (feature-GWAS combinations). GWAS were grouped on the y-axis by general trait categories. For each trait category, the top bar shows eQTL colocalizations and the bottom bar shows sQTL colocalizations. If a bar is missing from the plot, there were no colocalizations for that given trait category and QTL type. The numbers to the right of each bar are the total number of significant colocalization events (E: eQTL, S: sQTL). (B) Number of significant colocalization events collapsed across tissues (feature-GWAS combinations) for each approach. (C) Significant lncRNA colocalization events (feature-GWAS-tissue combinations) grouped by the colocalization status of protein-coding genes in the surrounding 1Mb range. (D) Enrichment of variant annotation categories in the 95% credible sets of all significant lncRNA colocalization events discovered by FINEMAP. Enrichment was calculated relative to all GTEx variants that were not within the credible set and were within 400kb of an annotated gene. Dots represent relative risk point estimate, with bars showing the 95% confidence intervals. See also Figure S5, Table S6.
Figure 6.
Figure 6.
Exemplar significant colocalization of LINC01475 and RP11–129J12.1 with ulcerative colitis. (A) Location of the lncRNA genes, the nearby protein-coding gene NKX2–3. Relevant variants are labeled, including the most significant ulcerative colitis GWAS variant, and the top eQTL for both lncRNA genes in the transverse colon, and the 95% credible sets for the FINEMAP colocalizations in spleen and colon tissues involving a RP11–129J12.1 eQTL (triangles), a LINC01475 sQTL (circles), and a LINC01475 eQTL (squares). (B) Summary of colocalization scores for ulcerative colitis for the lncRNA genes and genes in the surrounding 1Mb; 14 genes had no score in any tissue, and are not shown. The thresholds for significant colocalization are indicated by the blue dashed line (Methods). (C) Scaled intramodular connectivity (kin) of LINC01475, RP11–129J12.1, and NKX2–3 within their assigned modules in the gene co-expression networks for spleen, transverse colon, and sigmoid colon. Module annotation and size is indicated in the top right corner of each panel. See also Table S6.

References

    1. Albert FW, and Kruglyak L. (2015). The role of regulatory variation in complex traits and disease. Nature Reviews Genetics 16, 197–212. - PubMed
    1. Allou L, Balzano S, Magg A, Quinodoz M, Royer-Bertrand B, Schöpflin R, Chan W-L, Speck-Martins CE, Carvalho DR, Farage L, et al. (2021). Non-coding deletions identify Maenli lncRNA as a limb-specific En1 regulator. Nature 1–6. - PubMed
    1. Amin V, Harris RA, Onuchic V, Jackson AR, Charnecki T, Paithankar S, Subramanian SL, Riehle K, Coarfa C, and Milosavljevic A. (2015). Epigenomic footprints across 111 reference epigenomes reveal tissue-specific epigenetic regulation of lincRNAs. Nat Commun 6, 1–10. - PMC - PubMed
    1. Ashburner M, Ball CA, Blake JA, Botstein D, Butler H, Cherry JM, Davis AP, Dolinski K, Dwight SS, Eppig JT, et al. (2000). Gene Ontology: tool for the unification of biology. Nat Genet 25, 25–29. - PMC - PubMed
    1. Auton A, Abecasis GR, Altshuler DM, Durbin RM, Abecasis GR, Bentley DR, Chakravarti A, Clark AG, Donnelly P, Eichler EE, et al. (2015). A global reference for human genetic variation. Nature 526, 68–74. - PMC - PubMed

Publication types

MeSH terms

Substances

LinkOut - more resources