. 2021 Jul:43:101963.
doi: 10.1016/j.redox.2021.101963. Epub 2021 Apr 1.

LRRc17 controls BMSC senescence via mitophagy and inhibits the therapeutic effect of BMSCs on ovariectomy-induced bone loss

Affiliations

LRRc17 controls BMSC senescence via mitophagy and inhibits the therapeutic effect of BMSCs on ovariectomy-induced bone loss

Fei Liu et al. Redox Biol. 2021 Jul.

Abstract

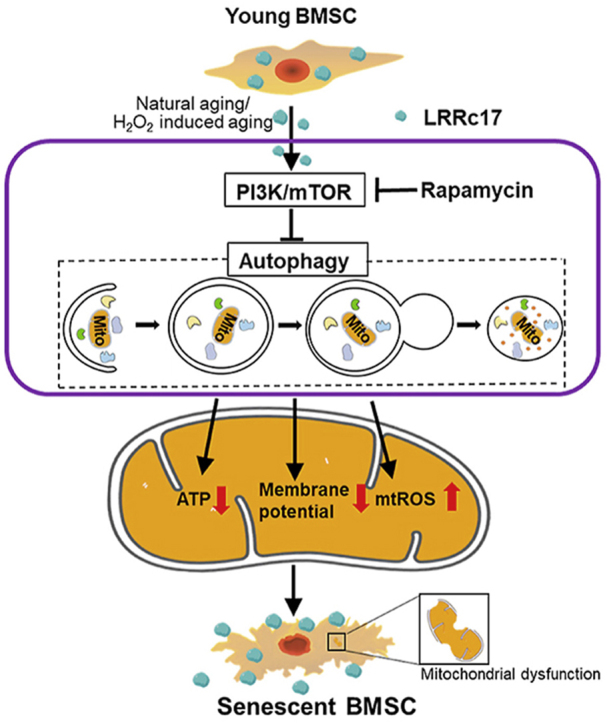
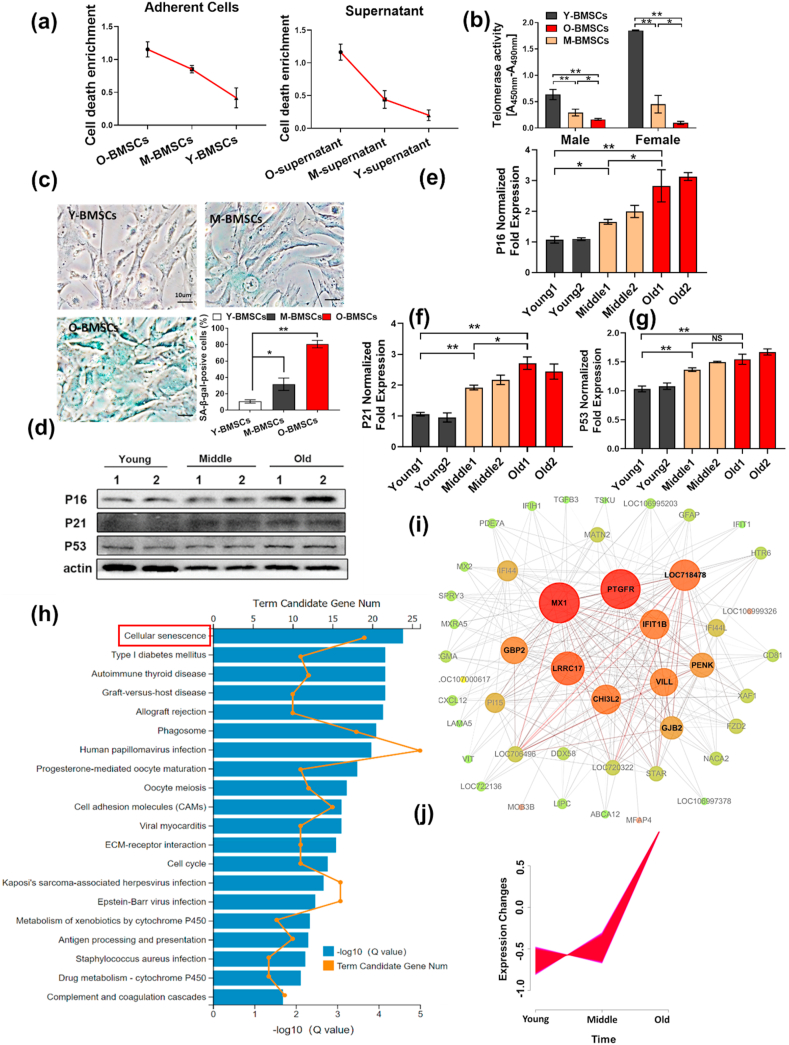
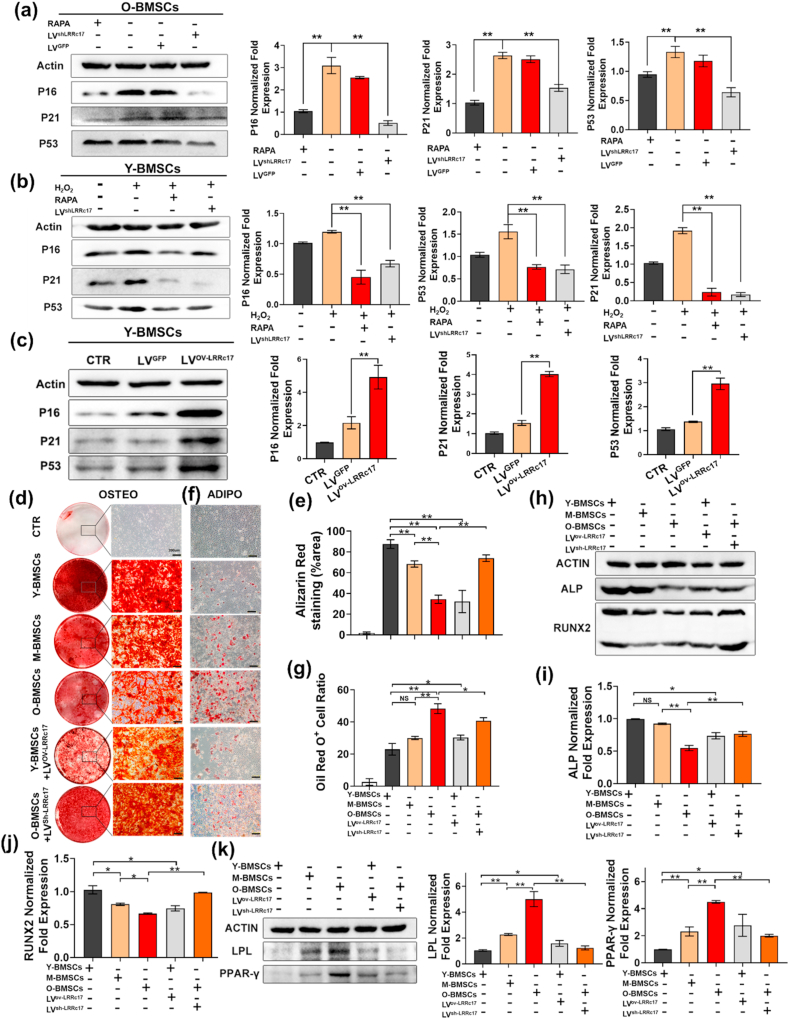
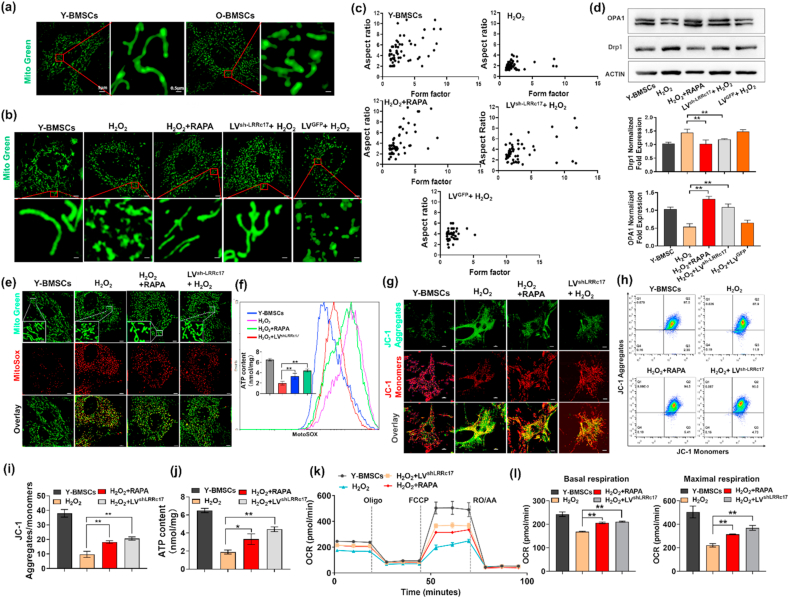
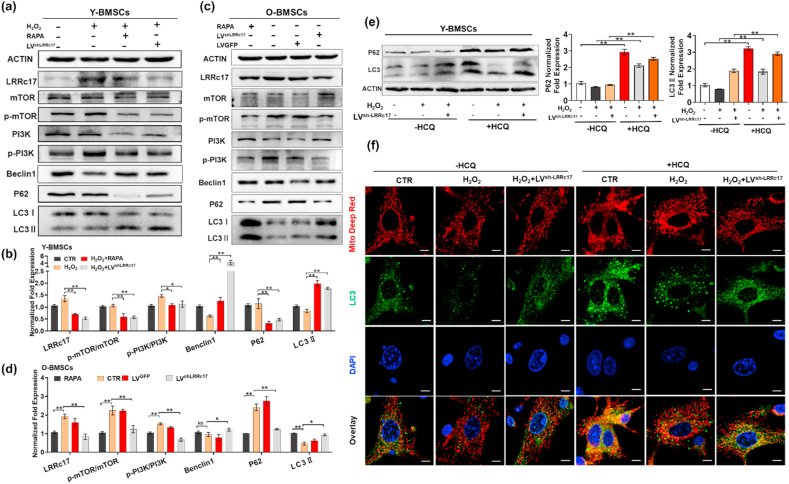
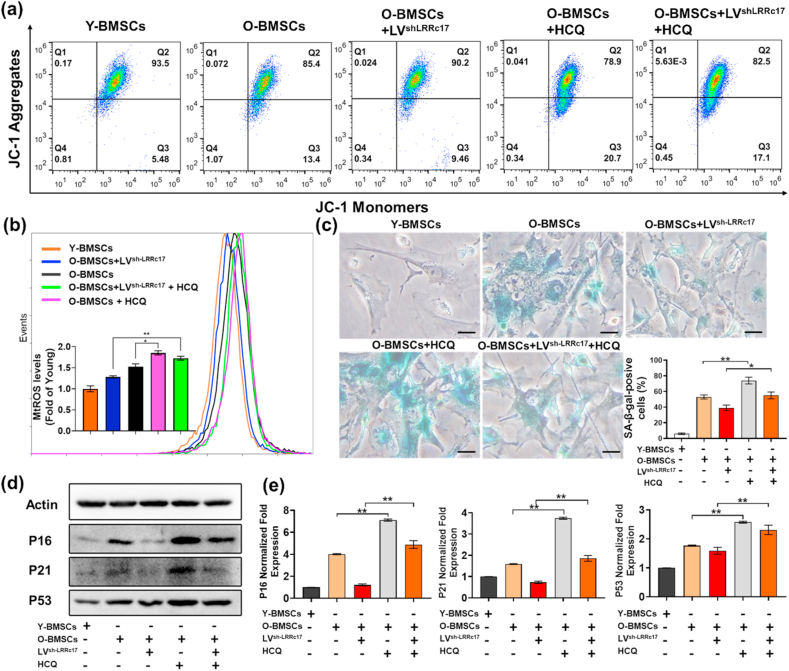
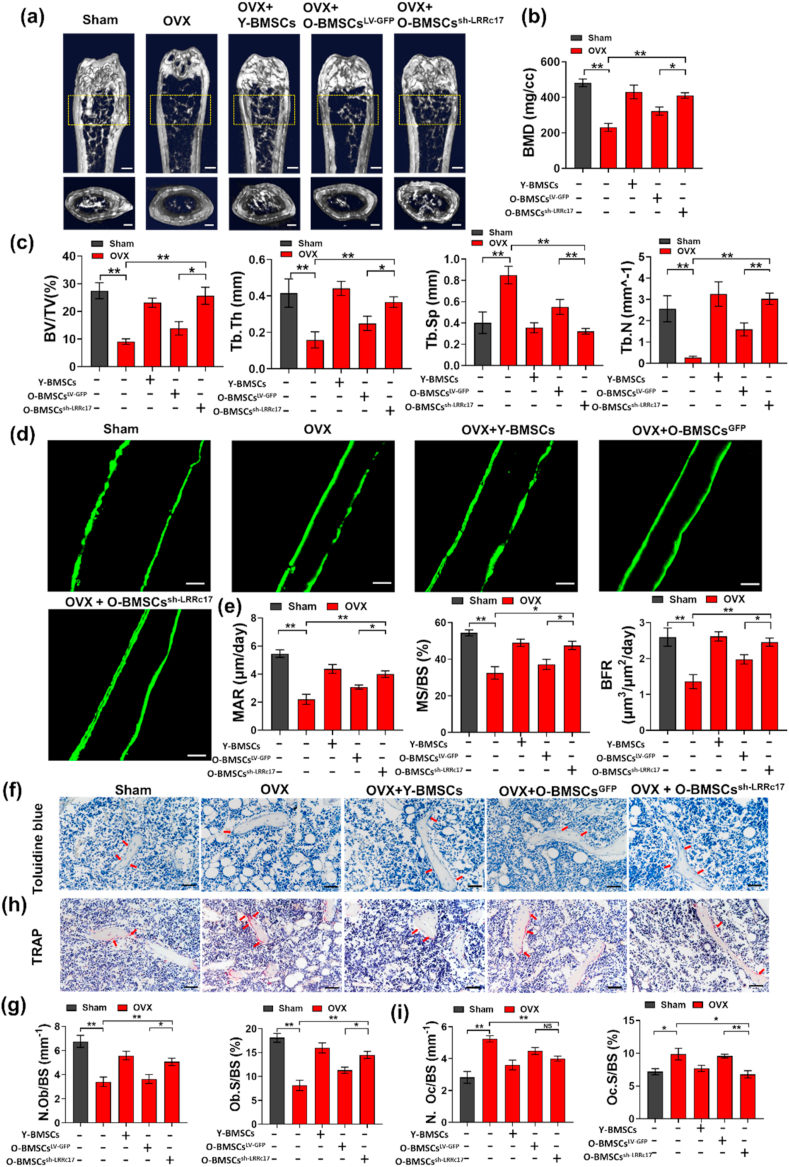
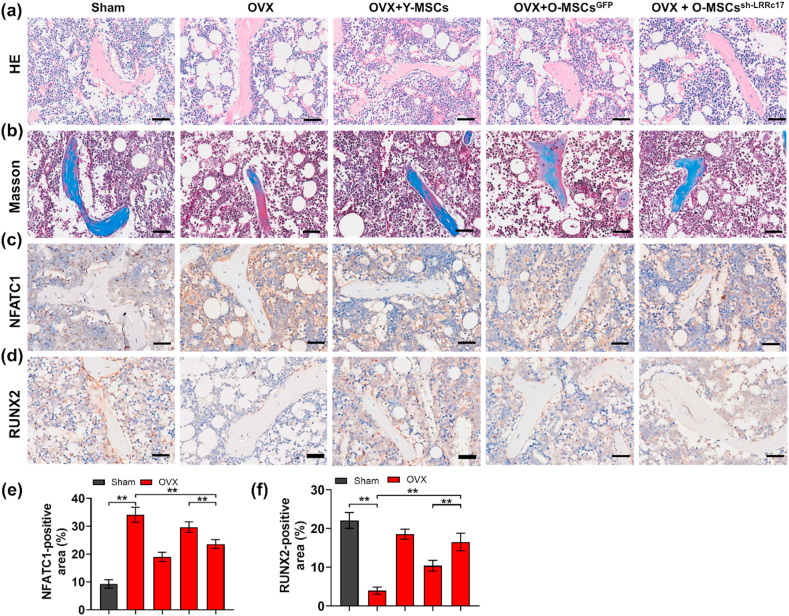
Senescence of bone marrow-derived mesenchymal stem cells (BMSCs) has been widely reported to be closely correlated with aging-related diseases, including osteoporosis (OP). Moreover, the beneficial functions of BMSCs decline with age, limiting their therapeutic efficacy in OP. In the present study, using RNA sequencing (RNA-Seq), we found that leucine-rich repeat containing 17 (LRRc17) expression in BMSCs was highly positively correlated with age. Therefore, we investigated whether LRRc17 knockdown could rejuvenate aged MSCs and increase their therapeutic efficacy in OP. Consistent with the RNA-Seq results, the protein expression of LRRc17 in senescent BMSCs was significantly increased, whereas LRRc17 knockdown inhibited cell apoptosis and reduced the expression of age-related proteins and G2 and S phase quiescence. Furthermore, LRRc17 knockdown shifted BMSCs from adipogenic to osteogenic differentiation, indicating the critical role of LRRc17 in BMSC senescence and differentiation. Additionally, similar to rapamycin (RAPA) treatment, LRRc17 knockdown activated mitophagy via inhibition of the mTOR/PI3K pathway, which consequently reduced mitochondrial dysfunction and inhibited BMSC senescence. However, the effects of LRRc17 knockdown were significantly blocked by the autophagy inhibitor hydroxychloroquine (HCQ), demonstrating that LRRc17 knockdown prevented BMSC senescence by activating mitophagy. In vivo, compared with untransfected aged mouse-derived BMSCs (O-BMSCs), O-BMSCs transfected with sh-LRRc17 showed effective amelioration of ovariectomy (OVX)-induced bone loss. Collectively, these results indicated that LRRc17 knockdown rejuvenated senescent BMSCs and thus enhanced their therapeutic efficacy in OP by activating autophagy.

Keywords: Aging; BMSCs; LRRc17; Mitophagy; Osteoporosis.


Conflict of interest statement

The authors declare no potential conflicts of interest.

Figures

Image 1
Graphical abstract
Fig. 1
Fig. 1
Senescent BMSCs show high expression of LRRc17. BMSCs were separately isolated from young, middle-aged and aged mice and then cultured to passage 3. (a) A photometric enzyme immunoassay was performed to assess the BMSC death ratio via quantitative assessment of cytoplasmic histone-associated DNA fragments (n = 3). (b) Telomerase activity was determined with a commercial TeloTAGGG Telomerase PCR ELISA kit (n = 3). (c) Quantitative analysis of SA-β-gal-positive BMSCs. Five fields from each section were randomly selected to calculate the positive SA-β-gal cell ratio (n = 3). Scale bar, 10 μm. (d–g) BMSCs were lysed and prepared to measure the expression levels of p16, p21 and p53 by Western blotting (n = 3). Aged, middle-aged, and young BMSCs were subjected to RNA-seq, and differentially expressed genes were enriched and subjected to (h) KEGG pathway enrichment analysis, (i) weighted gene coexpression network analysis (WGCNA), (j) and time course analysis (n = 3). All data are shown as the mean ± SD. **P < 0.01, *P < 0.05; NS: not significant (P > 0.05).
Fig. 2
Fig. 2
Silencing LRRc17 alleviates BMSC senescence and alters differentiation potential. O-BMSCs at passage 3 were treated with 100 nM RAPA, followed by transfection of LVsh-LRRc17 or LVGFP for 72 h. (a) Quantitative analysis of the protein expression levels of p16, p21, and p53 in 4 different groups (O-BMSCs, RAPA-treated O-BMSCs, LVsh-LRRc17-transfected O-BMSCs, and LVGFP-transfected O-BMSCs) by Western blotting (n = 3). Senescence was induced in Y-BMSCs at passage 3 with 400 μM H2O2, followed by treatment with 100 nM RAPA or lentivirus transfection for 72 h. (b) Quantitative analysis of the levels of p16, p21, and p53 in 4 different groups (Y-BMSCs, H2O2-treated young BMSCs, H2O2- and RAPA-treated young BMSCs, H2O2- and LVsh-LRRc17-transfected young BMSCs) by Western blotting (n = 3). (c) Quantitative analysis of the protein levels of p16, p21, and p53 in 3 different groups (Y-BMSCs, LVGFP-transfected Y-BMSCs, and LVov-LRRc17-transfected Y-BMSCs) by Western blotting (n = 3). Young, middle-aged, old, youngov-LRRc17, and oldsh-LRRc17 BMSCs at passage 3 were subjected to osteogenic and adipogenic induction. (d, e) BMSCs (3 × 105) were subjected to osteogenic induction for 14 d, and the mineralized nodules were quantified by calculating the ratio of red mineralization area to total area after alizarin red staining (n = 3). Scale bar, 200 μm. (f, g) BMSCs (3 × 105) were subjected to adipogenic induction for 21 days. Then, lipid droplets were quantified by calculating the ratio of red lipid droplet area to total area after Oil Red O staining (n = 3). Scale bar, 200 μm. (h, i, j) The expression levels of ALP and RUNX2 were detected by Western blotting after osteogenic induction (n = 3). (k) The expression levels of PPAR-γ and LPL were detected and quantified by Western blotting after adipogenic induction. β-Actin was used as an internal control (n = 3). All data are shown as the mean ± SD. **P < 0.01, *P < 0.05; NS, not significant (P > 0.05). (For interpretation of the references to colour in this figure legend, the reader is referred to the Web version of this article.)
Fig. 3
Fig. 3
Knockdown of LRRc17 reverses mitochondrial dysfunction in senescent BMSCs. (a) Representative images of MitoTracker Green fluorescence in BMSCs from young and aged mouse BMSCs. (b) Representative images of Y-BMSCs with different treatments visualized with MitoTracker Green staining. The groups are described in Fig. 2b. (c) Computer-assisted morphometric analyses of mitochondrial morphology (n = 3). (d) Western blotting analysis with quantification of Drp1 and OPA1 proteins in BMSCs (n = 3). (e) Morphology and mtROS of BMSCs were detected with MitoSOX (red) and MitoTracker (green), respectively. Scale bar, 5 μm. (f) mtROS staining was conducted with MitoSOX Red and is shown as the relative mean fluorescence intensity as measured by flow cytometry (n = 3). (g) Detection of JC-1 aggregates (red) and monomers (green) in BMSCs by confocal fluorescence microscopy. Scale bar, 10 μm. (h, i) Flow cytometry assessment of mitochondrial membrane potential (aggregate fluorescence/monomer fluorescence) of BMSCs (n = 3). (j) Quantification of ATP content by microplate reader (n = 3). (k, l) BMSCs were harvested and seeded in a Seahorse × 24 microplate. OCR was detected with a Cell Mito Stress Test Kit, and basal respiration and maximal respiration were analyzed with Wave Software (n = 3). All data are shown as the mean ± SD. **P < 0.01, *P < 0.05; NS, not significant (P > 0.05). (For interpretation of the references to colour in this figure legend, the reader is referred to the Web version of this article.)
Fig. 4
Fig. 4
LRRc17 knockdown maintains autophagic flux and mitophagy via mTOR/PI3K inhibition in senescent BMSCs. (a, b) Western blot analysis and quantification of the expression of LRRc17, p-mTOR/mTOR, p-PI3K/PI3K, Beclin1, P62, and LC3Ⅱ in 4 different groups as described in Fig. 2b (n = 3). (c, d) Western blot analysis and quantification of the protein levels of LRRc17, mTOR, p-mTOR, PI3K, p-PI3K, Beclin1, P62, and LC3Ⅱ in the 4 different groups as described in Fig. 2a (n = 3). Y-BMSCs were treated with H2O2 or transfected with LVsh-LRRc17 for 72 h, followed by treatment with 10 μM HCQ for 8 h before cells were collected and lysed for Western blotting. (e) Representative images and quantitative analysis of the Western blotting results for P62 and LC3B in BMSCs. β-Actin was used as an internal control (n = 3). (f) Colocalization of LC3B (green) and mitochondria (red) was assessed to evaluate mitophagy in the different groups, and nuclear fluorescence was visualized with DAPI staining (blue) (n = 3). Scale bar, 5 μm. All data are shown as the mean ± SD. **P < 0.01, *P < 0.05; NS, not significant (P > 0.05). (For interpretation of the references to colour in this figure legend, the reader is referred to the Web version of this article.)
Fig. 5
Fig. 5
LRRc17 downregulation prevents H2O2-induced BMSC senescence by enhancing mitophagy. O-BMSCs transfected with LVsh-LRRc17 were treated with 10 μM HCQ for 24 h before the experiment, and young BMSCs were used as a control group. (a) The mitochondrial membrane potential of BMSCs was detected by measuring JC-1 fluorescence with flow cytometry (n = 3). (b) mtROS were stained with MitoSOX Red and are shown as the relative mean fluorescence intensity as measured by flow cytometry (n = 3). (c) Quantitative analysis of SA-β-gal-positive cells. Five fields from each section were randomly selected to calculate the positive SA-β-gal cell ratio (n = 3). Scale bar, 10 μm. (d) Western blotting results for p16, p21 and p53 expression in BMSCs. β-Actin was used as an internal control. (e) The bar charts show the quantitative results of the indicated proteins (n = 3). All data are shown as the mean ± SD. **P < 0.01, *P < 0.05; NS, not significant (P > 0.05). (For interpretation of the references to colour in this figure legend, the reader is referred to the Web version of this article.)
Fig. 6
Fig. 6
Transplantation of O-BMSCs transfected with sh-LRRc17 alleviates the osteoporotic phenotype and reverses bone loss in OVX mice. Five groups of mice were sacrificed 1 month after BMSC transplantation (n = 7 per group). (a) Representative micro-CT images of trabecular bone sections. Scale bars: 500 mm (top) and 100 mm (bottom). (b, c) Quantitative analysis of the corresponding parameters, including BMD, BV/TV, Tb.Th, Tb.Sp, and Tb.N. (d) Representative fluorescence images of double calcein labeling and (e) quantitative analysis of MAR, MS/BS, and BFR. Scale bar, 25 μm. (f) Representative images of OB staining with toluidine blue (red arrows). Scale bars, 50 μm. Quantitative analysis of (g) the number of osteoblasts per bone surface (N.Ob/BS) and osteoblast surface over bone surface (Ob.S/BS). (h) Representative images of OC staining with TRAP (red arrows). Scale bar, 50 μm. Quantitative analysis of (i) the number of osteoclasts per bone surface (N.Oc/BS) and osteoclast surface over bone surface (Oc.S/BS). All data are shown as the mean ± SD. **P < 0.01, *P < 0.05; NS, not significant (P > 0.05). (For interpretation of the references to colour in this figure legend, the reader is referred to the Web version of this article.)
Fig. 7
Fig. 7
LRRc17 knockdown of O-BMSCs improves the defect area in OVX mice. The histological assessment of the defect area by HE staining (a) and Masson staining (b). Images of immunohistochemical staining of osteoclast factor NFATc1 (c) and osteogenic factor RUNX2 (d). Scale bar, 50 μm. (e, f) The qutification of NFATc1 and RUNX2 in mice from different groups. All data were shown as mean ± SD. **P < 0.01, *P < 0.05.

References

    1. Hwang E.S. Senescence suppressors: their practical importance in replicative lifespan extension in stem cells. Cell. Mol. Life Sci. 2014;71:4207–4219. - PMC - PubMed
    1. Ramakrishnan A., Torok-Storb B., Pillai M.M. Primary marrow-derived stromal cells: isolation and manipulation. Methods Mol. Biol. 2013;1035:75–101. - PMC - PubMed
    1. Kiernan J., Hu S., Grynpas M.D., Davies J.E., Stanford W.L. Systemic mesenchymal stromal cell transplantation prevents functional bone loss in a mouse model of age-related osteoporosis. Stem Cells Transl Med. 2016;5:683–693. - PMC - PubMed
    1. Li Y., Wu Q., Wang Y., Li L., Bu H., Bao J. Senescence of mesenchymal stem cells (Review) Int. J. Mol. Med. 2017;39:775–782. - PubMed
    1. Ren X., Hu B., Song M., Ding Z., Dang Y., Liu Z. Maintenance of nucleolar homeostasis by CBX4 alleviates senescence and osteoarthritis. Cell Rep. 2019;26:3643–3656 e3647. - PubMed

Publication types

Substances

LinkOut - more resources