. 2021 Apr 17;21(1):222.
doi: 10.1186/s12935-021-01917-9.

Bioinformatic analysis identifying FGF1 gene as a new prognostic indicator in clear cell Renal Cell Carcinoma

Affiliations

Bioinformatic analysis identifying FGF1 gene as a new prognostic indicator in clear cell Renal Cell Carcinoma

Xiaoqin Zhang et al. Cancer Cell Int. .

Abstract

Background: Clear cell renal cell carcinoma (ccRCC) has been the commonest renal cell carcinoma (RCC). Although the disease classification, diagnosis and targeted therapy of RCC has been increasingly evolving attributing to the rapid development of current molecular pathology, the current clinical treatment situation is still challenging considering the comprehensive and progressively developing nature of malignant cancer. The study is to identify more potential responsible genes during the development of ccRCC using bioinformatic analysis, thus aiding more precise interpretation of the disease METHODS: Firstly, different cDNA expression profiles from Gene Expression Omnibus (GEO) online database were used to screen the abnormal differently expressed genes (DEGs) between ccRCC and normal renal tissues. Then, based on the protein-protein interaction network (PPI) of all DEGs, the module analysis was performed to scale down the potential genes, and further survival analysis assisted our proceeding to the next step for selecting a credible key gene. Thirdly, immunohistochemistry (IHC) and quantitative real-time PCR (QPCR) were conducted to validate the expression change of the key gene in ccRCC comparing to normal tissues, meanwhile the prognostic value was verified using TCGA clinical data. Lastly, the potential biological function of the gene and signaling mechanism of gene regulating ccRCC development was preliminary explored.

Results: Four cDNA expression profiles were picked from GEO database based on the number of containing sample cases, and a total of 192 DEGs, including 39 up-regulated and 153 down-regulated genes were shared in four profiles. Based on the DEGs PPI network, four function modules were identified highlighting a FGF1 gene involving PI3K-AKT signaling pathway which was shared in 3/4 modules. Further, both the IHC performed with ccRCC tissue microarray which contained 104 local samples and QPCR conducted using 30 different samples confirmed that FGF1 was aberrant lost in ccRCC. And Kaplan-Meier overall survival analysis revealed that FGF1 gene loss was related to worse ccRCC patients survival. Lastly, the pathological clinical features of FGF1 gene and the probable biological functions and signaling pathways it involved were analyzed using TCGA clinical data.

Conclusions: Using bioinformatic analysis, we revealed that FGF1 expression was aberrant lost in ccRCC which statistical significantly correlated with patients overall survival, and the gene's clinical features and potential biological functions were also explored. However, more detailed experiments and clinical trials are needed to support its potential drug-target role in clinical medical use.

Keywords: Clear cell renal cell carcinoma (ccRCC); FGF1 gene; GEO database; Molecular pathology; PI3K-AKT signaling pathway; Protein–protein interaction network (PPI).


Conflict of interest statement

All of the authors agreed the publication of the paper and declare no conflicts of interests.

Figures
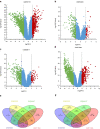
Fig. 1
Fig. 1
The DEGs screened from GEO expression profiles. Up-regulated (red-colored spots) and down-regulated (green-colored spots) DEGS in ccRCC comparing to normal renal tissues were screened from GEO profiles a GSE53000, b GSE53757, c GSE68417 and d GSE71963 respectively. e 39 up-regulated and f 153 down-regulated DEGs were shared in all four GEO expression profiles
Fig. 2
Fig. 2
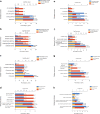
GO and KEGG analysis of DEGs in ccRCC. a The biological processes, b molecular functions, c cellular components and d biological pathways the up-regulated DEGS were mainly enriched in. e The biological processes, f molecular functions, g cellular components and h biological pathways the down-regulated DEGS were mostly focused on
Fig. 3
Fig. 3
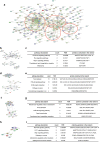
Genes’ function modules analysis based on DEGs’ PPI network. a The PPI network of 192 DEGs and four main function modules analyzed based on the network (four red circles and each represents one gene module). b, d, f, h The diagrammatic sketch and c, e, g, i containing main signaling pathways as well as involving genes of four main modules in the PPI network. (* The FGF1 gene involved PI3K-AKT signaling pathway was revealed in 3/4 modules.)
Fig. 4
Fig. 4
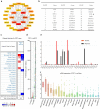
Aberrant FGF1 loss of expression in ccRCC comparing to normal renal tissues. a Top 30 genes in the PPI network with high connectivity with surrounding genes (higher color represents stronger connectivity). b The top 30 genes in the PPI network with high connectivity with surrounding genes listed in descending order. (* FGF1 gene is 23rd of the 30 top genes). c Expression of FGF1 in different types of human cancers revealed by Oncomine analysis. Different colored squares indicated the numbers of datasets with FGF1 mRNA over-expressed (red) or down-expressed (blue) in cancer vs. normal tissue. d Aberrant loss of expression of FGF1 in ccRCC comparing to normal renal tissues revealed by GEPIA analysis. e Expression of FGF1 in different types of human cancers by GEPIA analysis (*FGF1 expression in KIRC which is short kidney renal clear cell carcinoma, another name of ccRCC). f Expression of FGF1 in different cancer cell lines
Fig. 5
Fig. 5
Expression level of FGF1 in ccRCC verses normal kidney tissues revealed by local hospital samples experiments. a Overall survival analysis of FGF1 in ccRCC by Kaplan–Meier survival analysis. b Recurrence free survival analysis of FGF1 in ccRCC by Kaplan–Meier survival analysis. c FGF1 expression in ccRCC comparing to normal kidney tissues revealed by GEPIA analysis. d FGF1 expression in ccRCC comparing to normal kidney tissues revealed by QPCR experiment using 30 cases of local hospital patients samples. f 104 Local hospitalized ccRCC cancer samples were made into tissue arrays (as the left line graphics). The relative expression of FGF1 is qualified in ccRCC (the upper two graphics in the right) comparing to normal renal tissues (the lower two graphics in the right) by IHC experiment using ccRCC tissue microarrays
Fig. 6
Fig. 6
The association between FGF1 expression and ccRCC clinical parameters. a Relative FGF1 expression in ccRCC versus normal renal tissues. And the association between FGF1 expression and ccRCC b patients age, c gender, d race, e tumor grade, f lymph node metastasis and g tumor stage. (*p < 0.05, **p < 0.01, ***p < 0.001. The first layer * which is right above the error bar representing comparison to normal group, and the above layers * which were above a secondary line represent the comparison between corresponding groups that were covered by the line). h The hydrophilcity/hydrophobicity analysis of FGF1 protein. i FGF1 centered PPI network representing the genes that were mostly related to FGF1

References

    1. Siegel RL, Miller KD, Jemal A. Cancer statistics, 2020. Cancer J Clin. 2020;70(1):7–30. doi: 10.3322/caac.21590. - DOI - PubMed
    1. Warren AY, Harrison D. WHO/ISUP classification, grading and pathological staging of renal cell carcinoma: standards and controversies. World J Urol. 2018;36(12):1913–1926. doi: 10.1007/s00345-018-2447-8. - DOI - PMC - PubMed
    1. Wu J, Xu WH, Wei Y, Qu YY, Zhang HL, Ye DW. An Integrated score and Nomogram combining clinical and immunohistochemistry factors to predict high ISUP grade clear cell renal cell carcinoma. Front Oncol. 2018;8:634. doi: 10.3389/fonc.2018.00634. - DOI - PMC - PubMed
    1. Williamson SR, Gill AJ, Argani P, Chen YB, Egevad L, Kristiansen G, Grignon DJ, Hes O. Report from the International Society of Urological Pathology (ISUP) Consultation Conference on Molecular Pathology of Urogenital Cancers: III: Molecular Pathology of Kidney Cancer. Am J Surg Pathol. 2020;44(7):e47–e65. doi: 10.1097/PAS.0000000000001476. - DOI - PMC - PubMed
    1. Stone L. Kidney cancer: activation of oncogenes driven by VHL loss in ccRCC. Nat Rev Urol. 2017;14(11):637. doi: 10.1038/nrurol.2017.162. - DOI - PubMed

LinkOut - more resources