. 2021 Aug;127(2):236-244.
doi: 10.1016/j.bja.2021.02.028. Epub 2021 Apr 15.

Relationships between preoperative cortical thickness, postoperative electroencephalogram slowing, and postoperative delirium

Affiliations

Relationships between preoperative cortical thickness, postoperative electroencephalogram slowing, and postoperative delirium

Marissa F White et al. Br J Anaesth. 2021 Aug.

Abstract

Background: It is unclear how preoperative neurodegeneration and postoperative changes in EEG delta power relate to postoperative delirium severity. We sought to understand the relative relationships between neurodegeneration and delta power as predictors of delirium severity.

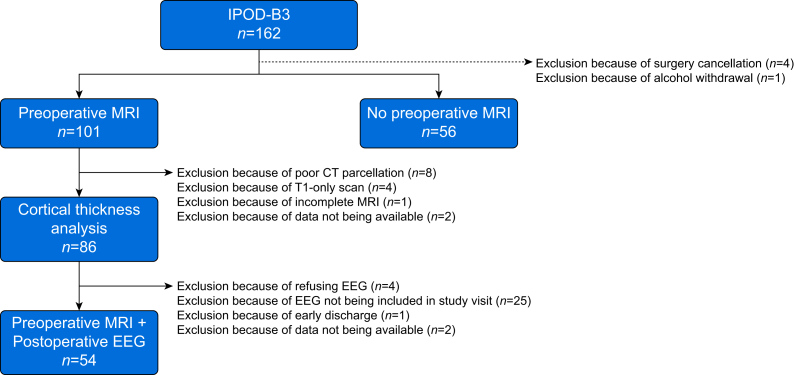
Methods: We undertook a prospective cohort study of high-risk surgical patients (>65 yr old) to identify predictors of peak delirium severity (Delirium Rating Scale-98) with twice-daily delirium assessments (NCT03124303). Participants (n=86) underwent preoperative MRI; 54 had both an MRI and a postoperative EEG. Cortical thickness was calculated from the MRI and delta power from the EEG.

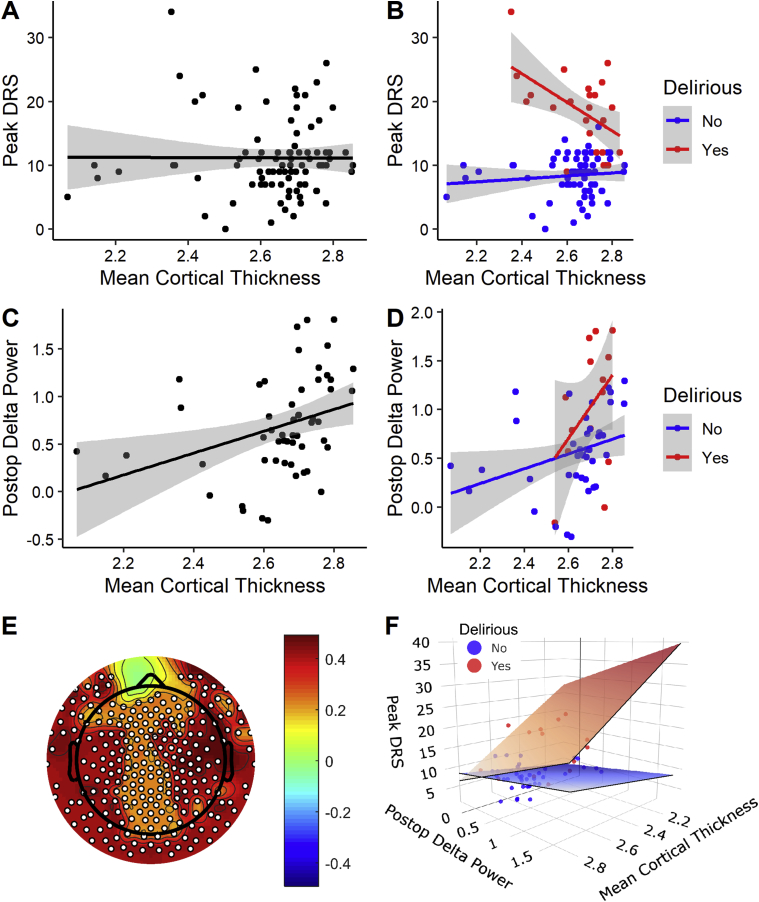
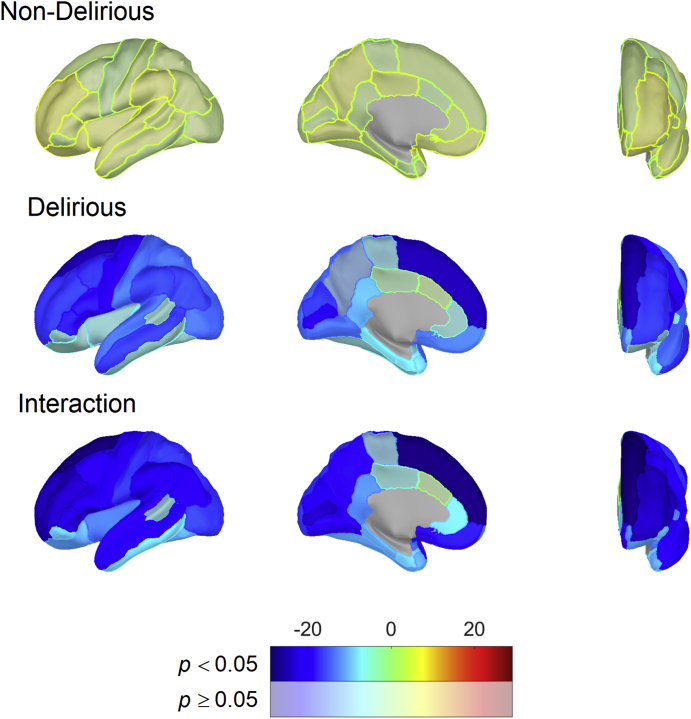
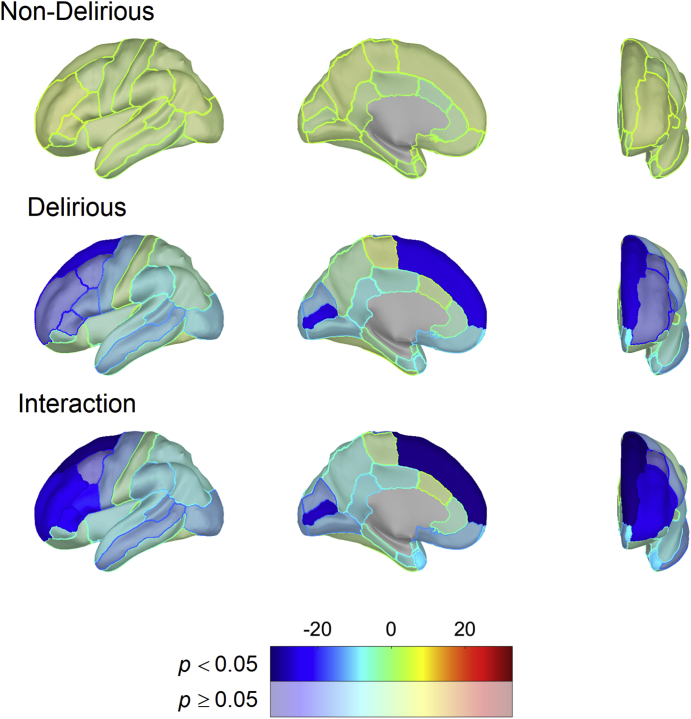
Results: In a linear regression model, the interaction between delirium status and preoperative mean cortical thickness (suggesting neurodegeneration) across the entire cortex was a significant predictor of delirium severity (P<0.001) when adjusting for age, sex, and performance on preoperative Trail Making Test B. Next, we included postoperative delta power and repeated the analysis (n=54). Again, the interaction between mean cortical thickness and delirium was associated with delirium severity (P=0.028), as was postoperative delta power (P<0.001). When analysed across the Desikan-Killiany-Tourville atlas, thickness in multiple individual cortical regions was also associated with delirium severity.

Conclusions: Preoperative cortical thickness and postoperative EEG delta power are both associated with postoperative delirium severity. These findings might reflect different underlying processes or mechanisms.

Clinical trial registration: NCT03124303.

Keywords: cortical slowing; cortical thickness; delirium; neurodegeneration; surgery.


Figures

Fig 1
Fig 1
Strengthening the Reporting of Observational studies in Epidemiology diagram for the Interventions for Postoperative Delirium: Biomarker-3 (IPOD-B3), registered with ClinicalTrials.gov (NCT 03124303). The diagram shows exclusions based on surgery cancellations, outlier analysis, poor cortical thickness parcellation, T1-only scans, incomplete scans or unavailable scans, refusal of EEG, EEG not included in the study at the time of visit, early discharge, or unavailable data.
Fig 2
Fig 2
Descriptive univariate correlations between imaging and EEG variables and delirium severity. (a) Across the whole cohort, there is no correlation between delirium severity (peak DRS) and mean cortical thickness (n=86). (b) When divided by delirium status, a significant negative correlation is noted between delirium severity (peak DRS) and mean cortical thickness (n=86). (c) Postoperative delta power correlates with mean cortical thickness in the MRI+EEG cohort (n=54) with (d) similar relationships evident in PD and PND (n=54). (e) Topographic plot showing the scalp-based correlations of postoperative delta power and mean cortical thickness. Across the MRI+EEG cohort, postoperative delta power correlates with mean cortical thickness across the entire scalp using threshold-free cluster enhancement for multiple comparison across electrodes. White dot signifies a significant electrode. (f) Data from panels (b) and (d) were plotted in three dimensions to give an index of the influence of the different parameters. To orient the reader to the 3D space, the edges of the regression planes in panel (f) nearest the reader have been outlined in black, whereas the edges receding into the page have been left plain. DRS, Delirium Severity Rating Scale-98; PD, patients who developed delirium; PND, patients who did not develop delirium.
Fig 3
Fig 3
Hemispheric plots showing regional associations between cortical thickness and delirium severity based on linear model results in the whole cohort (n=86). Colours indicate model effect-size estimates (beta values) and are masked by statistical significance with significant results (FDR corrected for multiple comparisons) being opaque. Significant results for PD and PND groups indicate an association between DRS and each ROI that is different from zero. Significant interaction results indicate non-zero differences in effect size between PD and PND. DRS, Delirium Severity Rating Scale-98; FDR, false discovery rate; PD, patients who developed delirium; PND, patients who did not develop delirium; ROI, region of interest.
Fig 4
Fig 4
Hemispheric plots showing regional associations between cortical thickness and delirium severity based on linear model results in the MRI+EEG cohort (n=54). Colours indicate model effect-size estimates (beta values) and are masked by statistical significance with significant results (FDR corrected for multiple comparisons) being opaque. Significant results for PD and PND groups indicate an association between DRS and each ROI that is different from zero. Significant interaction results indicate non-zero differences in effect size between PD and PND. DRS, Delirium Severity Rating Scale-98; FDR, false discovery rate; PD, patients who developed delirium; PND, patients who did not develop delirium; ROI, region of interest.

References

    1. Inouye S.K., Westendorp R.G., Saczynski J.S. Delirium in elderly people. Lancet. 2014;383:911–922. - PMC - PubMed
    1. Inouye S.K., Marcantonio E.R., Kosar C.M. The short-term and long-term relationship between delirium and cognitive trajectory in older surgical patients. Alzheimers Dement. 2016;12:766–775. - PMC - PubMed
    1. Witlox J., Eurelings L.S., de Jonghe J.F., Kalisvaart K.J., Eikelenboom P., van Gool W.A. Delirium in elderly patients and the risk of postdischarge mortality, institutionalization, and dementia: a meta-analysis. JAMA. 2010;304:443–451. - PubMed
    1. Sanders R.D., Pandharipande P.P., Davidson A.J., Ma D., Maze M. Anticipating and managing postoperative delirium and cognitive decline in adults. BMJ. 2011;343:d4331. - PubMed
    1. Jack C.R., Jr., Bennett D.A., Blennow K. NIA-AA research framework: toward a biological definition of Alzheimer’s disease. Alzheimers Dement. 2018;14:535–562. - PMC - PubMed

Publication types

Associated data