. 2021 Jul 29;31(9):4206-4219.
doi: 10.1093/cercor/bhab079.

Primate Spatial Memory Cells Become Tuned Early and Lose Tuning at Cell-Specific Times

Affiliations

Primate Spatial Memory Cells Become Tuned Early and Lose Tuning at Cell-Specific Times

Charalampos Papadimitriou et al. Cereb Cortex. .

Abstract

Working memory, the ability to maintain and transform information, is critical for cognition. Spatial working memory is particularly well studied. The premier model for spatial memory is the continuous attractor network, which posits that cells maintain constant activity over memory periods. Alternative models propose complex dynamics that result in a variety of cell activity time courses. We recorded from neurons in the frontal eye fields and dorsolateral prefrontal cortex of 2 macaques during long (5-15 s) memory periods. We found that memory cells turn on early after stimulus presentation, sustain activity for distinct and fixed lengths of time, then turn off and stay off for the remainder of the memory period. These dynamics are more complex than the dynamics of a canonical bump attractor network model (either decaying or nondecaying) but more constrained than the dynamics of fully heterogeneous memory models. We speculate that memory may be supported by multiple attractor networks working in parallel, with each network having its own characteristic mean turn-off time such that mnemonic resources are gradually freed up over time.

Keywords: frontal eye fields; macaque; prefrontal cortex; working memory.


Figures

Figure 1
Figure 1
Memory task and performance. (A) The task begins with 1.5 s of central fixation. A peripheral stimulus turns on for 300 ms and is then extinguished. Memory targets can appear anywhere along a circle with a radius of 12 and 15 deg for monkeys C and W, respectively. After a memory period of 5.1–15.6 s, the subject makes a saccadic response to the remembered location. To encourage the animals to fixate through a long delay, up to 4 mid-trial rewards were delivered during the memory period (see Materials and Methods). (B) Proportion of memory failures, that is, memory-guided saccades directed >80 degrees of arc from the target, divided by the number of trials in which fixation was maintained up until the go cue. Memory failures are plotted as a function of memory period length for each monkey (Monkey C—gray, Monkey W—black). (C) The mean angular error of saccadic responses as a function of memory period length, excluding memory failures. Error bars are standard error. (D) The mean Euclidean error of saccadic responses as a function of memory period length. Standard errors in (B) and (D) are smaller than the data points themselves. Trials with endpoints >80 deg from the target (memory failure trials) are excluded from (C) and (D). The sets of 3 data points in (BD) are not cumulative, but instead represent results from just the 5, 7.5, and 15-s trials, respectively.
Figure 2
Figure 2
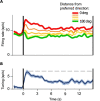
Tuning throughout the memory period for 93 memory cells. (A) Population neural activity when the memory targets were in the cells’ preferred directions (0 deg; red trace), null directions (180 deg; green trace), or at various points between (orange and yellow traces). (B) Memory tuning (difference between the red and green traces of A). Shading indicates the ±1 standard error of the mean.
Figure 3
Figure 3
(AE) Population activity as a function of memory target location at different times in the memory period (A, 0.5–1.5 s; B, 2–4 s; C, 3–5 s; D, 6–7.5 s; E, 12–15 s). Data points and their error bars indicate observed firing rate means and their standard errors, respectively. Blue lines depict von Mises fits to the data. Thin gray lines depict fits to the 0.5–1.5 s (early) data, for comparison. Red curves (CE) depict the tuning curve predicted from drift simulation. (F) Tuning amplitudes predicted from drift simulation (red) and amplitude actually observed (blue) at the end of delays for 5, 7.5, and 15 s. Amplitude is computed as the peak-to-trough difference of the von Mises fit to the data. Error bars indicate bootstrap 95% CIs. The difference between predicted and observed amplitude is significant (P < 0.05, 2-sided bootstrap test) for all 3 trial lengths.
Figure 4
Figure 4
Tuning properties of individual cells. (A) Distribution of mean turn-off times, that is, when cells trial-averaged tuning drop to 25% of its early memory magnitude. (B) Survival curve of mean turn-off times showing the percentage of cells that remain on (tuned) throughout the memory period. Of the 93 cells, 19 (20%) do not turn off even after 15 s of memory. (C) Firing rates from 5 example cells in individual 5 s (blue), 7.5 s (green), and 15 s (red) trials when the memory target was in the cell’s preferred direction. The black trace is the mean response. (D) Mean turn-off times estimated from 2 randomly selected subsets of trials for each cell are correlated (r = 0.41, P < 0.001). Each point represents data from one cell; data from all but the 19 persistent cells are included. The line represents a type II regression. (E) Correlation of mean turn-off time of trials in which the cell turned off versus the proportion of trials in which tuning persisted for the entire memory period (r = 0.57, P < 0.0001). Each point represents data from 1 cell; data from all 93 cells are included. The line represents a type II regression.
Figure 5
Figure 5
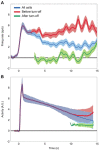
Tuning of cells conditioned on mean turn-off time. (A) Blue trace—tuning of the entire population of 93 cells. Red trace—tuning strength of cells with a mean turn-off time greater than current time (on cells). Green trace—tuning of cells with a mean turn-off time less than or equal to the current time (off cells). Note that the data in the red trace comprise progressively fewer cells with time (from 93 to 19), whereas the green trace comprises progressively more cells (from 9 to 74). (B) Tuning of 93 modeled bump attractor cells, of which 19 are sustained and 74 are nonsustained. Format as in (A).
Figure 6
Figure 6
Memory responses appear to turn on and off over the course of the memory period when driven suboptimally. Two example cells (A and B) with well-behaved sustained memory responses are shown. Top traces show the mean firing rate when memory targets are in the cell’s preferred direction, compared with 180 deg away (null direction). Bottom traces show the mean firing rate when the memory targets are at a flank 45 deg away from the preferred direction, compared with 180 deg away. Each cell exhibits sustained responses when driven optimally but fluctuates on and off when driven suboptimally.
Figure 7
Figure 7
Memory cells are indistinguishable from those seen in previous studies. (AD) Spike rasters and mean firing rate for 4 example cells in response to a target presented in the preferred (“red”) or null (“green”) directions. Data are shown over the first 3 s of memory to match or exceed the durations used in many previous studies. See Materials and Methods and Results for additional details and specific comparison studies. (EH) Time resolved ROC AUC values for the 4 example cells in (AD). AUC values are computed using a sliding 500-ms window. (I) Distribution of ROC AUC values for the 93 memory cells. ROC AUC values are computed from 0.5 to 1.5 or 2 to 4 s after the target first turns on, depending on when the cell first became tuned (see Materials and Methods). Hatching indicates sustained cells, that is, cells that did not turn off over the 15-s memory period (see Materials and Methods).
Figure 8
Figure 8
Properties of sustained cells. (A) Fitted probability density exponential distribution to mean turn-off times. The dark gray area represents cells that are not sustained, that is, cells with mean turn-off times prior to 15 s. The light gray area is the proportion of cells predicted to sustain activity for 15 s or more, based on the distribution of nonsustained cells. (B) Cumulative distribution of the function in (A). In total, 90% of the cells have mean turn-off times, indicating a prediction that 10% sampled cells should have mean turn-off times later than 15 s. Error bars show 95% CIs of the fit. (C) Anatomical distribution of sustained cells for Monkey C. Each gray closed circle represents a location in which one or more nonsustained memory cells were recorded. Black open circles indicate the locations of sustained cells, with double black lines when 2 cells were recorded at those coordinates. Dashed lines separate the region in and around the principle sulcus (bottom left), from the arcuate sulcus (top right). See Supplementary Figure S6. (D) Anatomical distribution of sustained cells for Monkey W. Format is identical to (C).
Figure 9
Figure 9
Cells with opposite early and late tuning. (A) Example cell with early tuning that is opposite in polarity from its late tuning. The highlighted time interval (yellow) is the first interval (300–700 ms) of significant tuning (−2.5 sp/s, P < 0.006). (B) Population activity of 15 cells, each of which shows significant early tuning that is opposite in polarity from its late tuning. Opposite tuning is generally driven by elevated activity for directions in the memory-interval null direction (an upward deflection of the green curve showing the response to a target in the null direction), rather than suppressed activity in the preferred direction (red trace). Population tuning in these cells shows little or no decay with time. (C) Population activity of cells that are not oppositely tuned in early versus late time periods. Formats in (B) and (C) are each identical to Figure 2.

References

    1. Amit DJ. 1992. Modeling brain function: the world of attractor neural networks. Cambridge: Cambridge University Press.
    1. Amit DJ, Brunel N. 1997. Model of global spontaneous activity and local structured activity during delay periods in the cerebral cortex. Cereb Cortex. 7:237–252. - PubMed
    1. Appeltant L, Soriano MC, Van der Sande G, Danckaert J, Massar S, Dambre J, Schrauwen B, Mirasso CR, Fischer I. 2011. Information processing using a single dynamical node as complex system. Nat Commun. 2:1–6. - PMC - PubMed
    1. Baeg E, Kim Y, Huh K, Mook-Jung I, Kim H, Jung M. 2003. Dynamics of population code for working memory in the prefrontal cortex. Neuron. 40:177–188. - PubMed
    1. Barak O, Sussillo D, Romo R, Tsodyks M, Abbott L. 2013. From fixed points to chaos: three models of delayed discrimination. Prog Neurobiol. 103:214–222. - PMC - PubMed

Publication types

LinkOut - more resources