. 2021 Apr 17;33(2):420-438.
doi: 10.1093/plcell/koaa020.

Transport-coupled ubiquitination of the borate transporter BOR1 for its boron-dependent degradation

Affiliations

Transport-coupled ubiquitination of the borate transporter BOR1 for its boron-dependent degradation

Akira Yoshinari et al. Plant Cell. .

Abstract

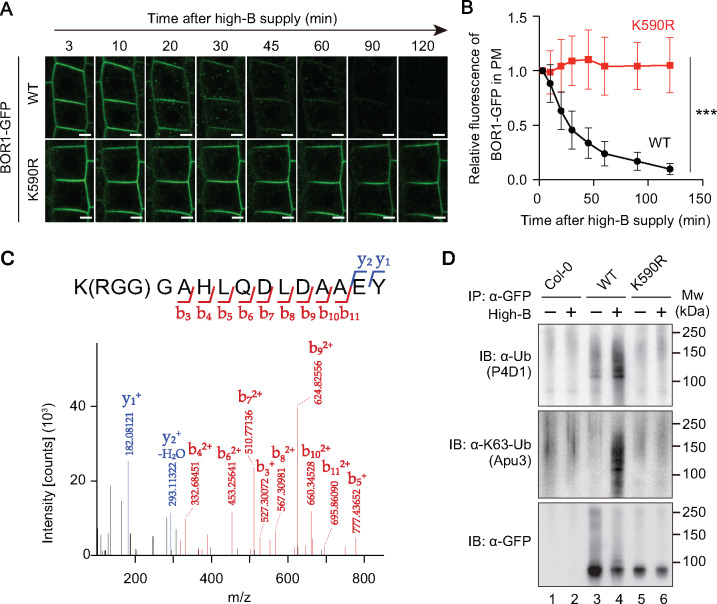
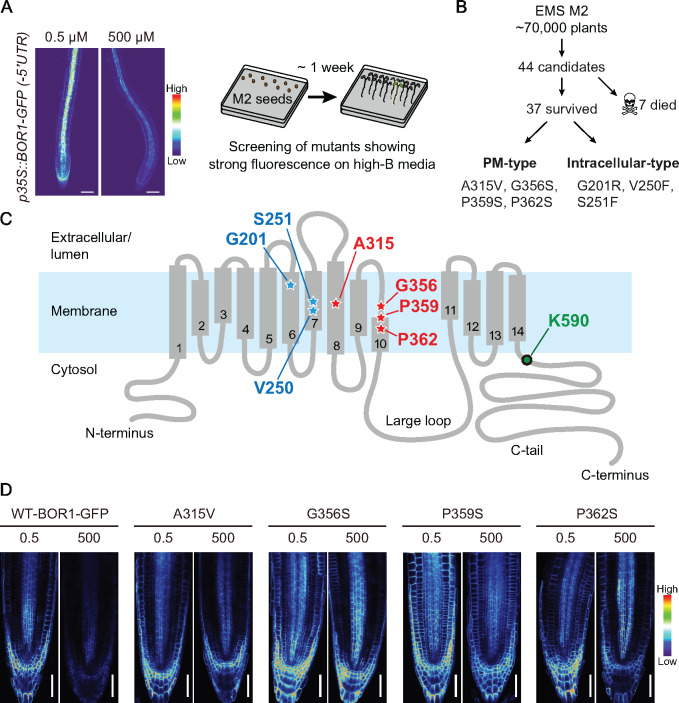
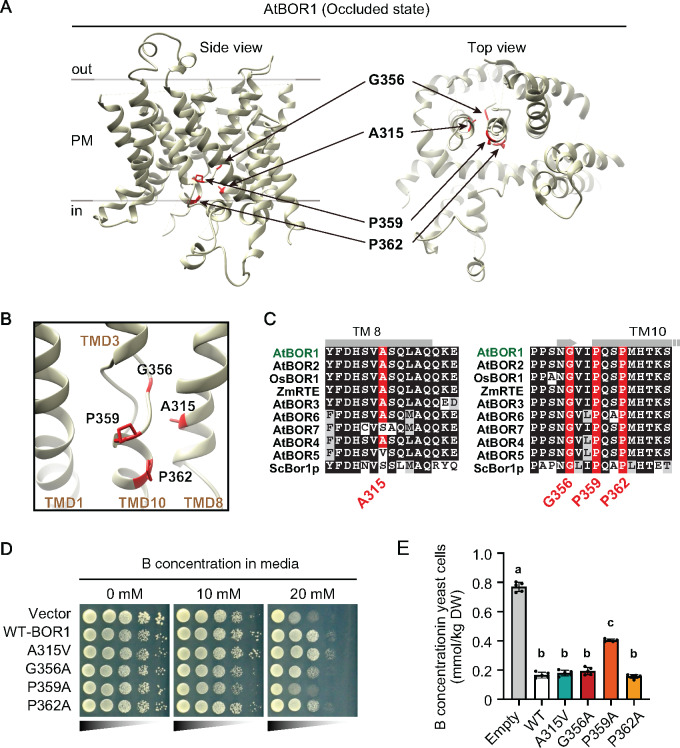
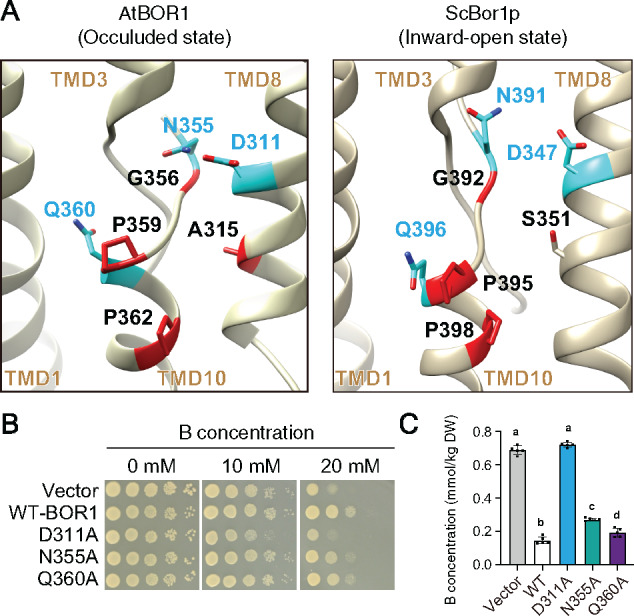
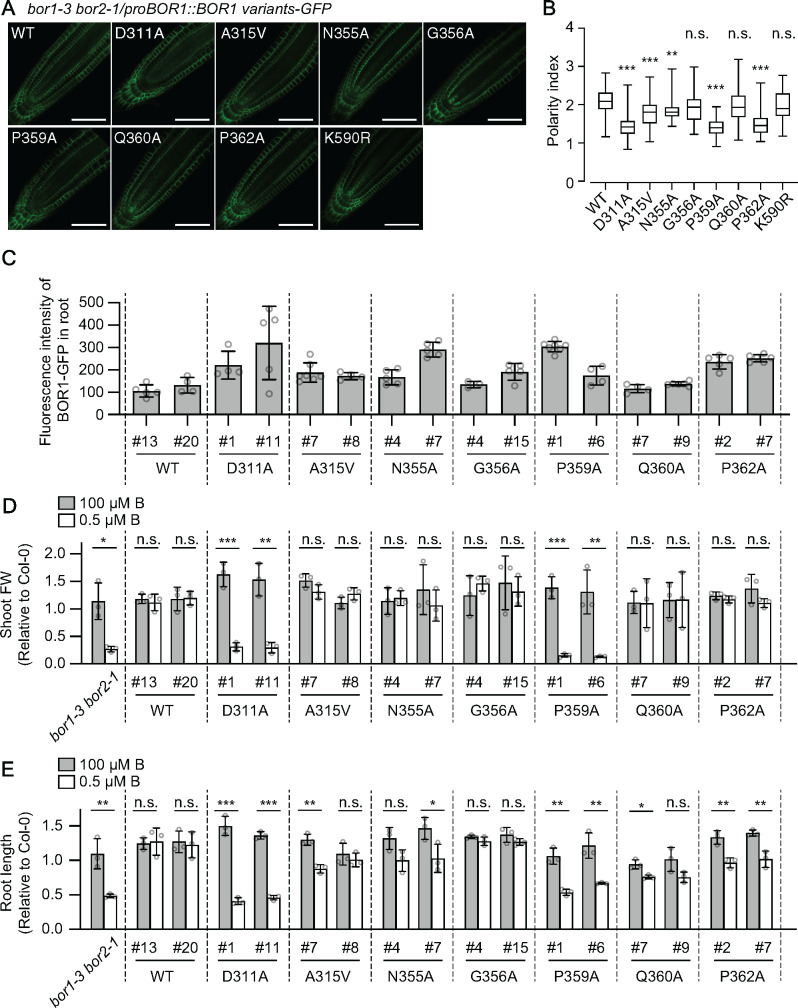
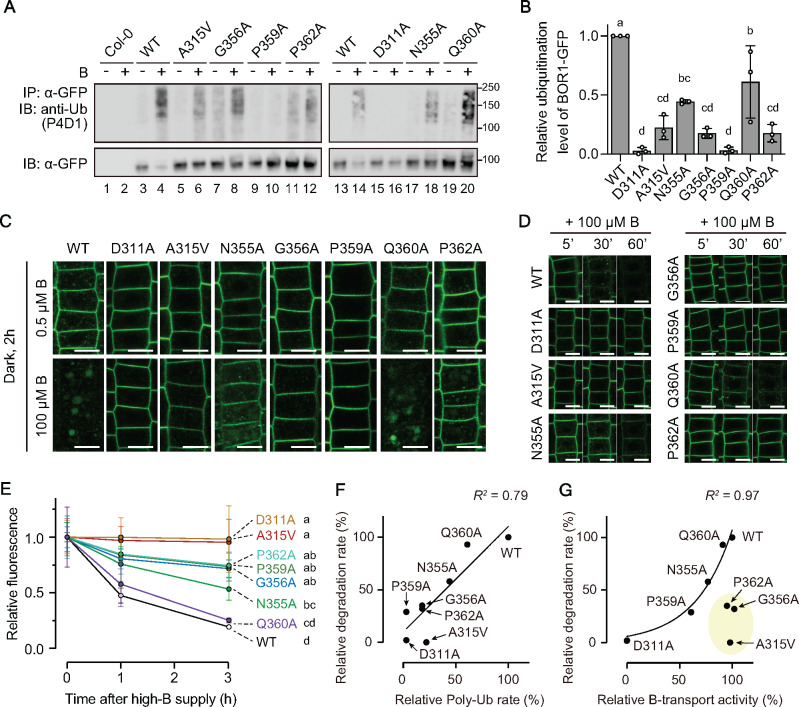
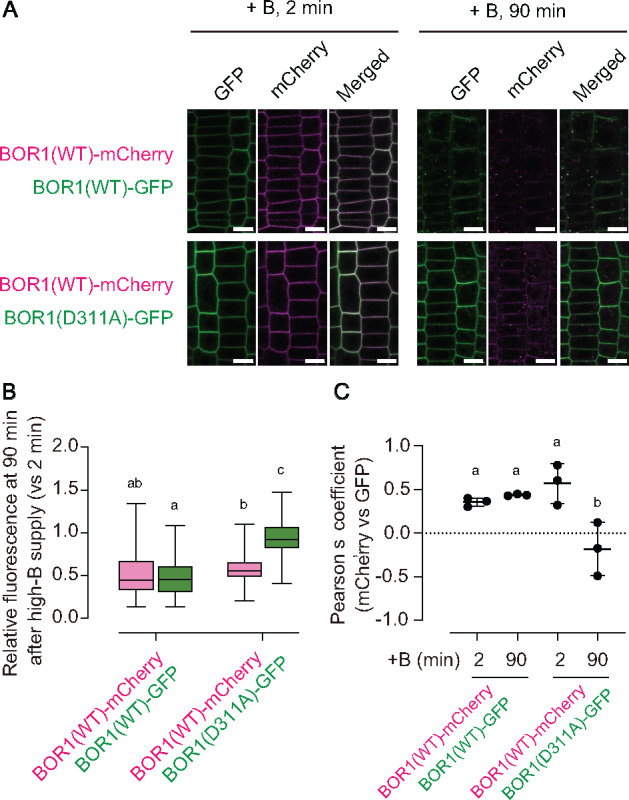
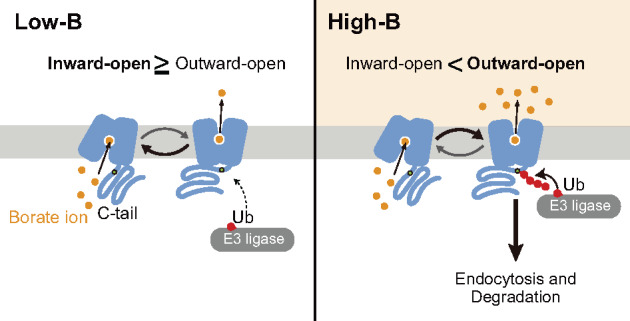
Plants take up and translocate nutrients through transporters. In Arabidopsis thaliana, the borate exporter BOR1 acts as a key transporter under boron (B) limitation in the soil. Upon sufficient-B supply, BOR1 undergoes ubiquitination and is transported to the vacuole for degradation, to avoid overaccumulation of B. However, the mechanisms underlying B-sensing and ubiquitination of BOR1 are unknown. In this study, we confirmed the lysine-590 residue in the C-terminal cytosolic region of BOR1 as the direct ubiquitination site and showed that BOR1 undergoes K63-linked polyubiquitination. A forward genetic screen identified that amino acid residues located in vicinity of the substrate-binding pocket of BOR1 are essential for the vacuolar sorting. BOR1 variants that lack B-transport activity showed a significant reduction of polyubiquitination and subsequent vacuolar sorting. Coexpression of wild-type (WT) and a transport-defective variant of BOR1 in the same cells showed degradation of the WT but not the variant upon sufficient-B supply. These findings suggest that polyubiquitination of BOR1 relies on its conformational transition during the transport cycle. We propose a model in which BOR1, as a B transceptor, directly senses the B concentration and promotes its own polyubiquitination and vacuolar sorting for quick and precise maintenance of B homeostasis.


Figures

Figure 1
Figure 1
BOR1 undergoes polyubiquitination under high-B conditions. (A and B) Boron-induced vacuolar transport of BOR1-GFP was impaired by the K590R mutation. The 4-day-old seedlings grown with 0.5 µM B were shifted to high-B (100 µM) media. A, Confocal microscopy of WT and the K590R mutant of BOR1-GFP in root epidermal cells. Scale bars indicate 5 µm. B, Relative fluorescence of BOR1-GFP in the plasma membrane after high-B supply. Error bars represent mean ± SD. ***P <0.0001, determined by two-way ANOVA. n = 67 (WT) and 68 (K590R) cells from three different roots. (C) BOR1 is directly ubiquitinated at the K590 residue. A representative result of tandem mass spectrometry (MS/MS) of a peptide derived from BOR1-GFP digested by chymotrypsin. A peak shift due to conjugation of Arg-Gly-Gly (RGG) to the K590 residue was detected. Protein was extracted from pro35S:BOR1-GFP/Col-0 plants grown with 0.5 µM B for 22 days. (D) Lysine-590 is required for polyubiquitination of BOR1. Immunoblot analysis of ubiquitination against BOR1-GFP. BOR1-GFP was immunoprecipitated using an anti-GFP antibody and then detected by anti-ubiquitin antibody (P4D1), anti-K63-linked polyubiquitination antibody (Apu3), and anti-GFP antibody, respectively.
Figure 2
Figure 2
Forward genetic screen identified internal mutations that affect vacuolar transport and subcellular localization of BOR1-GFP. (A) Experimental design of the mutant screening. Representative images of BOR1-GFP driven by 35S promoter under low (0.5 µM) and high (500 µM) B conditions, which were used for the screening (left). Confocal microscopy of pro35S:BOR1-GFP/Col-0 plants grown on medium containing 0.5 or 500 µM B for 5 days. Scale bars represent 50 µm. Conceptual illustration of the forward genetic screen to identify mutants in which vacuolar transport of BOR1-GFP is impaired (right). M2 plants exhibiting strong fluorescence of BOR1-GFP on the high-B (500 µM B) media were selected. (B) Brief summary of mutant screening. (C) Topological model of BOR1 protein. Amino acid residues identified as missense mutations in the screening and the ubiquitination site (K590) are highlighted. (D) Fluorescence of BOR1-GFP variants in M4 seedlings grown on 0.5 or 500 µM B for 5 days. Scale bars represent 50 µm.
Figure 3
Figure 3
Amino acid residues A315, G356, P359, and P362 surround the potential substrate-binding site. (A) Three-dimensional structure of Arabidopsis thaliana BOR1 in the occluded state (PDB 5L25). (B) Substrate-binding pocket of BOR1. Structural images were depicted by UCSF Chimera software ver. 1.13.1 (Pettersen et al., 2004). (C) Multiple alignment of BOR1 orthologs in plants and budding yeast. (D and E) Transport activity of the BOR1 variants. (D) S. cerevisiae bor1Δ strains harboring AtBOR1 variants (WT, A315V, G356A, P359A, and P362A) were spotted on SD media containing 0, 10, or 20 mM boric acid and cultured for 6 days at 30°C. Diluted yeast suspensions were spotted onto the media with OD600=0.4, 0.04, 0.004, or 0.0004. (E) 11B content in the yeast cells after incubation with liquid medium containing 1 mM of boric acid for 50 min at 30°C. Different letters indicate significant differences between constructs, determined by one-way ANOVA followed by Tukey–Kramer’s post hoc test (P <0.05). n =4 or 5 different colonies were used. Error bars represent mean ± SD.
Figure 4
Figure 4
Boron-transport activity of BOR1 variants in yeasts. (A) Comparison of amino acid positions between AtBOR1 (PDB: 5L25) and ScBor1p (PDB: 5SV9). D311, N355, and Q360 in AtBOR1 are homologous to D347 and Q396 in ScBor1p, respectively. Structural images were depicted by UCSF Chimera software ver. 1.13.1. (B and C) Transport activity of the BOR1 variants. (B) S. cerevisiae bor1Δ strains harboring AtBOR1 variants (WT, D311A, N355A, and Q360A) were spotted on SD-Ura +D-Galactose medium containing 0 or 15 mM boric acid and cultured for 6 days at 30°C. Diluted yeast suspensions were spotted onto the medium at OD600=0.4, 0.04, 0.004, or 0.0004. (C) 11B content in the yeasts after incubation with liquid medium containing 1 mM of boric acid for 50 min at 30°C. Different letters indicate significant differences between constructs, determined by ANOVA followed by Tukey–Kramer’s post hoc test (P <0.05). n =4 or 5 different colonies were used. Error bars represent mean ± SD.
Figure 5
Figure 5
Boron-transport activity of BOR1 variants in plants. (A) Representative confocal images of BOR1-GFP variants in the primary root tip of Arabidopsis seedlings grown on 0.5 µM B MGRL medium for 5 days. Scale bars represent 50 µm. (B) Box plot representation of polarity indexes of BOR1-GFP variants. Letters above box plots indicate significant differences determined by the nonparametric Kruskal–Wallis test (*P <0.05, ***P <0.001, and ****P <0.0001, n.s. means no significant difference). n =49–87 cells from 3 to 5 different roots. Box plot center lines show the medians. Box limits indicate the 25th and 75th percentiles. Whiskers are extended to the highest and the lowest values. (C) Fluorescence intensity of BOR1-GFP. The total fluorescence of BOR1-GFP in the root tip was obtained by taking a Z-stack in 2 µm intervals over a total distance of 80 µm for each individual root by a 20× dry objective lens equipped with LSM800 (Zeiss). Error bars represent mean ± SD. n =4–8 plants. (D and E) Leaf fresh weight (D) and root length (E) values relative to WT Col-0 plants grown in the same plate. Error bars represent mean ± SD. Significant differences were determined by Student’s t-test (*P <0.05, **P <0.01, ***P <0.001). n =3 sets of plates.
Figure 6
Figure 6
Vacuolar transport and ubiquitination of BOR1 variants. (A) Analysis of ubiquitination of BOR1-GFP variants by immunoblotting. Plants were grown with 100 µM B for 14 days followed by a shift to 0.5 µM B medium for 1 day. BOR1-GFP was immunoprecipitated from root-tissue-lysate extracted from the seedlings treated with 0.5 µM (−) or 500 µM (+) boric acid for 60 min. Ubiquitin and BOR1-GFP were detected by anti-ubiquitin monoclonal antibody (P4D1) and anti-GFP monoclonal antibody, respectively. As a negative control, WT Col-0 plants were used. (B) Relative ubiquitination level of the BOR1-GFP variants normalized by that of WT BOR1-GFP. Intensity of the ubiquitination band was divided by the corresponding GFP intensity. Bars represent mean ± SD. Dots indicate individual data points. n = 3 independent replications. Different letters above plots indicate significant differences determined by one-way ANOVA followed by Tukey–Kramer’s post hoc test (P < 0.001). (C and D) Confocal images of root epidermal cells expressing the BOR1-GFP variants treated with 0.5 or 100 µM B. (C) Long-term incubation for 2 h under a dark condition to examine the increase of GFP in the vacuole. Scale bars indicate 10 µm. (D) Time course analysis of BOR1-GFP degradation. Scale bars indicate 10 µm. (E) Quantification of fluorescence intensity of BOR1-GFP variants treated with 100 µM boric acid for 0, 1, or 3 h. The total fluorescence of BOR1-GFP in the root tip was obtained by taking a Z-stack in 2 µm intervals over a total distance of 80 µm for each individual root by a 20× dry objective lens equipped with LSM800 (Zeiss). The intensities were compared to the treatment without the high-B treatment. Error bars represent mean ± SD. Different letters indicate significant differences between constructs, determined by two-way ANOVA followed by Tukey–Kramer’s post hoc test (P <0.01). n =4–7 plants. (F) Relationship between polyubiquitination level and degradation rate of BOR1-GFP variants. Plots showed linear correlation (R2=0.79). G, Relationship between B-transport activity and degradation rate of BOR1-GFP variants. The percentage relative to the value of BOR1 WT (Supplemental Table 1) was used for individual plots. Plots except A315V, G356A, and P362A showed exponential correlation (R2=0.97).
Figure 7
Figure 7
WT BOR1-GFP in the same cells does not promote degradation of BOR1(311A)-GFP. (A) F1 plants derived from the cross of proBOR1:BOR1-GFP/bor1-1 or proBOR1:BOR1(D311A)-GFP/bor1-3 bor2-1 and proBOR1:BOR1-mCherry/bor1-1 were grown on solid medium containing 0.5 µM boron for 6 days and shifted to liquid MGRL medium containing 100 µM B for 2 or 90 min. Scale bars represent 10 µm. (B) Box plot representation of the relative fluorescence of BOR1(WT)-mCherry and BOR1(WT/D311A)-GFP in the plasma membrane compared with those at 2 min after high-B supply. n =90 cells from three different roots for each set. Letters above plots represent significant differences determined by one-way ANOVA with Tukey–Kramer’s post hoc test (P <0.01). (C) Pearson’s coefficient between GFP and mCherry fluorescence signals in the root epidermal cells treated with high-B for 2 or 90 min. n =3 images from different roots (panels in A are representative). Error bars indicate mean ± SD. Dots indicate individual data points. Different letters above plots indicate significant differences determined by one-way ANOVA with Tukey–Kramer’s post hoc test (P <0.05).
Figure 8
Figure 8
A model for B sensing. A transport-ubiquitination coupled model. Under low-B conditions, BOR1 is largely in the inward-open state, with the K590 residue in the C-tail unexposed. Under high-B conditions, BOR1 is more frequently in the outward-open state, with the C-tail exposed, giving access to the K590 residue for E3 ligases. Longer exposure to the E3 ligase results in polyubiquitination and subsequent endocytic degradation of BOR1.
None

References

    1. Aibara I, Hirai T, Kasai K, Takano J, Onouchi H, Naito S, Fujiwara T, Miwa K (2018) Boron-dependent translational suppression of the borate exporter BOR1 contributes to the avoidance of boron toxicity. Plant Physiol 177: 759–774 - PMC - PubMed
    1. Babst M (2020) Regulation of nutrient transporters by metabolic and environmental stresses. Curr Opin Cell Biol 65: 35–41 - PMC - PubMed
    1. Barberon M, Zelazny E, Robert S, Conéjéro G, Curie C (2011) Monoubiquitin-dependent endocytosis of the transporter controls iron uptake in plants. Proc Natl Acad Sci USA 108: E450–E458 - PMC - PubMed
    1. Bayle V, Arrighi J-F, Creff A, Nespoulous C, Vialaret J, Rossignol M, Gonzalez E, Paz-Ares J, Nussaume L (2011) Arabidopsis thaliana high-affinity phosphate transporters exhibit multiple levels of posttranslational regulation. Plant Cell 3: 1523–35 - PMC - PubMed
    1. Clough SJ, Bent AF (1998) Floral dip: a simplified method forAgrobacterium-mediated transformation of Arabidopsis thaliana. Plant J 16: 735–743 - PubMed

Publication types

MeSH terms