

Evidence of the pathogenic HERV-W envelope expression in T lymphocytes in association with the respiratory outcome of COVID-19 patients
- PMID: 33867312
- PMCID: PMC8082064
- DOI: 10.1016/j.ebiom.2021.103341
Evidence of the pathogenic HERV-W envelope expression in T lymphocytes in association with the respiratory outcome of COVID-19 patients
Abstract
Background: Despite an impressive effort in clinical research, no standard therapeutic approach for coronavirus disease 2019 (COVID-19) patients has been established, highlighting the need to identify early biomarkers for predicting disease progression and new therapeutic interventions for patient management. The present study aimed to evaluate the involvement of the human endogenous retrovirus -W envelope (HERV-W ENV) in severe acute respiratory syndrome coronavirus 2 (SARS-CoV-2) infection considering recent findings that HERVs are activated in response to infectious agents and lead to various immunopathological effects. We analysed HERV-W ENV expression in blood cells of COVID-19 patients in correlation with clinical characteristics and have discussed its potential role in the outcome of the disease.
Methods: We analysed HERV-W ENV expression in blood samples of COVID-19 patients and healthy donors by flow cytometry and quantitative reverse transcriptase PCR analysis, and evaluated its correlation with clinical signs, inflammatory markers, cytokine expression, and disease progression.
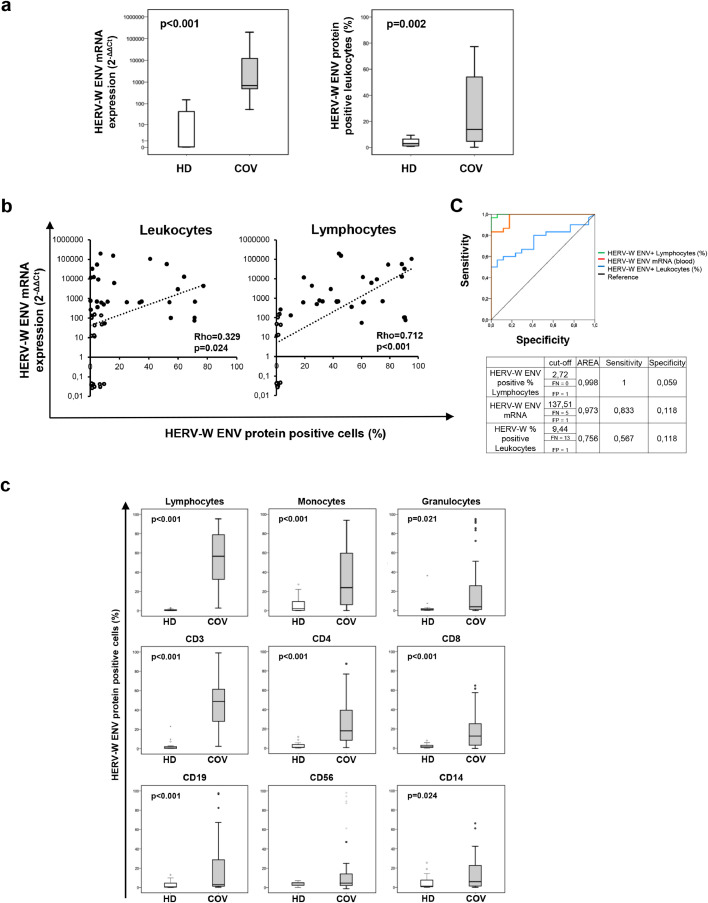
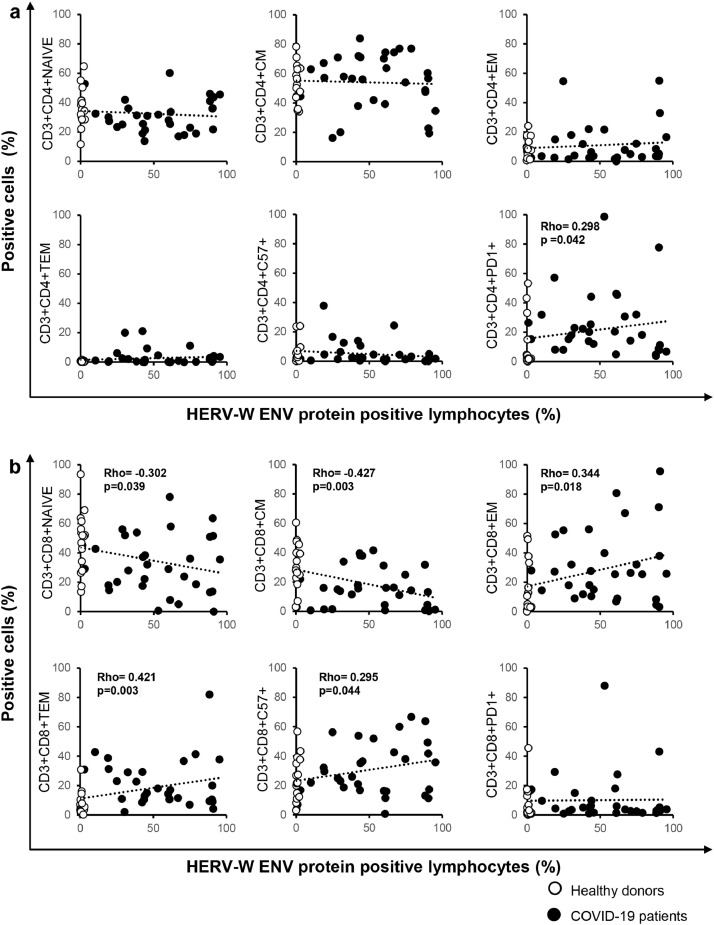
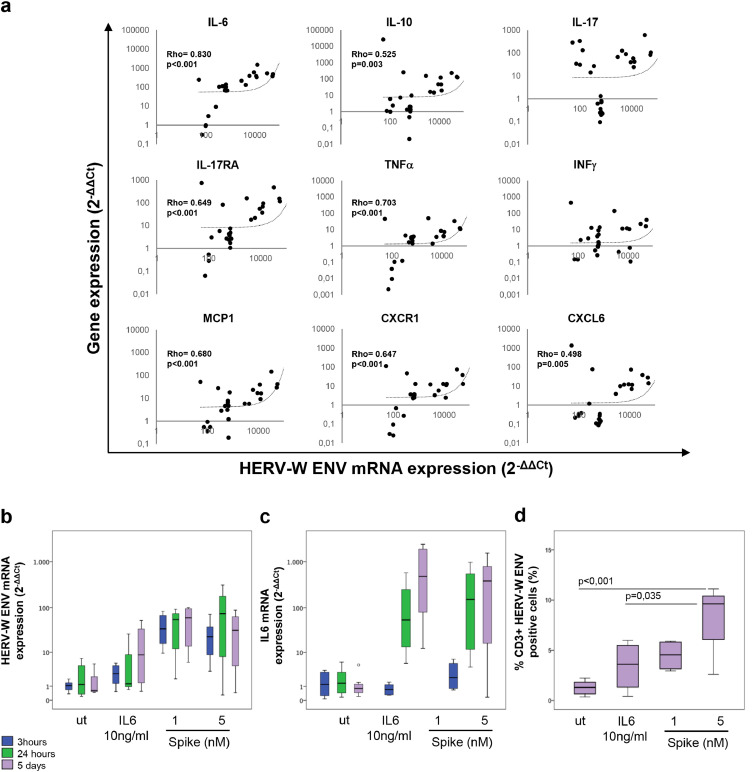
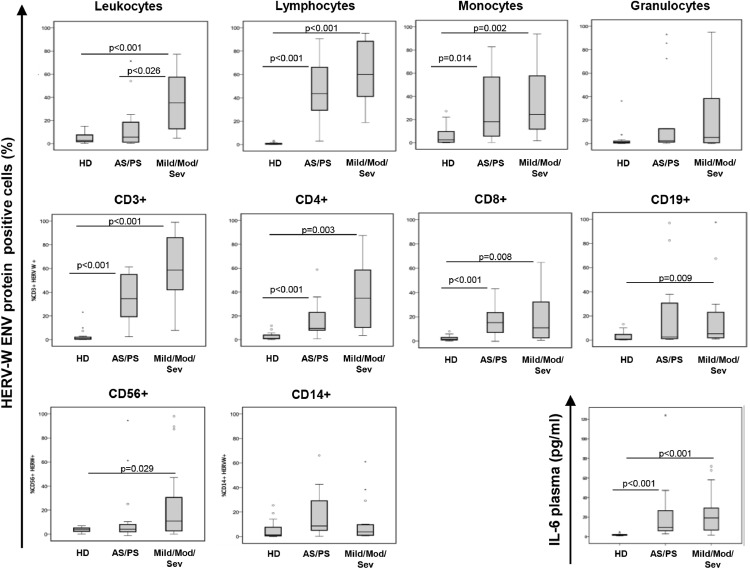
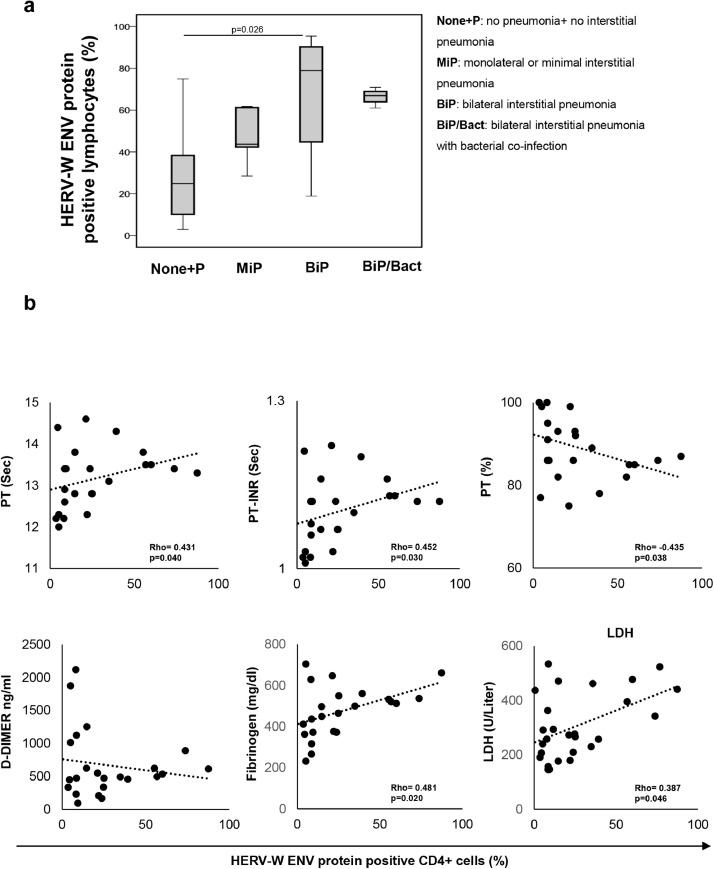
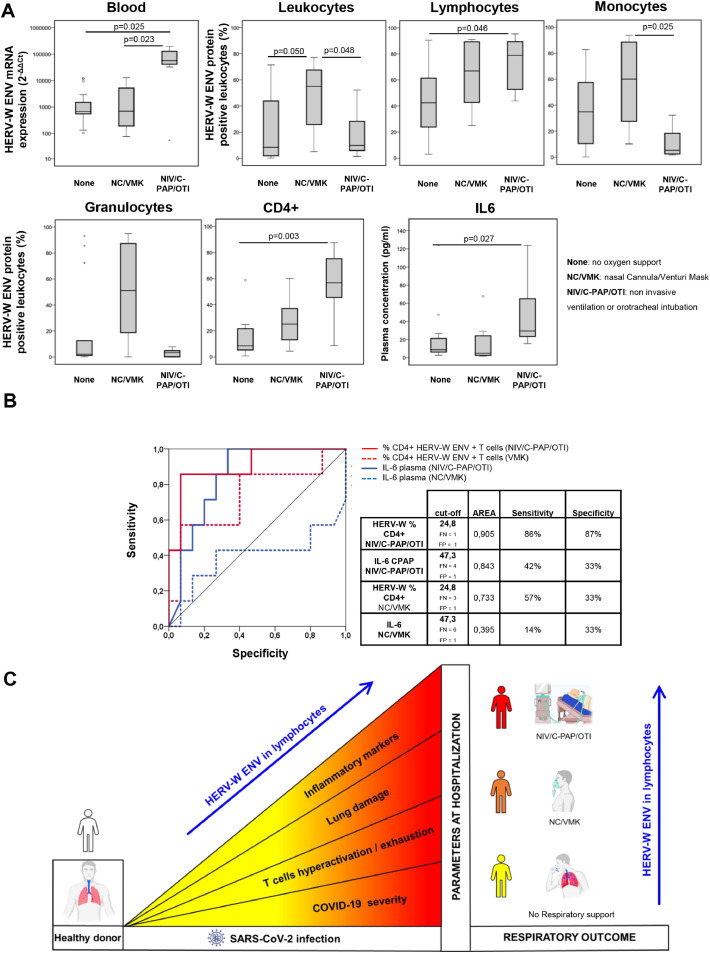
Findings: HERV-W ENV was highly expressed in the leukocytes of COVID-19 patients but not in those of healthy donors. Its expression correlated with the markers of T-cell differentiation and exhaustion and blood cytokine levels. The percentage of HERV-W ENV-positive lymphocytes correlated with inflammatory markers and pneumonia severity in COVID-19 patients. Notably, HERV-W ENV expression reflects the respiratory outcome of patients during hospitalization.
Interpretation: Given the known immuno- and neuro-pathogenicity of HERV-W ENV protein, it could promote certain pathogenic features of COVID-19 and therefore serve as a biomarker to predict clinical progression of disease and open to further studies for therapeutic intervention.
Funding: Information available at the end of the manuscript.
Keywords: COVID-19; Cytokine storm; HERV-W. human endogenous retroviruses; Inflammation; Respiratory outcome; T-cell exhaustion.
Copyright © 2021 The Author(s). Published by Elsevier B.V. All rights reserved.
Conflict of interest statement
Declaration of Competing Interests C.M. reports grant from Gilead, outside the submitted work; M.I. reports personal fees from Biogen srl, personal fees from Becton, Dickinson and Company, outside the submitted work; HP and BC receive compensation for their work by Geneuro-Innovation. The other authors have nothing to disclose.
Figures
Similar articles
-
HERV-W Env Induces Neuron Pyroptosis via the NLRP3-CASP1-GSDMD Pathway in Recent-Onset Schizophrenia.Int J Mol Sci. 2025 Jan 9;26(2):520. doi: 10.3390/ijms26020520. Int J Mol Sci. 2025. PMID: 39859234 Free PMC article.
-
Human endogenous retrovirus envelope proteins target dendritic cells to suppress T-cell activation.Eur J Immunol. 2015 Jun;45(6):1748-59. doi: 10.1002/eji.201445366. Epub 2015 Apr 17. Eur J Immunol. 2015. PMID: 25752285
-
Expression of human endogenous retrovirus-w including syncytin-1 in cutaneous T-cell lymphoma.PLoS One. 2013 Oct 1;8(10):e76281. doi: 10.1371/journal.pone.0076281. eCollection 2013. PLoS One. 2013. PMID: 24098463 Free PMC article.
-
Human endogenous retroviruses and multiple sclerosis: innocent bystanders or disease determinants?Biochim Biophys Acta. 2011 Feb;1812(2):162-76. doi: 10.1016/j.bbadis.2010.07.016. Epub 2010 Aug 6. Biochim Biophys Acta. 2011. PMID: 20696240 Free PMC article. Review.
-
Expression and regulation of human endogenous retrovirus W elements.APMIS. 2016 Jan-Feb;124(1-2):52-66. doi: 10.1111/apm.12478. APMIS. 2016. PMID: 26818262 Review.
Cited by
-
Multidistrict Host-Pathogen Interaction during COVID-19 and the Development Post-Infection Chronic Inflammation.Pathogens. 2022 Oct 18;11(10):1198. doi: 10.3390/pathogens11101198. Pathogens. 2022. PMID: 36297256 Free PMC article. Review.
-
Transactivation of Human Endogenous Retroviruses by Viruses.Viruses. 2024 Oct 22;16(11):1649. doi: 10.3390/v16111649. Viruses. 2024. PMID: 39599764 Free PMC article. Review.
-
High CD169 Monocyte/Lymphocyte Ratio Reflects Immunophenotype Disruption and Oxygen Need in COVID-19 Patients.Pathogens. 2021 Dec 18;10(12):1639. doi: 10.3390/pathogens10121639. Pathogens. 2021. PMID: 34959594 Free PMC article.
-
Human Endogenous Retroviruses as Gene Expression Regulators: Insights from Animal Models into Human Diseases.Mol Cells. 2021 Dec 31;44(12):861-878. doi: 10.14348/molcells.2021.5016. Mol Cells. 2021. PMID: 34963103 Free PMC article. Review.
-
Flow cytometry for extracellular vesicle characterization in COVID-19 and post-acute sequelae of SARS-CoV-2 infection.Extracell Vesicles Circ Nucl Acids. 2024 Aug 9;5(3):417-437. doi: 10.20517/evcna.2024.20. eCollection 2024. Extracell Vesicles Circ Nucl Acids. 2024. PMID: 39697632 Free PMC article. Review.
References
-
- Zhang X., Tan Y., Ling Y. Viral and host factors related to the clinical outcome of COVID-19. Nature. 2020;583:437–440. - PubMed
MeSH terms
Substances
LinkOut - more resources
Full Text Sources
Other Literature Sources
Medical
Molecular Biology Databases
Miscellaneous
