

Estimating Long-term Trends in Populations of Two Ecosystem Engineering Burrowing Shrimps in Pacific Northwest (USA) Estuaries
- PMID: 33867567
- PMCID: PMC8048109
- DOI: 10.1007/s10750-021-04544-7
Estimating Long-term Trends in Populations of Two Ecosystem Engineering Burrowing Shrimps in Pacific Northwest (USA) Estuaries
Abstract
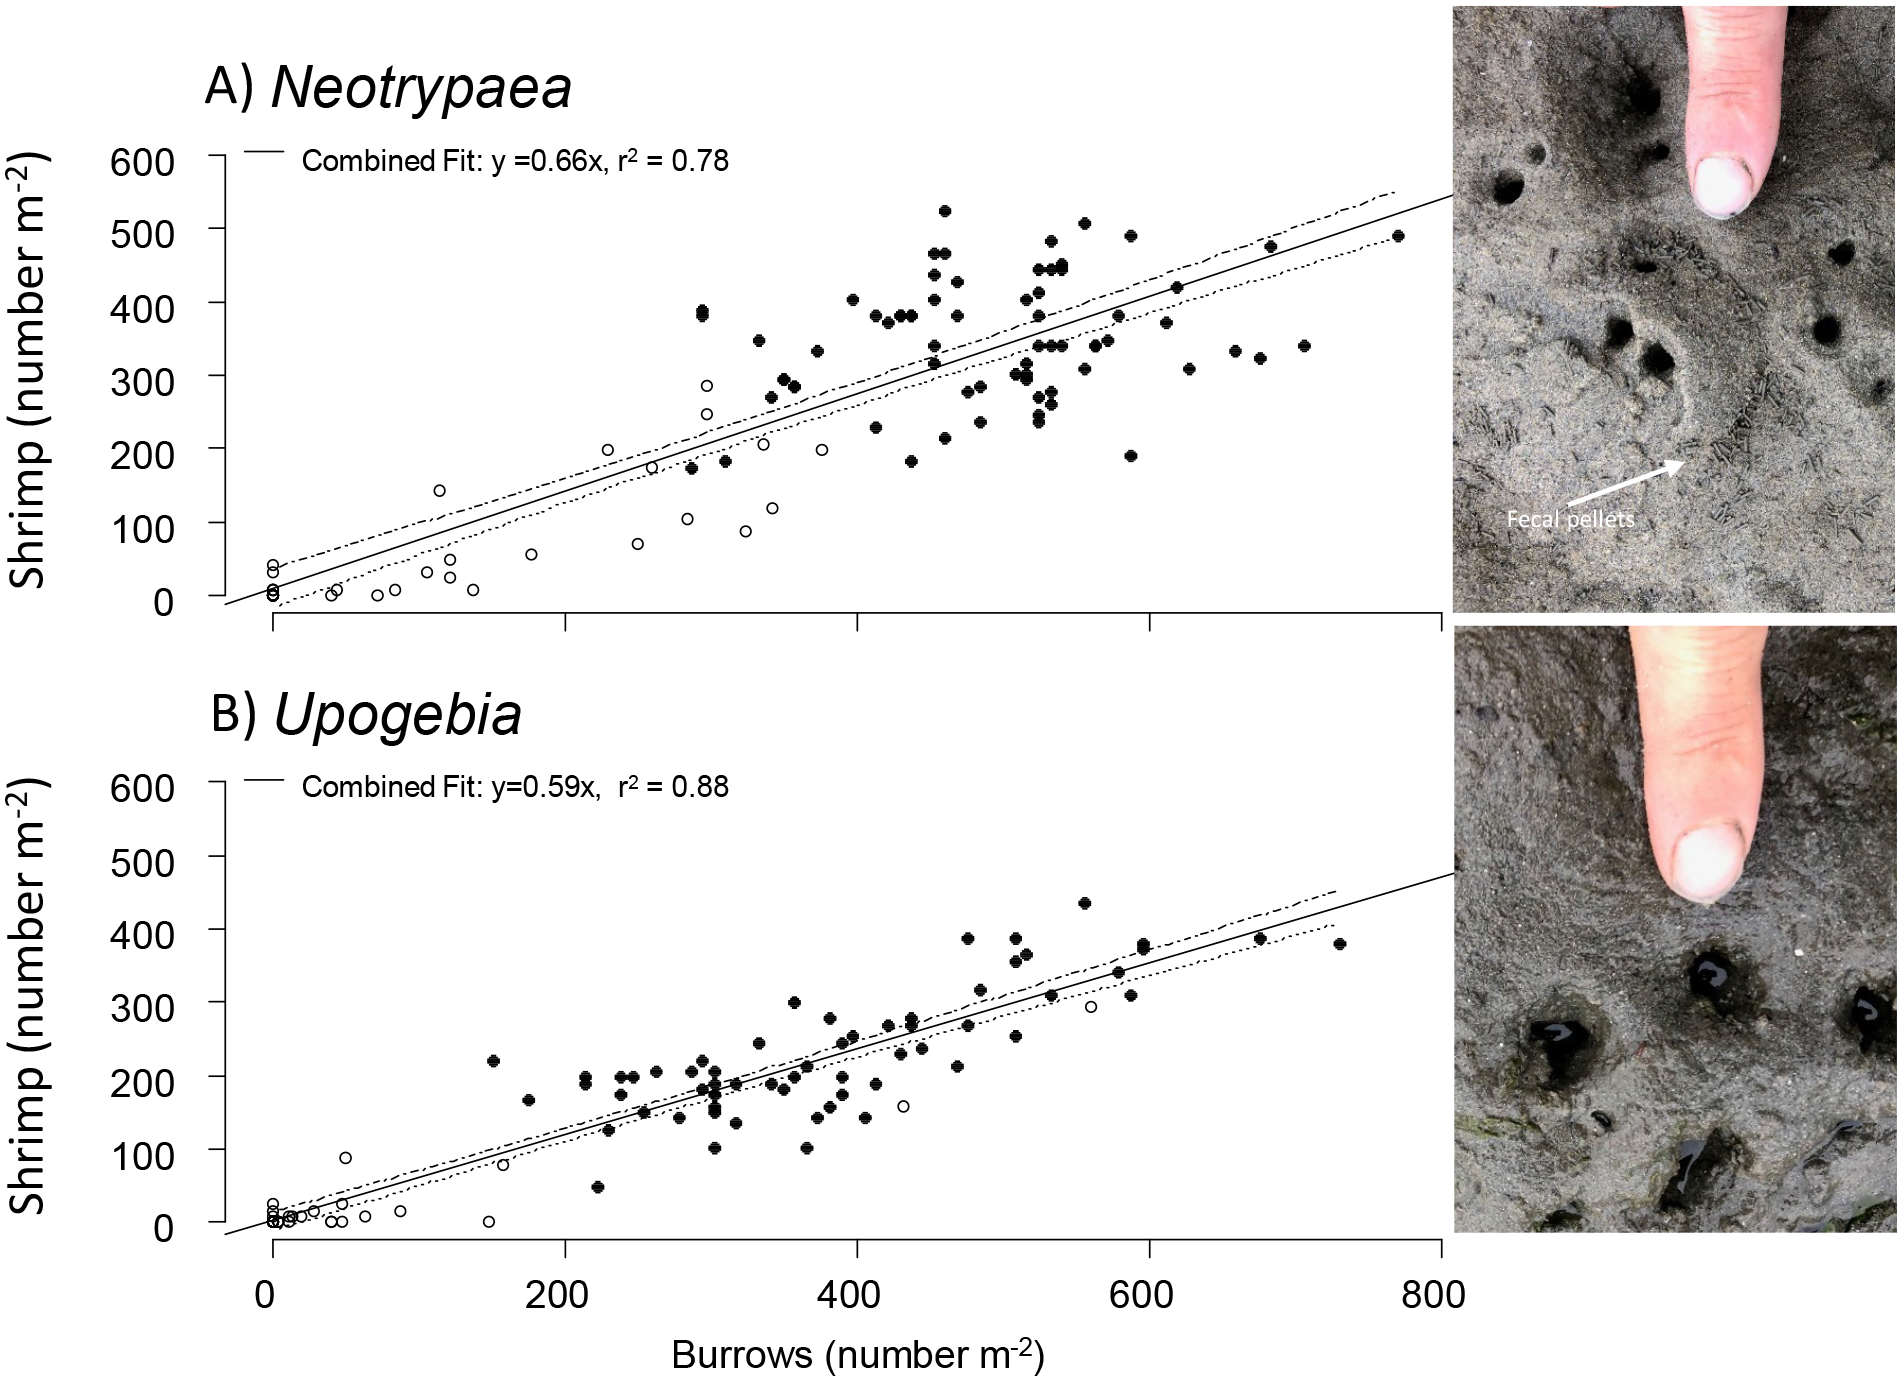
Temporal variation in the density and distribution of the burrowing shrimps, Neotrypaea californiensis and Upogebia pugettensis, were compared in two estuaries along the West coast of the United States (USA) where they are recognized as important ecosystem engineers. Since these shrimp construct deep burrows in the sediment, we quantified the relationship between burrow openings and shrimp density (1.5 and 1.7 burrow openings per shrimp for N. californiensis and U. pugettensis respectively) to permit population abundance estimates to be made over broad landscape scales. Neotrypaea californiensis populations estimated from burrow counts collected using a gridded survey design across representative tide flats declined by 25% between 2008-2010 in Yaquina Bay, Oregon and by 67% in Willapa Bay, Washington from 2006-2011, but increased again in Willapa Bay by 2014. Upogebia pugettensis had mostly disappeared from Willapa Bay by 2006 and declines were observed in Yaquina Bay, but the magnitude and long-term trajectory of U. pugettensis in this estuary was less clear. These species population fluctuations mirrored those observed in density collected at discrete sampling locations over the same period, equate to large changes in secondary production, and have likely resulted in substantial changes to estuarine habitat and food webs.
Keywords: Neotrypaea californiensis; Upogebia pugettensis; burrowing shrimp; population; seascape map.
Figures

 , 1988–2007), and at Goose Point for Upogebia (◆, 2003 – 2009), (B) Focal mapping area covering Idaho Flat and Sally’s Bend (small rectangle) for Neotrypaea and Upogebia in Yaquina Bay, Oregon in 2008 and 2010, with our annual population monitoring sites at Idaho Flats (2005–2010) for Neotrypaea (★) and Upogebia (
 ).
).


References
-
- Abed-Navandi D & Dworschak PC, 2005. Food sources of tropical thalassinidean shrimps: a stable-isotope study. Marine Ecology Progress Series 291:159–168.
-
- Armstrong JL, Armstrong DA & Mathews SB, 1995. Food habits of estuarine staghorn sculpin, Leptocottus armatus, with focus on consumption of juvenile Dungeness crab, Cancer magister. Fishery Bulletin 93:456–470.
-
- Asson D, Chapman JW & Dumbauld BR, 2017. No evidence that the introduced parasite Orthione griffenis Markham, 2004 causes sex change or differential mortality in the native mud shrimp, Upogebia pugettensis (Dana, 1852). Aquatic Invasions 12(2):213–224.
-
- Astall CM, Taylor AC & Atkinson RJA, 1997. Behavioural and physiological implications of a burrow-dwelling lifestyle for two species of upogebiid mud-shrimp (Crustacea: Thalassinidea). Estuarine Coastal and Shelf Science 44:155–168.
-
- Atkinson RJA & Chapman CJ, 1984. Resin casting: a technique of investigating burrows in sublittoral sediments. Progress in Underwater Science 9:15–25.
Grants and funding
LinkOut - more resources
Full Text Sources
Other Literature Sources