. 2021 Feb:143:110616.
doi: 10.1016/j.chaos.2020.110616. Epub 2021 Jan 7.

An epidemiological model with voluntary quarantine strategies governed by evolutionary game dynamics

Affiliations

An epidemiological model with voluntary quarantine strategies governed by evolutionary game dynamics

Marco A Amaral et al. Chaos Solitons Fractals. 2021 Feb.

Abstract

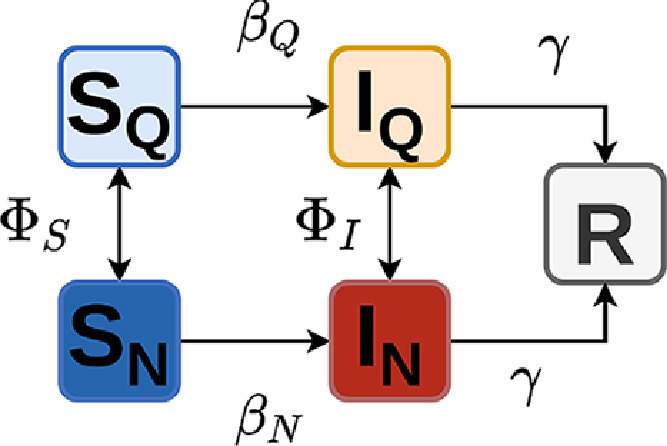
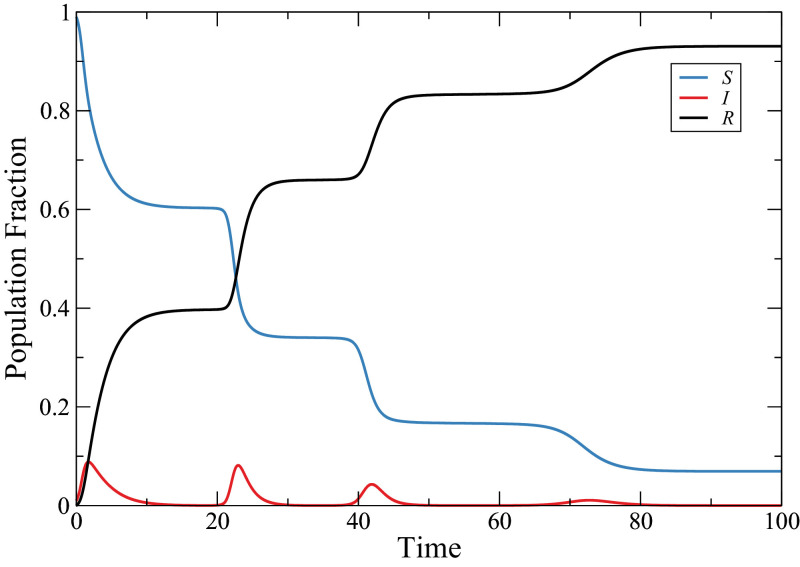
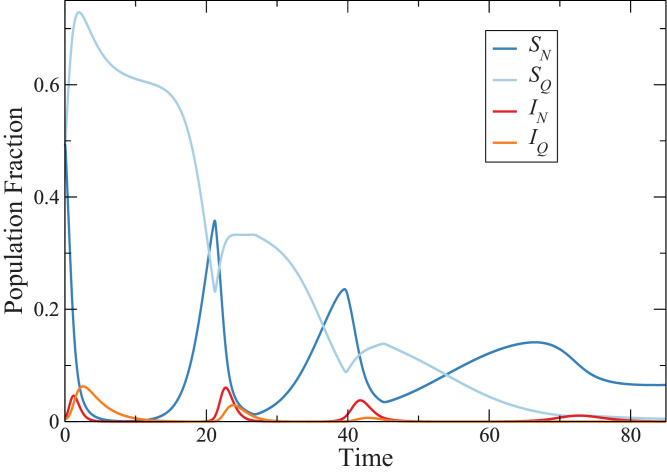
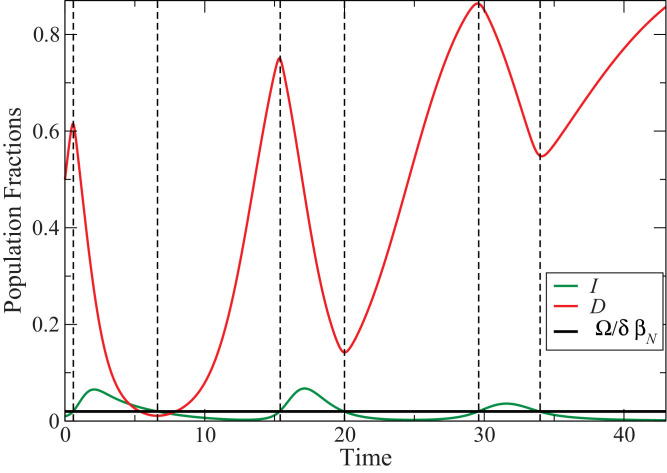
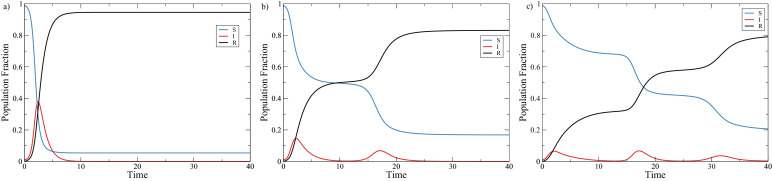
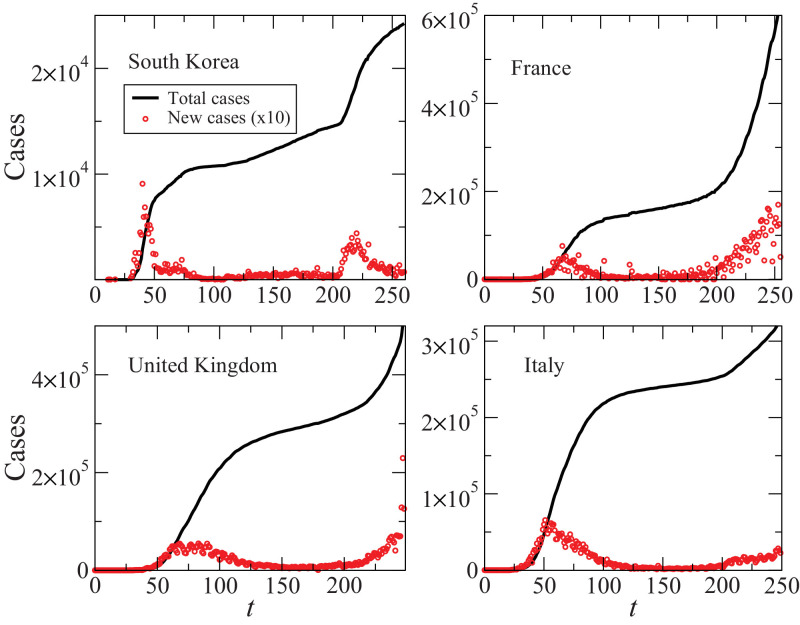
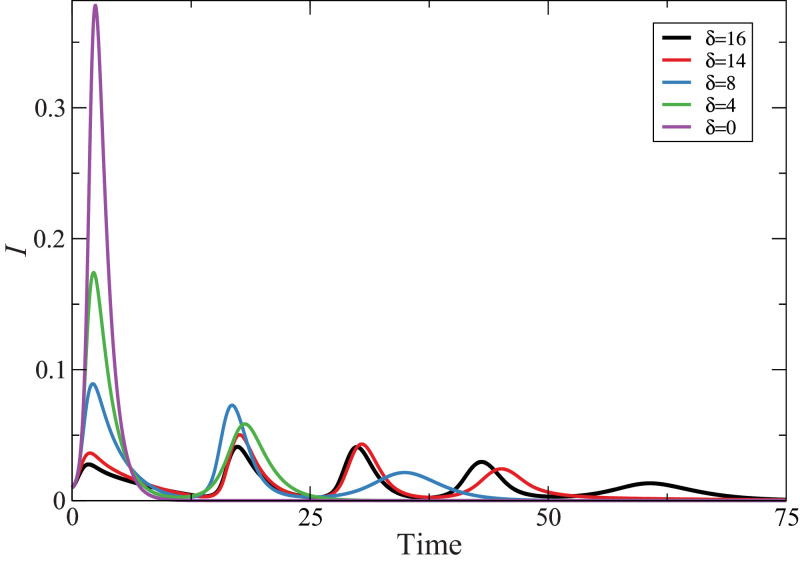
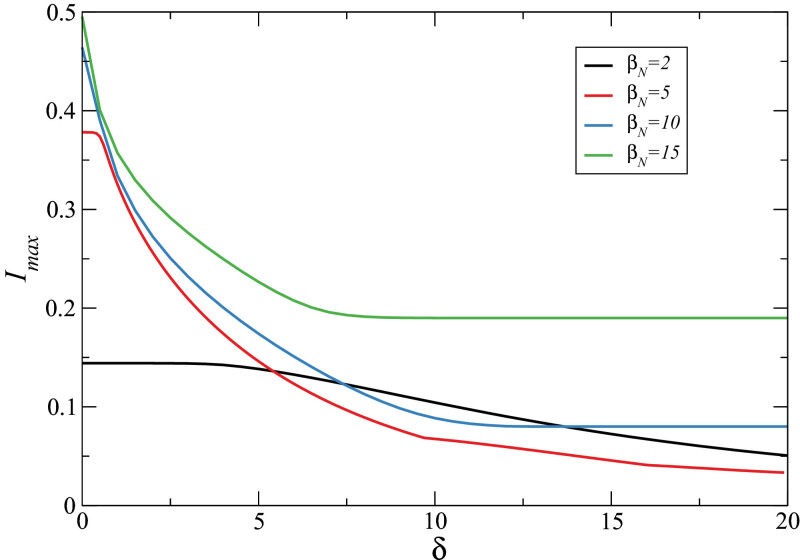
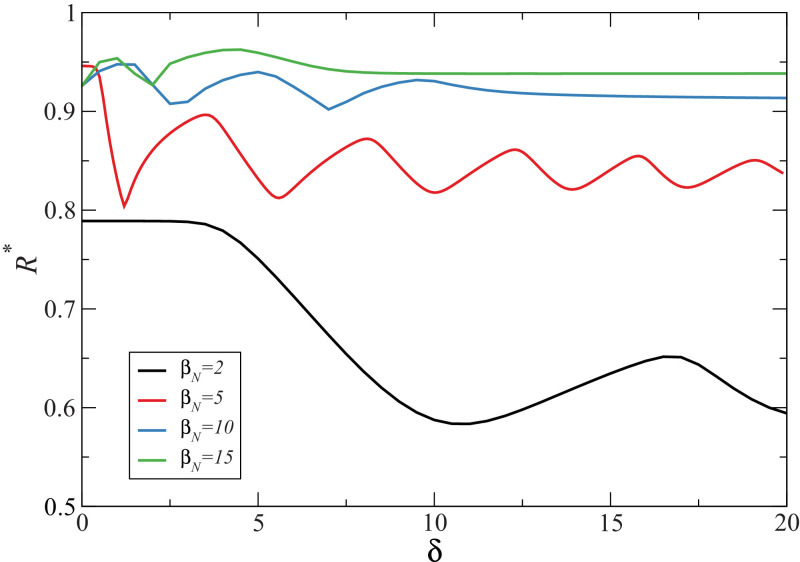
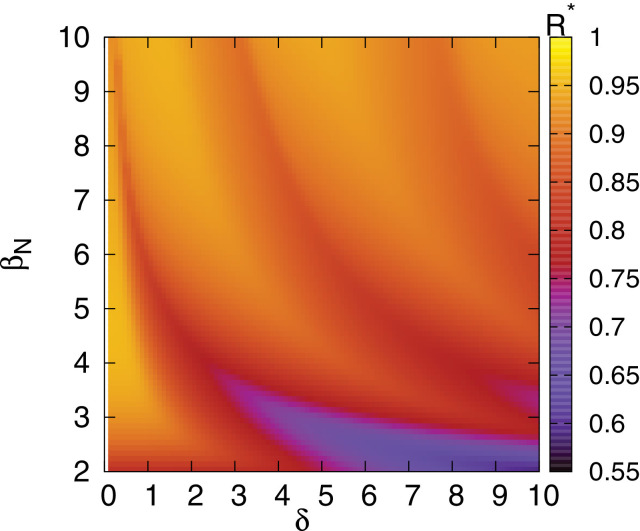
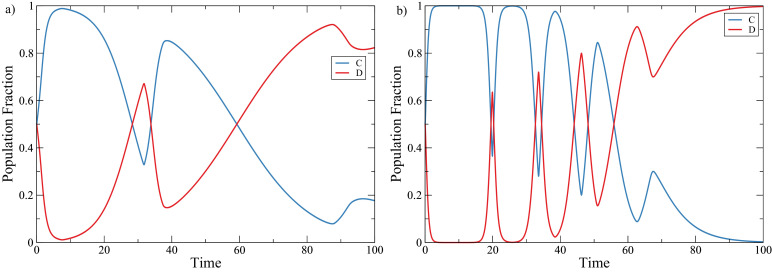
During pandemic events, strategies such as social distancing can be fundamental to reduce simultaneous infections and mitigate the disease spreading, which is very relevant to the risk of a healthcare system collapse. Although these strategies can be recommended, or even imposed, their actual implementation may depend on the population perception of the risks associated with a potential infection. The current COVID-19 crisis, for instance, is showing that some individuals are much more prone than others to remain isolated. To better understand these dynamics, we propose an epidemiological SIR model that uses evolutionary game theory for combining in a single process social strategies, individual risk perception, and viral spreading. In particular, we consider a disease spreading through a population, whose agents can choose between self-isolation and a lifestyle careless of any epidemic risk. The strategy adoption is individual and depends on the perceived disease risk compared to the quarantine cost. The game payoff governs the strategy adoption, while the epidemic process governs the agent's health state. At the same time, the infection rate depends on the agent's strategy while the perceived disease risk depends on the fraction of infected agents. Our results show recurrent infection waves, which are usually seen in previous historic epidemic scenarios with voluntary quarantine. In particular, such waves re-occur as the population reduces disease awareness. Notably, the risk perception is found to be fundamental for controlling the magnitude of the infection peak, while the final infection size is mainly dictated by the infection rates. Low awareness leads to a single and strong infection peak, while a greater disease risk leads to shorter, although more frequent, peaks. The proposed model spontaneously captures relevant aspects of a pandemic event, highlighting the fundamental role of social strategies.

Keywords: Epidemic spreading; Game theory; SIR model; Voluntary quarantine.


Conflict of interest statement

The authors declare that they have no known competing financial interests or personal relationships that could have appeared to influence the work reported in this paper.

Figures

Fig. 1
Fig. 1
Schematic representation of the proposed model. We consider five compartments where agents transition from S,I, and R states through epidemiological dynamics. At the same time, agents change their own strategy (Q or N) through an evolutionary game dynamics. The parameter βi is the infection rate that, depending on the strategy of an agent, is defined as βQ or βN (i.e. quarantine versus normal life stile). Also note that infected individuals of one given strategy can interact with susceptible individuals of the other strategy, e.g. SQIN, by the cross-infection rate βa, further explained in the text. The parameter γ represents the recovery rate and is independent of the specific strategy. Φ represents the strategy change flux for each epidemic state and it is governed by the evolutionary game dynamics.
Fig. 2
Fig. 2
Typical behavior of the epidemiological population, S=(SQ+SN),I=(IQ+IN),R. Note that recurrent infection peaks emerge spontaneously. Here δ=10,βN=10.
Fig. 3
Fig. 3
Typical behavior of the sub-population, SQ,SN,IQ,IN,R. The successive infection peaks are due to the frequent oscillations in the strategies, even if the total susceptible and removed individuals do not oscillate. Here, δ=10,βN=10.
Fig. 4
Fig. 4
Infected agents (I) and defectors strategy fraction (D) time evolution. The horizontal line represents the value I=Ω/δβN. The vertical dashed lines indicate when I(t)=I. As expected, these are the strategy maximum and minimum values. Here δ=10,βN=5.
Fig. 5
Fig. 5
Typical behavior for diverse disease risk perception. In a) there is no disease risk perception, δ=0, and the disease behaves according to the usual SIR dynamics, with a big and singular infection peak. In b) δ=5 and while there are two infection waves, their magnitude is considerably smaller. Finally, in c) δ=10, and we can see three shallow infection peaks. Note that as δ increases, the infection are distributed during a longer time span. In general, an increase in risk perception leads to smaller, and more distributed, infection peaks. Here βN=5.
Fig. 6
Fig. 6
Real data from four different countries regarding the number of total and new cases (×10) since the beginning of the epidemic. While the presented model do not aim to be an empirical fit, it is remarkable to see how the general behavior of secondary infection waves is present. Data obtained from .
Fig. 7
Fig. 7
Evolution of infected agents for different disease perception values, δ. This parameter plays a key role in the infection peak magnitude, making it shorter while distributing the cases over many smaller infection waves. Here βN=5.
Fig. 8
Fig. 8
Maximum simultaneous infected agents density (Imax) as a function of the perceived disease risk δ. The magnitude of the peak decreases for greater disease awareness values.
Fig. 9
Fig. 9
Infection size, measured as the final value of removed agents, R*. The impact of δ in R* is less pronounced than in Imax. For some values of βN, the fraction R* presents oscillations.
Fig. 10
Fig. 10
Phase space βN×δ for the final epidemic size R*. The oscillations of R* in relation to both parameters are present for all studied values. Note that the final epidemic size decreases with δ mainly for low βN values.
Fig. 11
Fig. 11
Strategy adoption evolution for different coupling constant values τ. In a) we present a value corresponding to half the time-scale of the epidemics, i.e. τ=0.5. Figure b) presents a time-scale twice as fast, τ=2. The peaks in the defector fraction always correlates to peaks in the total infected population I. Greater τ values leads to more frequent oscillations in the strategy distribution, and consequently more infection peaks with lower heights. Here we used δ=10,βN=10.

References

    1. Chua J.V., Chen W.H. Bench-to-bedside review: vaccine protection strategies during pandemic flu outbreaks. Crit Care. 2010;14(2):218. doi: 10.1186/cc8891. - DOI - PMC - PubMed
    1. Manfredi P., D’Onofrio A. Springer; New York, New York, NY: 2013. Modeling the interplay between human behavior and the spread of infectious diseases. - DOI
    1. Ali I. Disaster medicine and public health preparedness. 2020. COVID-19: Are we ready for the second wave? pp. 1–3. - DOI - PMC - PubMed
    1. Keeling M.J., Rohani P. Princeton University Press; 2011. Modeling infectious diseases in humans and animals. - DOI
    1. University J.H.. Coronavirus resource center. 2020. https://coronavirus.jhu.edu/map.html, [Online; accessed 22-June-2020].

LinkOut - more resources