

Constructing Dynamic Brain Functional Networks via Hyper-Graph Manifold Regularization for Mild Cognitive Impairment Classification
- PMID: 33867931
- PMCID: PMC8047143
- DOI: 10.3389/fnins.2021.669345
Constructing Dynamic Brain Functional Networks via Hyper-Graph Manifold Regularization for Mild Cognitive Impairment Classification
Abstract
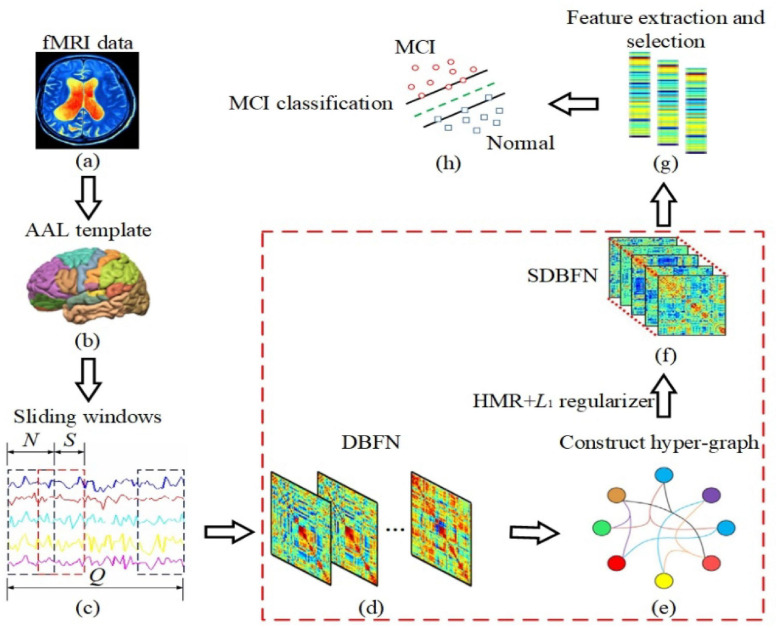
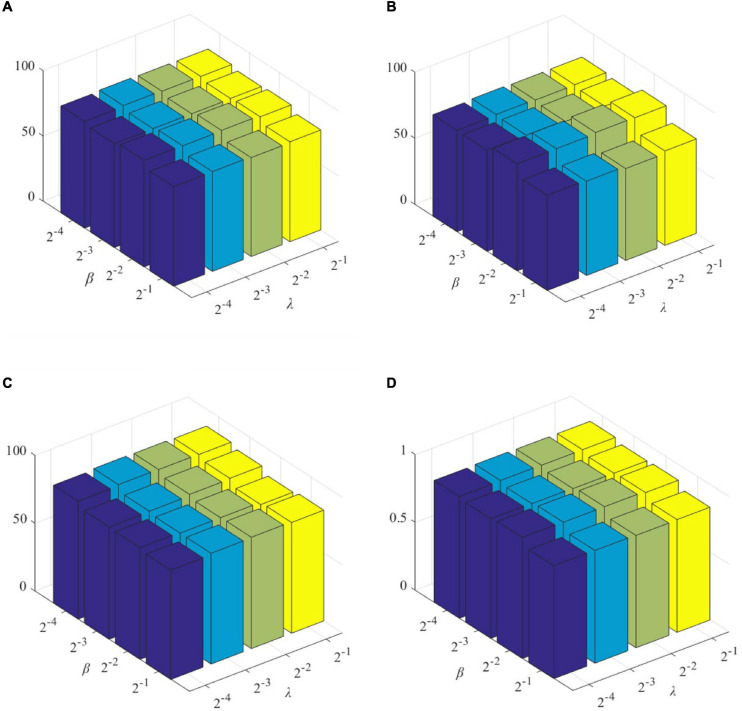
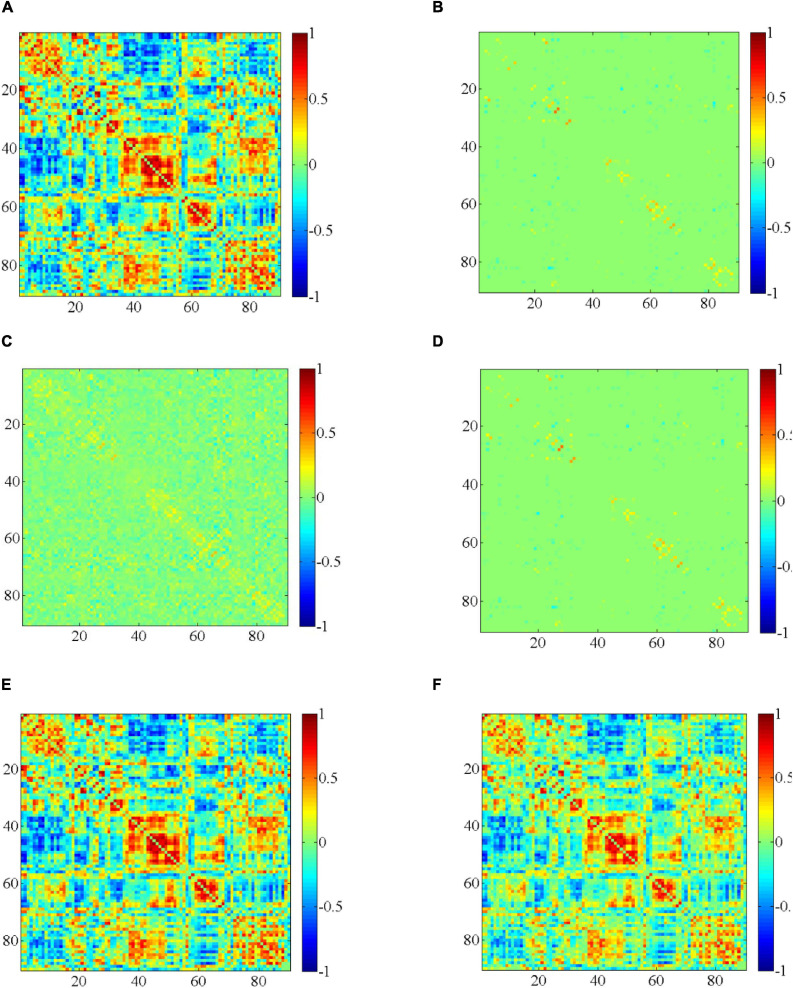
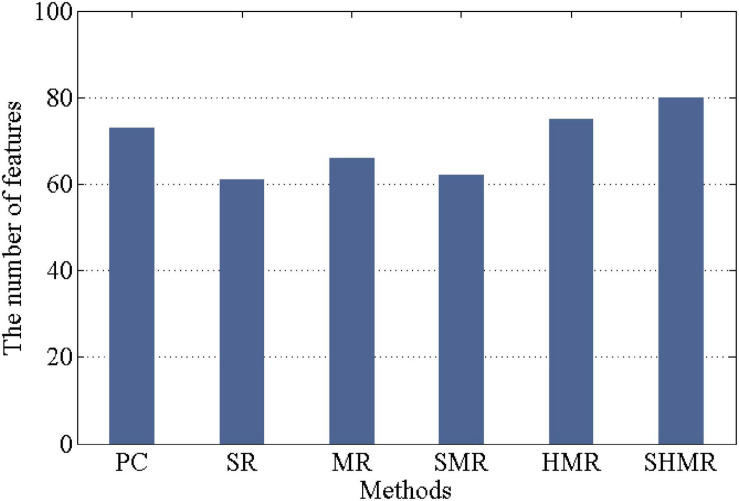
Brain functional networks (BFNs) constructed via manifold regularization (MR) have emerged as a powerful tool in finding new biomarkers for brain disease diagnosis. However, they only describe the pair-wise relationship between two brain regions, and cannot describe the functional interaction between multiple brain regions, or the high-order relationship, well. To solve this issue, we propose a method to construct dynamic BFNs (DBFNs) via hyper-graph MR (HMR) and employ it to classify mild cognitive impairment (MCI) subjects. First, we construct DBFNs via Pearson's correlation (PC) method and remodel the PC method as an optimization model. Then, we use k-nearest neighbor (KNN) algorithm to construct the hyper-graph and obtain the hyper-graph manifold regularizer based on the hyper-graph. We introduce the hyper-graph manifold regularizer and the L1-norm regularizer into the PC-based optimization model to optimize DBFNs and obtain the final sparse DBFNs (SDBFNs). Finally, we conduct classification experiments to classify MCI subjects from normal subjects to verify the effectiveness of our method. Experimental results show that the proposed method achieves better classification performance compared with other state-of-the-art methods, and the classification accuracy (ACC), the sensitivity (SEN), the specificity (SPE), and the area under the curve (AUC) reach 82.4946 ± 0.2827%, 77.2473 ± 0.5747%, 87.7419 ± 0.2286%, and 0.9021 ± 0.0007, respectively. This method expands the MR method and DBFNs with more biological significance. It can effectively improve the classification performance of DBFNs for MCI, and has certain reference value for the research and auxiliary diagnosis of Alzheimer's disease (AD).
Keywords: Alzheimer’s disease; dynamic brain functional network; hyper-graph; manifold regularization; mild cognitive impairment.
Copyright © 2021 Ji, Zhang, Shi, Jiao, Wang and Wang.
Conflict of interest statement
The authors declare that the research was conducted in the absence of any commercial or financial relationships that could be construed as a potential conflict of interest.
Figures
Similar articles
-
Constructing Dynamic Functional Networks via Weighted Regularization and Tensor Low-Rank Approximation for Early Mild Cognitive Impairment Classification.Front Cell Dev Biol. 2021 Jan 11;8:610569. doi: 10.3389/fcell.2020.610569. eCollection 2020. Front Cell Dev Biol. 2021. PMID: 33505965 Free PMC article.
-
Hyper-connectivity of functional networks for brain disease diagnosis.Med Image Anal. 2016 Aug;32:84-100. doi: 10.1016/j.media.2016.03.003. Epub 2016 Mar 24. Med Image Anal. 2016. PMID: 27060621 Free PMC article.
-
Neighborhood structure-guided brain functional networks estimation for mild cognitive impairment identification.PeerJ. 2024 Jul 30;12:e17774. doi: 10.7717/peerj.17774. eCollection 2024. PeerJ. 2024. PMID: 39099649 Free PMC article.
-
Weighted Graph Regularized Sparse Brain Network Construction for MCI Identification.Pattern Recognit. 2019 Jun;90:220-231. doi: 10.1016/j.patcog.2019.01.015. Epub 2019 Jan 8. Pattern Recognit. 2019. PMID: 31579345 Free PMC article.
-
Structural magnetic resonance imaging for the early diagnosis of dementia due to Alzheimer's disease in people with mild cognitive impairment.Cochrane Database Syst Rev. 2020 Mar 2;3(3):CD009628. doi: 10.1002/14651858.CD009628.pub2. Cochrane Database Syst Rev. 2020. PMID: 32119112 Free PMC article.
Cited by
-
Functional Connectome Controllability in Patients with Mild Cognitive Impairment after Repetitive Transcranial Magnetic Stimulation of the Dorsolateral Prefrontal Cortex.J Clin Med. 2024 Sep 10;13(18):5367. doi: 10.3390/jcm13185367. J Clin Med. 2024. PMID: 39336854 Free PMC article.
-
Multimodal Classification Framework Based on Hypergraph Latent Relation for End-Stage Renal Disease Associated with Mild Cognitive Impairment.Bioengineering (Basel). 2023 Aug 12;10(8):958. doi: 10.3390/bioengineering10080958. Bioengineering (Basel). 2023. PMID: 37627843 Free PMC article.
-
Dynamic weighted hypergraph convolutional network for brain functional connectome analysis.Med Image Anal. 2023 Jul;87:102828. doi: 10.1016/j.media.2023.102828. Epub 2023 Apr 25. Med Image Anal. 2023. PMID: 37130507 Free PMC article.
-
Multi-Modal Feature Selection with Feature Correlation and Feature Structure Fusion for MCI and AD Classification.Brain Sci. 2022 Jan 5;12(1):80. doi: 10.3390/brainsci12010080. Brain Sci. 2022. PMID: 35053823 Free PMC article.
-
End-stage renal disease accompanied by mild cognitive impairment: A study and analysis of trimodal brain network fusion.PLoS One. 2024 Jun 13;19(6):e0305079. doi: 10.1371/journal.pone.0305079. eCollection 2024. PLoS One. 2024. PMID: 38870175 Free PMC article.
References
-
- Alzheimer’s Association, (2012). Alzheimer’s disease facts and figures. Alzheimers Dement. 8 131–168. - PubMed
LinkOut - more resources
Full Text Sources
Other Literature Sources