. 2021 Mar 31:15:643067.
doi: 10.3389/fnana.2021.643067. eCollection 2021.

Deep Learning-Based Classification of GAD67-Positive Neurons Without the Immunosignal

Affiliations

Deep Learning-Based Classification of GAD67-Positive Neurons Without the Immunosignal

Kotaro Yamashiro et al. Front Neuroanat. .

Abstract

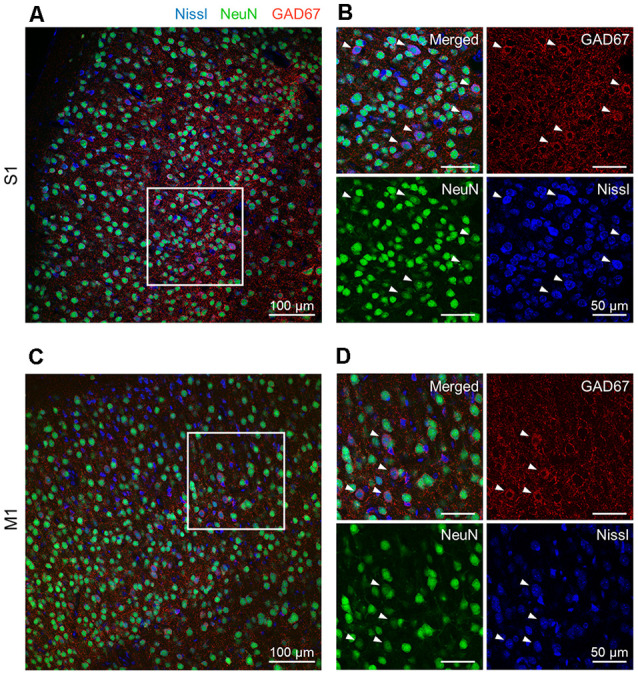
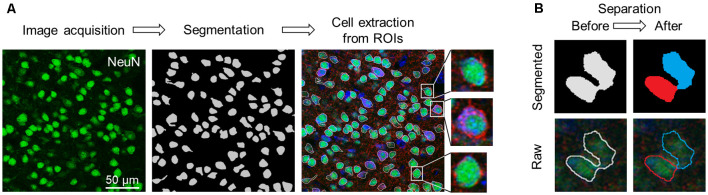
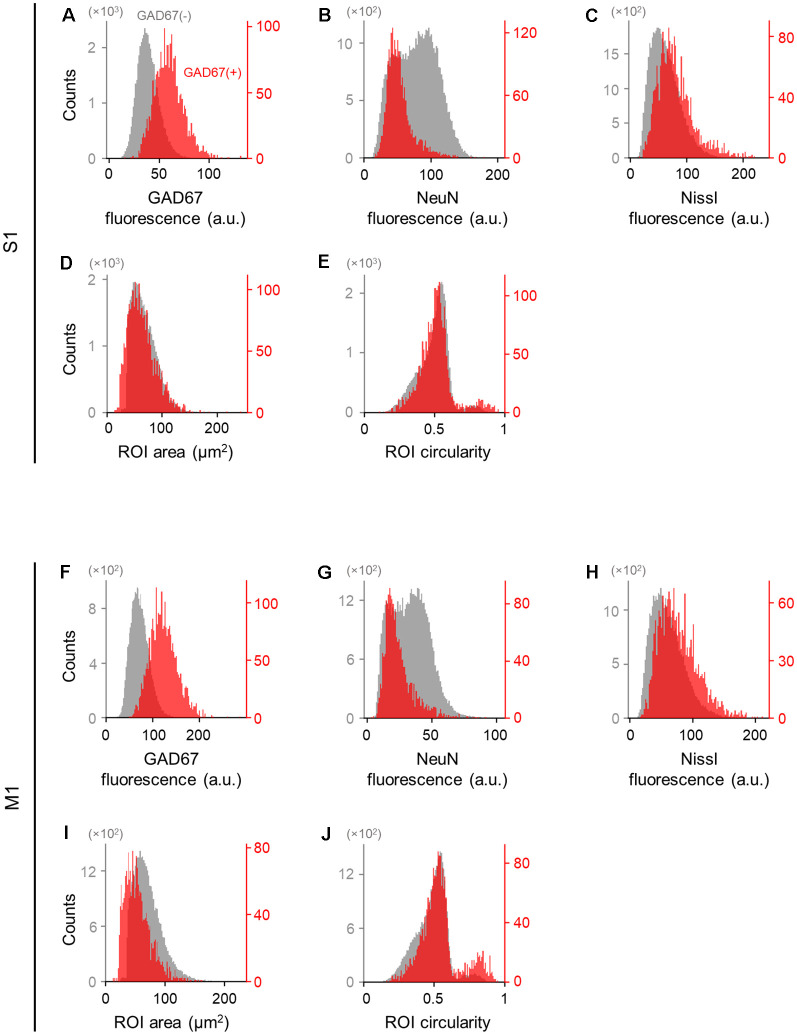
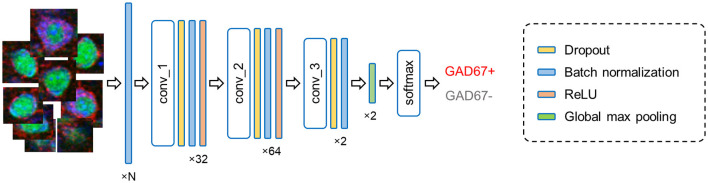
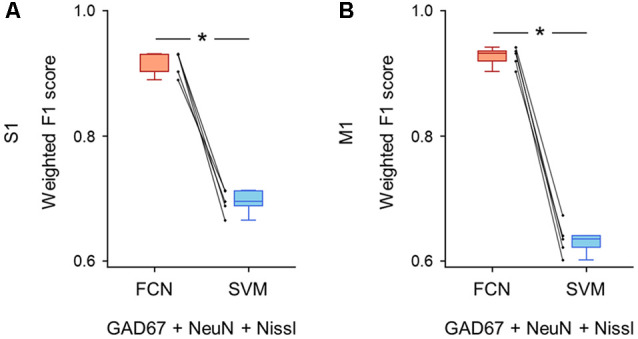
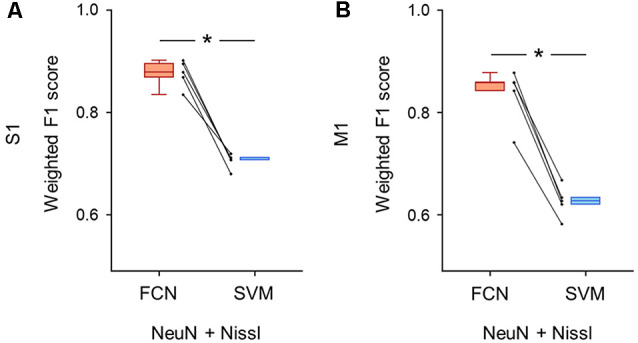
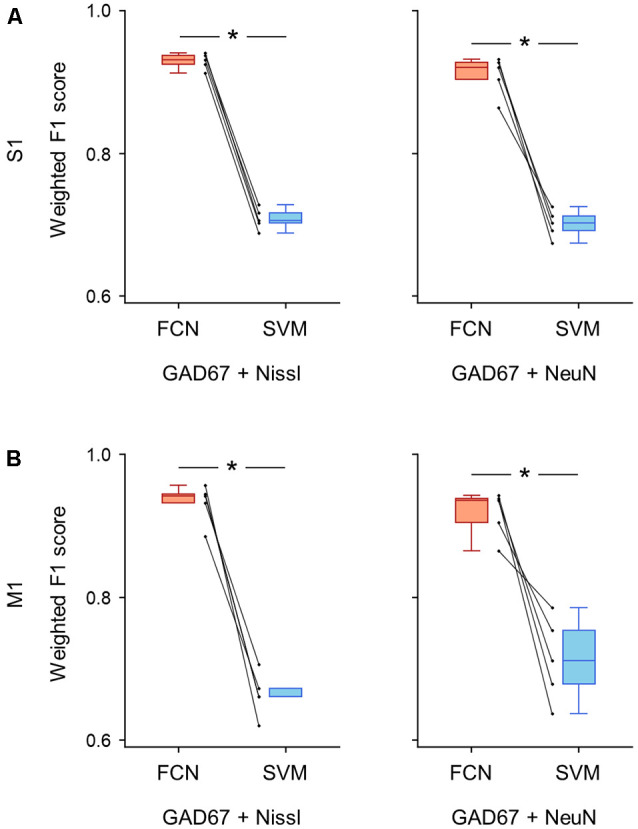
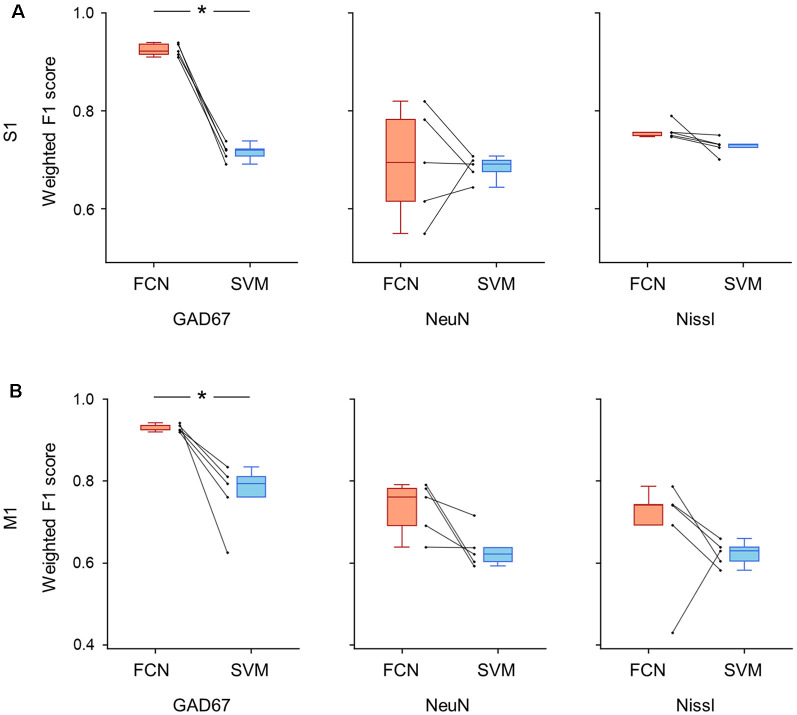
Excitatory neurons and GABAergic interneurons constitute neural circuits and play important roles in information processing. In certain brain regions, such as the neocortex and the hippocampus, there are fewer interneurons than excitatory neurons. Interneurons have been quantified via immunohistochemistry, for example, for GAD67, an isoform of glutamic acid decarboxylase. Additionally, the expression level of other proteins varies among cell types. For example, NeuN, a commonly used marker protein for postmitotic neurons, is expressed differently across brain regions and cell classes. Thus, we asked whether GAD67-immunopositive neurons can be detected using the immunofluorescence signals of NeuN and the fluorescence signals of Nissl substances. To address this question, we stained neurons in layers 2/3 of the primary somatosensory cortex (S1) and the primary motor cortex (M1) of mice and manually labeled the neurons as either cell type using GAD67 immunosignals. We then sought to detect GAD67-positive neurons without GAD67 immunosignals using a custom-made deep learning-based algorithm. Using this deep learning-based model, we succeeded in the binary classification of the neurons using Nissl and NeuN signals without referring to the GAD67 signals. Furthermore, we confirmed that our deep learning-based method surpassed classic machine-learning methods in terms of binary classification performance. Combined with the visualization of the hidden layer of our deep learning algorithm, our model provides a new platform for identifying unbiased criteria for cell-type classification.

Keywords: GAD67; NeuN; deep learning; fully convolutional network; interneuron; motor cortex; mouse; somatosensory cortex.


Conflict of interest statement

The authors declare that the research was conducted in the absence of any commercial or financial relationships that could be construed as a potential conflict of interest.

Figures

Figure 1
Figure 1
Representative photographs of GAD67 and NeuN immunoreactivity in the S1 and the M1 of mice. (A) Representative image (1,024 × 1,024 pixels, 16-bit intensity, 20×) of a section of S1 immunostained with GAD67 (red) and NeuN (green) and counterstained with Nissl (blue). (B) Magnified image of the boxed area (white). High-magnification images of merged (top, left), anti-GAD67 (top, right), anti-NeuN (bottom, left), and Nissl (bottom, right). White arrowheads point to GAD67-positive cells. (C) The same as (A), but for M1. (D) The same as (B), but for M1. Abbreviations: S1, primary somatosensory cortex; M1, primary motor cortex.
Figure 2
Figure 2
Flowchart of image acquisition and preprocessing. (A) Workflow of cell extraction using the pre-trained segmentation network. (B) Diagram of the erosion-dilation algorithm. ROIs that enclosed multiple cells (left; pale gray) were separated into two or more parts (right; blue and red). Top: Segmented images. Bottom: Raw images. Abbreviation: ROI, region of interest.
Figure 3
Figure 3
Differences in the immunofluorescence and shape of GAD67-positive and GAD67-negative cells in the primary somatosensory and motor cortices. (A) Histogram of the fluorescence of anti-GAD67 signals of manually annotated GAD67-positive (red) and -negative (gray) neurons in S1. (B) The same as (A), but for anti-NeuN immunofluorescence signals. (C) The same as (A), but for Nissl fluorescence signals. (D) The same as (A), but for the area of individual neurons (i.e., ROIs). (E) The same as (A), but for the circularity of individual neurons (i.e., ROIs). (F–J) The same as (A–E), respectively, but for M1. Abbreviations: S1, primary somatosensory cortex; M1, primary motor cortex; ROI, region of interest.
Figure 4
Figure 4
Fully convolutional network architecture. The current model processes input cell images (leftmost) in multiple layers and outputs the results of the binary classification (rightmost). The numbers (bottom) imply the channel features in each layer; note that N represents the number of fluorescence channels and thus ranges from 1 to 3. Abbreviation: conv, convolutional layer.
Figure 5
Figure 5
Classification performance of cell images using triple fluorescent signals. (A) Weighted F1 score of the FCN model (red) and the PCA-SVM classifier (blue) trained on cell images from S1. All three fluorescent signals (i.e., anti-GAD67, anti-NeuN, and Nissl) were used for training. Each point (gray) signifies the score for the cross-validation (5-fold). P = 1.3 × 10⁻⁴, t(4) = 14.7, n = 5-fold cross-validations, paired t-test. *P < 0.05. (B) The same as (A), but for M1. P = 1.4 × 10⁻⁵, t(4) = 25.6, n = 5-fold cross-validations, paired t-test. *P < 0.05. Abbreviations: S1, primary somatosensory cortex; M1, primary motor cortex; FCN, fully convolutional network; SVM, support vector machine; PCA, principal component analysis.
Figure 6
Figure 6
Classification performance of cell images using both anti-NeuN and Nissl fluorescence signals. (A) Weighted F1 score of the FCN model (red) and the PCA-SVM classifier (blue) trained on cell images from S1. Two fluorescent signals (i.e., anti-NeuN and Nissl) were used for training. Each point (gray) signifies the score for the cross-validation (5-fold). P = 3.0 × 10⁻⁴, t(4) = 11.7, n = 5-fold cross-validations, paired t-test. *P < 0.05. (B) The same as (A), but for M1. P = 1.9 × 10⁻⁴, t(4) = 13.2, n = 5-fold cross-validations, paired t-test. *P < 0.05. Abbreviations: S1, primary somatosensory cortex; M1, primary motor cortex; FCN, fully convolutional network; SVM, support vector machine; PCA, principal component analysis.
Figure 7
Figure 7
Classification performance of cell images using signal pairs including anti-GAD67 fluorescence. (A) Weighted F1 score of the FCN model (red) and the PCA-SVM classifier (blue) trained on cell images from S1. Each point (gray) signifies the score for cross-validation (5-fold). Left: classification performance using anti-GAD67 and Nissl fluorescence signals. P = 9.9 × 10⁻⁷, t(4) = 46.9, n = 5-fold cross-validations, paired t-test. *P < 0.05. Right: the same as on the left, but for anti-GAD67 and anti-NeuN immunofluorescence signals. P = 4.1 × 10⁻⁴, t(4) = 10.8, n = 5-fold cross-validations, paired t-test. *P < 0.05. (B) The same as (A), but for M1. Left: P = 2.8 × 10⁻⁴, t(4) = 12.0, n = 5-fold cross-validations, paired t-test. *P < 0.05. Right: P = 6.8 × 10⁻³, t(4) = 5.1, n = 5-fold cross-validations, paired t-test. *P < 0.05. Abbreviations: S1, primary somatosensory cortex; M1, primary motor cortex; FCN, fully convolutional network; SVM, support vector machine; PCA, principal component analysis.
Figure 8
Figure 8
Classification performance of cell images using single fluorescent signals. (A) Weighted F1 score of the FCN model (red) and the PCA-SVM classifier (blue) trained on cell images from S1. Left: classification performance using an anti-GAD67 signal. Each point (gray) signifies the score for the cross-validation (5-fold). P = 5.6 × 10⁻⁵, t(4) = 18.0, n = 5-fold cross-validations, paired t-test. *P < 0.05. Middle, the same as on the left, but for an anti-NeuN signal. P = 0.87, t(4) = 0.18, n = 5-fold cross-validations, paired t-test. Right: the same as on the left, but for a Nissl signal. P = 0.09, t(4) = 2.18, n = 5-fold cross-validations, paired t-test. (B) The same as (A), but for M1. Left, P = 0.01, t(4) = 4.1, n = 5-fold cross-validations, paired t-test. *P < 0.05. Middle, P = 0.06, t(4) = 2.6, n = 5-fold cross-validations, paired t-test. Right, P = 0.22, t(4) = 1.45, n = 5-fold cross-validations, paired t-test. Abbreviations: S1, primary somatosensory cortex; M1, primary motor cortex; FCN, fully convolutional network; SVM, support vector machine; PCA, principal component analysis.

Similar articles

Cited by

References

    1. Al-Kofahi Y., Zaltsman A., Graves R., Marshall W., Rusu M. (2018). A deep learning-based algorithm for 2-D cell segmentation in microscopy images. BMC Bioinformatics 19:365. 10.1186/s12859-018-2375-z - DOI - PMC - PubMed
    1. Benes F. M., Berretta S. (2001). GABAergic interneurons: implications for understanding schizophrenia and bipolar disorder. Neuropsychopharmacology 25, 1–27. 10.1016/S0893-133X(01)00225-1 - DOI - PubMed
    1. Bryson A., Hatch R. J., Zandt B.-J., Rossert C., Berkovic S. F., Reid C. A., et al. . (2020). GABA-mediated tonic inhibition differentially modulates gain in functional subtypes of cortical interneurons. Proc. Natl. Acad. Sci. U S A 117, 3192–3202. 10.1073/pnas.1906369117 - DOI - PMC - PubMed
    1. Buzsáki G., Geisler C., Henze D. A., Wang X.-J. (2004). Interneuron diversity series: circuit complexity and axon wiring economy of cortical interneurons. Trends Neurosci. 27, 186–193. 10.1016/j.tins.2004.02.007 - DOI - PubMed
    1. Cardin J. A. (2018). Inhibitory interneurons regulate temporal precision and correlations in cortical circuits. Trends Neurosci. 41, 689–700. 10.1016/j.tins.2018.07.015 - DOI - PMC - PubMed

LinkOut - more resources