. 2021 Mar 31:15:641335.
doi: 10.3389/fncom.2021.641335. eCollection 2021.

Optimal Organization of Functional Connectivity Networks for Segregation and Integration With Large-Scale Critical Dynamics in Human Brains

Affiliations

Optimal Organization of Functional Connectivity Networks for Segregation and Integration With Large-Scale Critical Dynamics in Human Brains

Xinchun Zhou et al. Front Comput Neurosci. .

Abstract

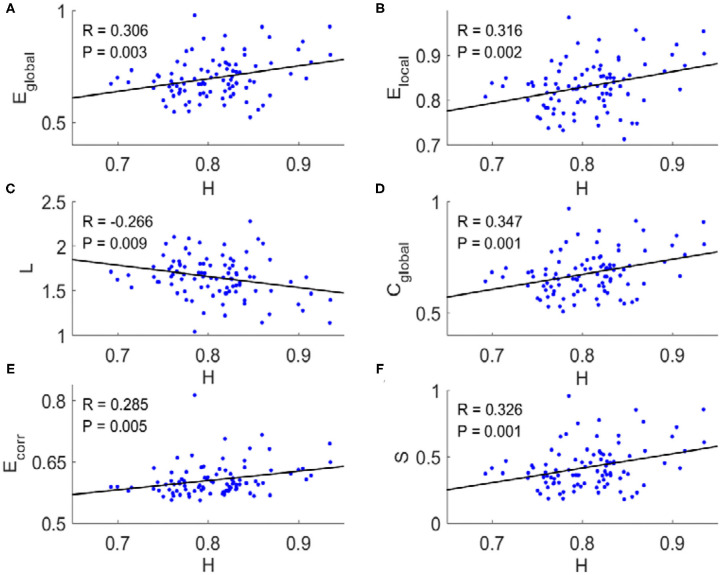
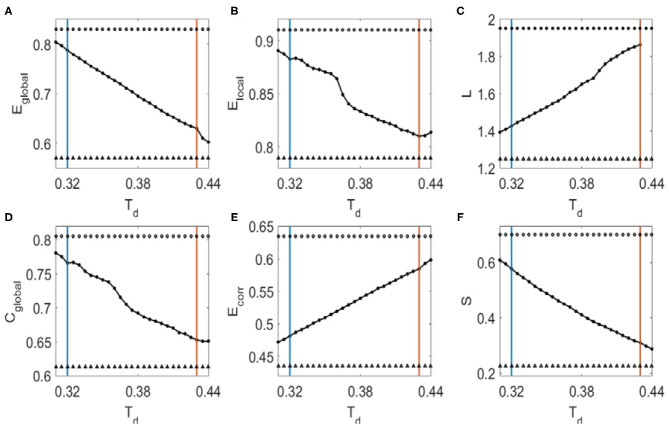
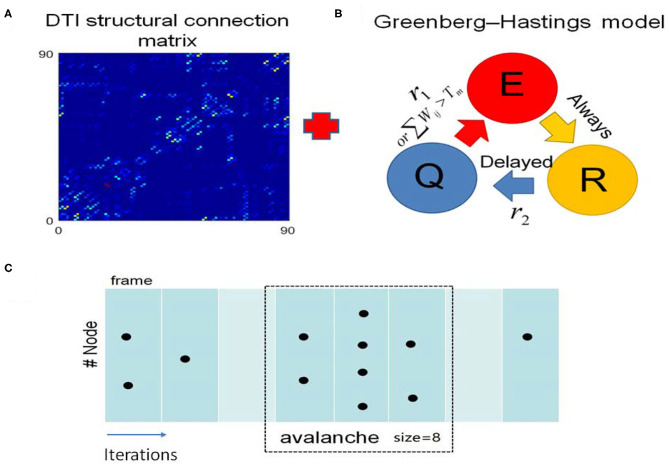
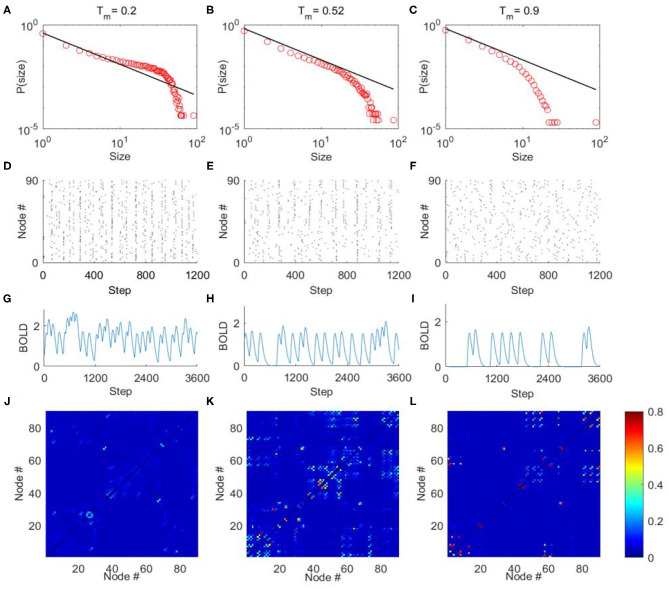
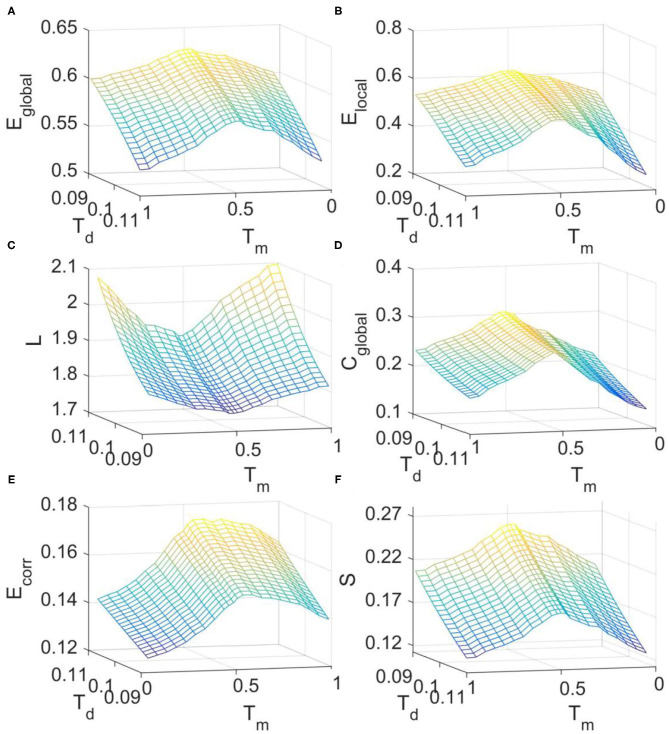
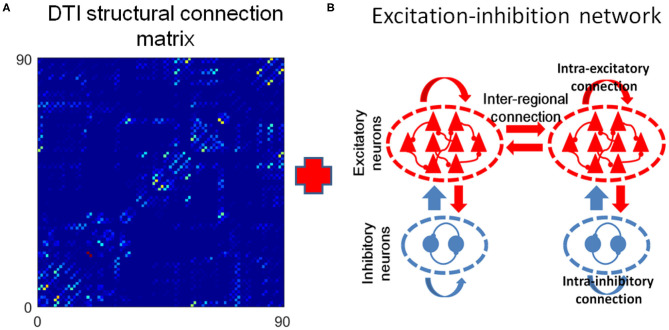
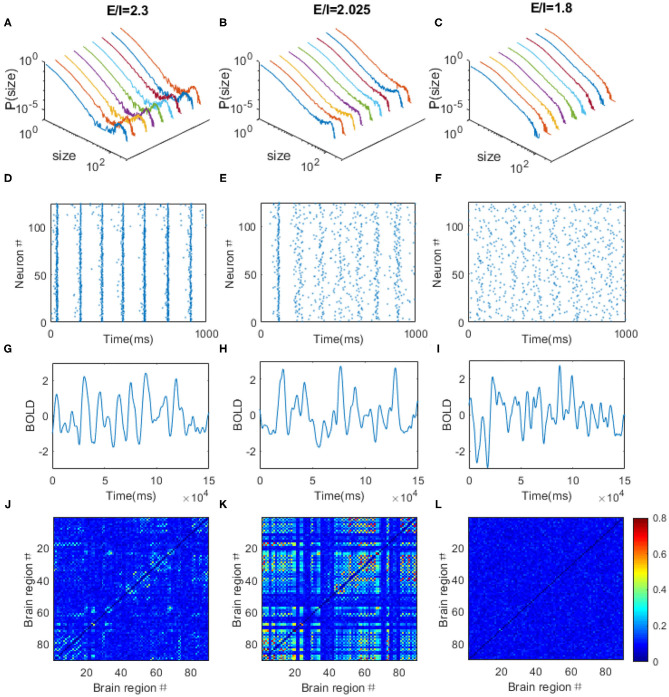
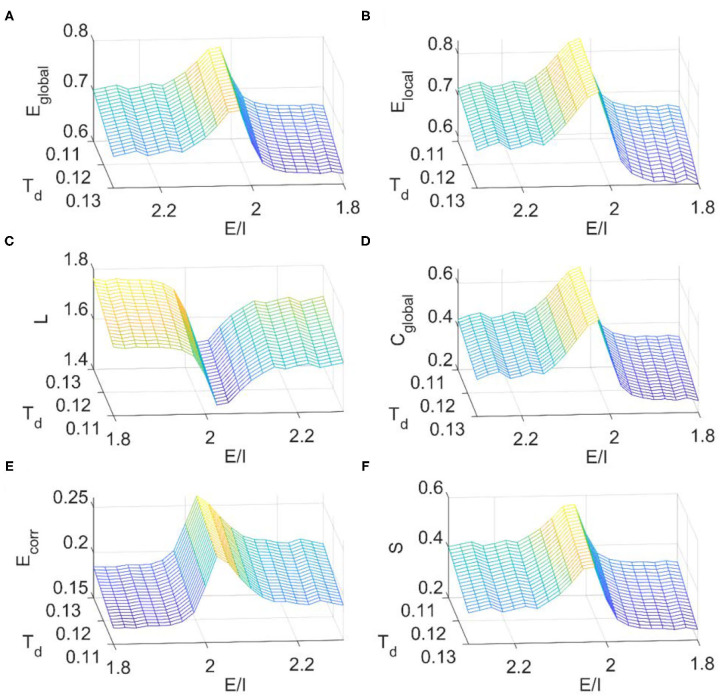
The optimal organization for functional segregation and integration in brain is made evident by the "small-world" feature of functional connectivity (FC) networks and is further supported by the loss of this feature that has been described in many types of brain disease. However, it remains unknown how such optimally organized FC networks arise from the brain's structural constrains. On the other hand, an emerging literature suggests that brain function may be supported by critical neural dynamics, which is believed to facilitate information processing in brain. Though previous investigations have shown that the critical dynamics plays an important role in understanding the relation between whole brain structural connectivity and functional connectivity, it is not clear if the critical dynamics could be responsible for the optimal FC network configuration in human brains. Here, we show that the long-range temporal correlations (LRTCs) in the resting state fMRI blood-oxygen-level-dependent (BOLD) signals are significantly correlated with the topological matrices of the FC brain network. Using structure-dynamics-function modeling approach that incorporates diffusion tensor imaging (DTI) data and simple cellular automata dynamics, we showed that the critical dynamics could optimize the whole brain FC network organization by, e.g., maximizing the clustering coefficient while minimizing the characteristic path length. We also demonstrated with a more detailed excitation-inhibition neuronal network model that loss of local excitation-inhibition (E/I) balance causes failure of critical dynamics, therefore disrupting the optimal FC network organization. The results highlighted the crucial role of the critical dynamics in forming an optimal organization of FC networks in the brain and have potential application to the understanding and modeling of abnormal FC configurations in neuropsychiatric disorders.

Keywords: DTI; E/I ratio; Greenberg-Hasting model; criticality; fMRI; functional connection networks.


Conflict of interest statement

The authors declare that the research was conducted in the absence of any commercial or financial relationships that could be construed as a potential conflict of interest.

Figures

Figure 1
Figure 1
Scatter plots with trend line showing the dependence of topological metrics of FC network on Hurst exponents. (A) Global efficiency. (B) Local efficiency. (C) Characteristic path length. (D) Clustering coefficient. (E) Mean connection strength. (F) Sparsity. The topological metrics of FC networks were calculated with threshold Td = 0.4. Pearson correlation coefficient (R) for all six topological metrics were significant (p < 0.01).
Figure 2
Figure 2
The dependence of topological metrics of the FC networks and their correlations with Hurst exponents on the threshold Td. (A) Global efficiency. (B) Local efficiency. (C) Characteristic path length. (D) Clustering coefficient. (E) Mean connection strength. (F) Sparsity. The red vertical lines mark the upper criteria above which there is no isolated node in the network, and the blue vertical lines mark the lower criteria below which the global efficiency curve for the brain networks is less than the global efficiency curve for the random networks. Open circles indicate that the correlation coefficients between the Hurst exponent and the corresponding topological metrics are larger than 0.26, where filled circles mark the correlation coefficients that is smaller than −0.26. Triangles mark the corresponding p-values of the correlation analysis that is significant (p < 0.01).
Figure 3
Figure 3
The DTI+GH whole brain model. (A) The DTI structural connection matrix. (B) The Greenberg-Hastings (GH) cellular automaton model for dynamics of each brain region. The GH model has three states: quiescent (Q), excitation (E), and refractory (R). The colored arrows indicated the transition between these states. The transition from Q to E can happen with a small probability r1, or if the sum of the connection weights wij with the active neighbors j is higher than a threshold Tm. Once the system is excited, it always goes to R. Then it transits from R to Q with a probability r2 after several steps of delaying. (C) Demonstration of the method to extract avalanches from simulation of the whole brain model. The spatial activity in several simulation step is assigned as a frame (consecutive frames are divided by white lines). An avalanche is defined as the consecutive frames that are preceded by a blank frame (in which no activation occurs, marked with light cyan) and ended by a blank frame. The avalanche size is the total number of excited nodes in this avalanche. Black dots represent the excited nodes that are in the state E.
Figure 4
Figure 4
The avalanche activity in the DTI+GH brain network model, the simulated BOLD signals, and FC matrices. Through tuning the excitation threshold Tm, the mode can exhibit typical avalanche distribution corresponding to supercritical (A), critical (B), and subcritical (C) dynamics. The horizontal axes are the size of avalanches, and vertical axes are the corresponding probability. The black lines in (AC) indicate power law with exponent = −1.5. (DF) The raster plots of spatial-temporal excitation distributions corresponding to (AC). The dots in the raster plots represent the excitation of the nodes (i.e., in state E). (GL) The typical simulated BOLD signals of an arbitrarily chosen nodes and simulated FC matrices from the DTI+GH brain model in the supercritical (G,J), critical (H,K), and subcritical (I,L) regimes. Scale bar indicates the FC strength among the nodes in the model. The parameters of GH model in simulations are r1 = 0.005, r2 = 0.98, and ndelay = 55.
Figure 5
Figure 5
The dependence of FC network topological metrics simulated with DTI+GH model on the excitation threshold Tm and binarizing threshold Td. (A) Global efficiency. (B) Local efficiency. (C) Characteristic path length. (D) Clustering coefficient. (E) Mean connection strength. (F) Sparsity. The results were obtained by averaging results from 1,000 times of simulation. In each simulation, the obtained raw BOLD signals were sampled every 140 iteration steps to achieve the simulated BOLD time series of 200 time points.
Figure 6
Figure 6
The DTI+EI whole brain model. (A) The DTI structural connection matrix. (B) Example of two excitation-inhibition (EI) neuronal networks that represent two brain regions. Each regional neuron network consists of one excitation neuron pool and one inhibitory neuron pool. They are 80% excitatory neurons and 20% inhibitory neurons in the network. The excitatory neurons send our only excitatory synapses to other neurons and the inhibitory neurons send out only inhibitory synapses. The two EI networks are coupled only by excitatory inter-regional connections.
Figure 7
Figure 7
The dynamical behaviors of the DTI+EI brain model. Through tuning the E/I ratio, the model can exhibits supercritical (A), critical (B), and subcritical (C) avalanche dynamics in each regions. Colored lines are corresponding to different brain regions chosen arbitrarily. (DF) The raster plots of spatial-temporal firing distributions of an arbitrarily chosen brain regions corresponding to (AC). The firings are more synchronized in the supercritical regions (D), but the firings are rather random when the system is subcritical with decreased excitatory connections (F). The critical dynamics is characterized with moderate synchrony (E). The dots in the raster plots indicate the firing of the neurons. (GL) The typical simulated BOLD signals of an arbitrarily chosen brain region and simulated FC matrices from the DTI+EI brain model in the supercritical (G,J), critical (H,K) and subcritical (I,L) regimes. Scale bar indicates the FC strength among the nodes in the model.
Figure 8
Figure 8
The dependence of topological metrics of the FC network on the thresholding value Td and E/I ratio in the DTI+EI whole brain model. (A) Global efficiency. (B) Local efficiency. (C) Characteristic path length. (D) Clustering coefficient. (E) Mean connection strength. (F) Sparsity. The results were obtained by averaging results from 10 times of simulation. Each simulation last for 480 s with a time step of 1 ms and the first 180 s was removed for stability. The obtained raw BOLD signals were then normalized and sampled at a rate of 0.5 Hz.

Similar articles

Cited by

References

    1. Achard S., Bullmore E. (2007). Efficiency and cost of economical brain functional networks. PLoS Comput. Biol. 3:e17. 10.1371/journal.pcbi.0030017 - DOI - PMC - PubMed
    1. Bassett D. S., Bullmore E. (2006). Small-world brain networks. Neuroscientist 12, 512–523. 10.1177/1073858406293182 - DOI - PubMed
    1. Beggs J. M., Plenz D. (2003). Neuronal avalanches in neocortical circuits. J. Neurosci. 23, 11167–11177. 10.1523/JNEUROSCI.23-35-11167.2003 - DOI - PMC - PubMed
    1. Blythe D. A. J., Nikulin V. V. (2017). Long-range temporal correlations in neural narrowband time-series arise due to critical dynamics. PLoS ONE 12:e0175628. 10.1371/journal.pone.0175628 - DOI - PMC - PubMed
    1. Canitano R., Pallagrosi M. (2017). Autism spectrum disorders and schizophrenia spectrum disorders: excitation/inhibition imbalance and developmental trajectories. Front. Psychiatry. 8:69. 10.3389/fpsyt.2017.00069 - DOI - PMC - PubMed

LinkOut - more resources