

T Cell Receptor Repertoires Acquired via Routine Pap Testing May Help Refine Cervical Cancer and Precancer Risk Estimates
- PMID: 33868241
- PMCID: PMC8050337
- DOI: 10.3389/fimmu.2021.624230
T Cell Receptor Repertoires Acquired via Routine Pap Testing May Help Refine Cervical Cancer and Precancer Risk Estimates
Abstract
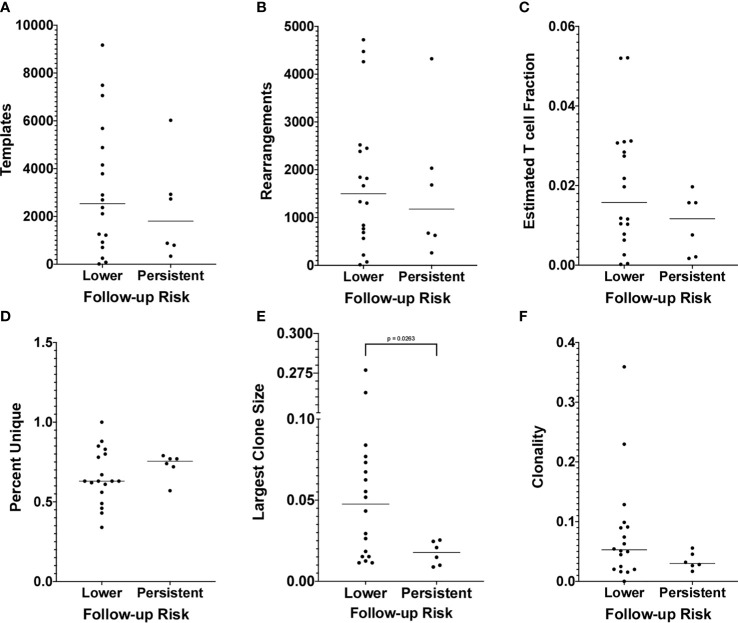
Cervical cancer is the fourth most common cancer and fourth leading cause of cancer death among women worldwide. In low Human Development Index settings, it ranks second. Screening and surveillance involve the cytology-based Papanicolaou (Pap) test and testing for high-risk human papillomavirus (hrHPV). The Pap test has low sensitivity to detect precursor lesions, while a single hrHPV test cannot distinguish a persistent infection from one that the immune system will naturally clear. Furthermore, among women who are hrHPV-positive and progress to high-grade cervical lesions, testing cannot identify the ~20% who would progress to cancer if not treated. Thus, reliable detection and treatment of cancers and precancers requires routine screening followed by frequent surveillance among those with past abnormal or positive results. The consequence is overtreatment, with its associated risks and complications, in screened populations and an increased risk of cancer in under-screened populations. Methods to improve cervical cancer risk assessment, particularly assays to predict regression of precursor lesions or clearance of hrHPV infection, would benefit both populations. Here we show that women who have lower risk results on follow-up testing relative to index testing have evidence of enhanced T cell clonal expansion in the index cervical cytology sample compared to women who persist with higher risk results from index to follow-up. We further show that a machine learning classifier based on the index sample T cells predicts this transition to lower risk with 95% accuracy (19/20) by leave-one-out cross-validation. Using T cell receptor deep sequencing and machine learning, we identified a biophysicochemical motif in the complementarity-determining region 3 of T cell receptor β chains whose presence predicts this transition. While these results must still be tested on an independent cohort in a prospective study, they suggest that this approach could improve cervical cancer screening by helping distinguish women likely to spontaneously regress from those at elevated risk of progression to cancer. The advancement of such a strategy could reduce surveillance frequency and overtreatment in screened populations and improve the delivery of screening to under-screened populations.
Keywords: cervical cancer screening; cervical cancer surveillance; immune repertoire; machine learning; regression biomarker.
Copyright © 2021 Christley, Ostmeyer, Quirk, Zhang, Sirak, Giuliano, Zhang, Monson, Tiro, Lucas and Cowell.
Conflict of interest statement
The authors declare that the research was conducted in the absence of any commercial or financial relationships that could be construed as a potential conflict of interest.
Figures


Similar articles
-
HPV Screening Test for the Detection of Precancerous Cervical Lesions and Cervical Cancer in Israeli Women.Acta Cytol. 2021;65(6):494-500. doi: 10.1159/000518324. Epub 2021 Aug 24. Acta Cytol. 2021. PMID: 34515031
-
Very low human Papillomavirus DNA prevalence in mature women with negative computer-imaged liquid-based Pap tests.Cancer. 2007 Oct 25;111(5):292-7. doi: 10.1002/cncr.22949. Cancer. 2007. PMID: 17879368
-
Randomized controlled trial of human papillomavirus testing versus Pap cytology in the primary screening for cervical cancer precursors: design, methods and preliminary accrual results of the Canadian cervical cancer screening trial (CCCaST).Int J Cancer. 2006 Aug 1;119(3):615-23. doi: 10.1002/ijc.21897. Int J Cancer. 2006. PMID: 16572425 Clinical Trial.
-
Testing for human papillomavirus in cervical cancer screening: a review of indications and methodology.Cancer Cytopathol. 2011 Aug 25;119(4):219-27. doi: 10.1002/cncy.20161. Epub 2011 Jun 29. Cancer Cytopathol. 2011. PMID: 21717588 Review.
-
Cervical Cancer: Precursors and Prevention.Hematol Oncol Clin North Am. 2024 Aug;38(4):771-781. doi: 10.1016/j.hoc.2024.03.005. Epub 2024 May 16. Hematol Oncol Clin North Am. 2024. PMID: 38760198 Review.
Cited by
-
AI and immunology as a new research paradigm.Nat Immunol. 2024 Nov;25(11):1993-1996. doi: 10.1038/s41590-024-01974-y. Nat Immunol. 2024. PMID: 39367122 No abstract available.
-
Dynamic kernel matching for non-conforming data: A case study of T cell receptor datasets.PLoS One. 2023 Mar 7;18(3):e0265313. doi: 10.1371/journal.pone.0265313. eCollection 2023. PLoS One. 2023. PMID: 36881590 Free PMC article.
-
Machine and Deep Learning for the Diagnosis, Prognosis, and Treatment of Cervical Cancer: A Scoping Review.Diagnostics (Basel). 2025 Jun 17;15(12):1543. doi: 10.3390/diagnostics15121543. Diagnostics (Basel). 2025. PMID: 40564863 Free PMC article. Review.
References
Publication types
MeSH terms
Substances
Grants and funding
LinkOut - more resources
Full Text Sources
Other Literature Sources
Medical
Research Materials
Miscellaneous