. 2021 Apr 1:12:628512.
doi: 10.3389/fimmu.2021.628512. eCollection 2021.

RNA-Seq Identifies Marked Th17 Cell Activation and Altered CFTR Expression in Different Atopic Dermatitis Subtypes in Chinese Han Populations

Affiliations

RNA-Seq Identifies Marked Th17 Cell Activation and Altered CFTR Expression in Different Atopic Dermatitis Subtypes in Chinese Han Populations

Xin Tian et al. Front Immunol. .

Abstract

Background: Patients with atopic dermatitis (AD) exhibit phenotypic variability in ethnicity and IgE status. In addition, some patients develop other allergic conditions, such as allergic rhinitis (AR), in subsequent life. Understanding the heterogeneity of AD would be beneficial to phenotype-specific therapies.

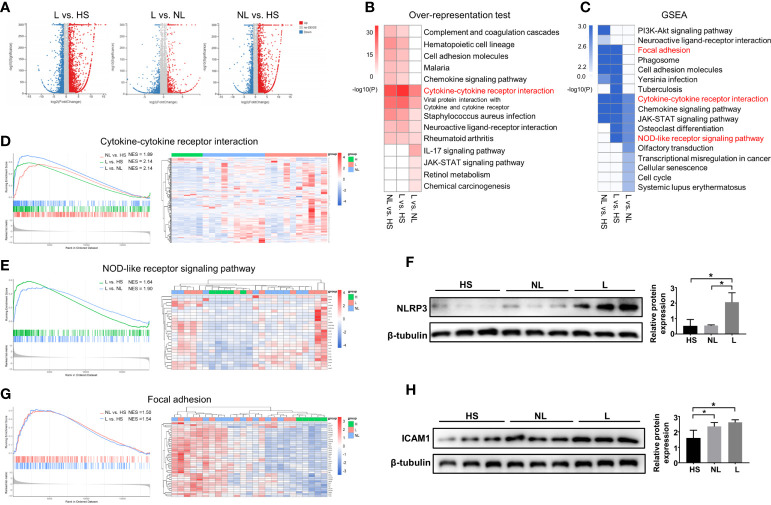
Methods: Twenty-eight Chinese AD patients and 8 healthy volunteers were enrolled in the study. High-throughput transcriptome sequencing was conducted on lesional and nonlesional skin samples from 10 AD patients and matched normal skin samples from 5 healthy volunteers. Identification of differentially expressed genes (DEGs), KEGG pathway analyses, and sample cluster analyses were conducted in the R software environment using the DEseq2, ClusterProfiler, and pheatmap R packages, respectively. qRT-PCR, Western blotting, and ELISA were used to detect gene expression levels among subtypes. Correlation analysis was performed to further investigate their correlation with disease severity.

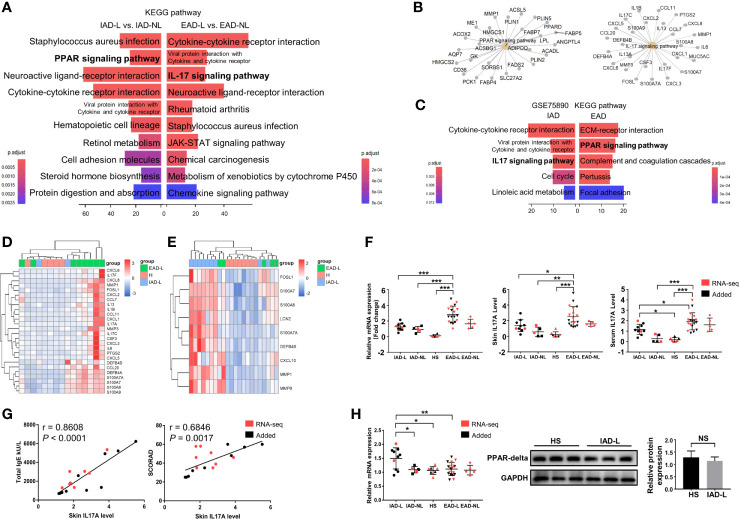
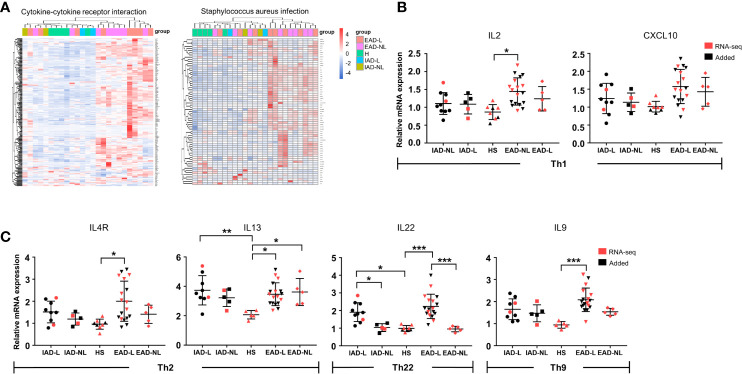
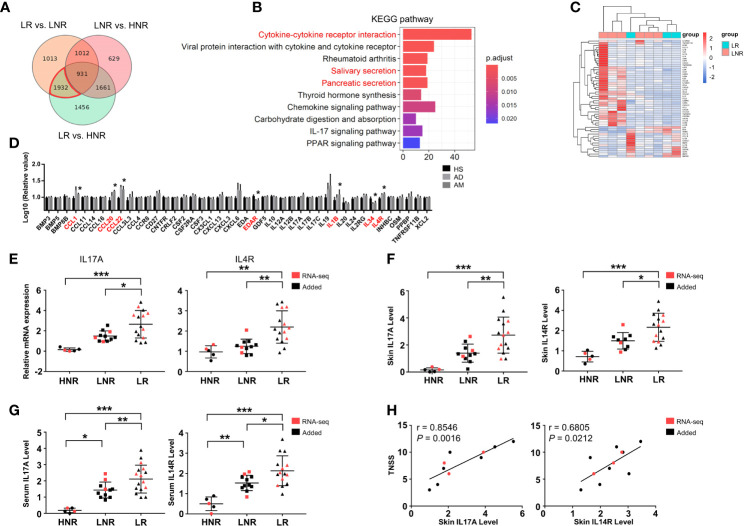
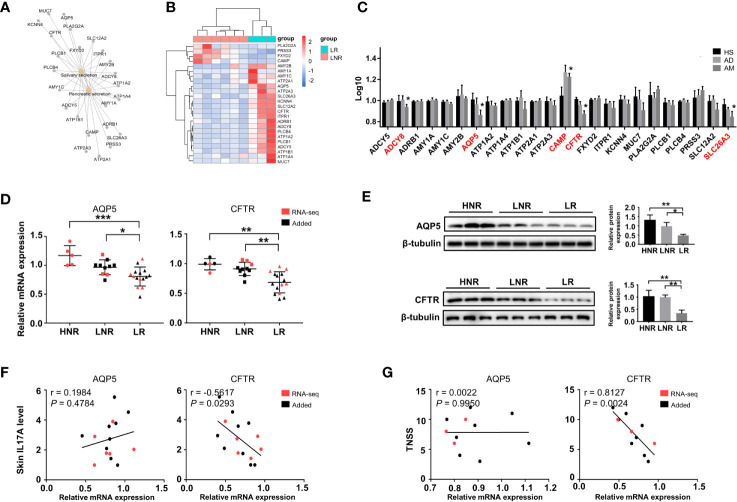
Results: A total of 25,798 genes were detected per sample. Subgroup differential expression analysis and functional enrichment analysis revealed significant changes in the IL17 signaling pathway in Chinese EAD patients but not in IAD patients. DEGs enriched in cytokine-cytokine receptor interactions and gland secretion were considered to be associated with atopic march. Further investigations confirmed a marked IL17A upregulation in Chinese EAD with a positive relationship with total IgE level and AD severity. In addition, increased IL17A in AD patients with AR demonstrated a closer association with AR severity than IL4R. Moreover, AQP5 and CFTR were decreased in the lesions of AD patients with AR. The CFTR mRNA expression level was negatively associated with the skin IL17A level and AR severity.

Conclusion: Our research characterized marked Th17 activation in Chinese EAD patients, and altered expression of IL17A, IL4R, AQP5, and CFTR in AD patients with AR was associated with AR severity. It partially explained the phenotypic differences of AD subtypes and provided potential references for endotype-targeted therapy.

Keywords: atopic dermatitis; atopic march; extrinsic AD; heterogeneity; intrinsic AD.


Conflict of interest statement

The authors declare that the research was conducted in the absence of any commercial or financial relationships that could be construed as a potential conflict of interest.

Figures

Figure 1
Figure 1
DEG identification and KEGG enrichment pathway analyses between the HS and NL groups, HS and L groups, and NL and L groups. (A) Volcano plot of DEGs between the L and HS groups, the L and NL groups, and the NL and HS groups identified by differential expression analyses. HS group (n = 5), NL group (n = 10), and L group (n = 10). (B) Top 10 enriched KEGG pathways analysis by overrepresentation test and (C) by GSEA among the three groups. (P < 0.05) The GSEA enrichment plot and the sample cluster analyses based on the expression pattern of involved DEGs of (D) cytokine-cytokine receptor interaction, (E) NOD-like receptor signaling pathway, and (G) focal adhesion. Western blot and quantitative analysis of (F) NLRP3 and (H) ICAM1 among the HS (n = 3), NL (n = 3), and L (n = 3) groups. *P < 0.05 according to one-way ANOVA followed by Tukey's multiple comparisons.
Figure 2
Figure 2
KEGG pathway enrichment analysis of DEGs in intrinsic and extrinsic AD. (A) Top 10 enriched KEGG pathways of the DEGs involved in Chinese IAD and EAD patients, P < 0.05. (B) The interaction networks of IAD- and EAD-specific pathways and the DEGs involved. (C) Top 5 enriched KEGG pathways of the DEGs involved in Denmark IAD and EAD patients, P < 0.05. (D) Sample cluster analyses based on the expression pattern of DEGs involved in the IL-17 signaling pathway in the Chinese Han population (HS group (n = 5), IAD-L group (n = 2), EAD-L group (n = 8)], and (E) in the Denmark population [HS group (n = 8), IAD-L group (n = 9), EAD-L group (n = 5)]. (F) The IL17A expression level in the skin and serum in the Chinese Han population [HS group (n = 8), IAD-L group (n = 10), IAD-NL group (n = 5), EAD-L group (n = 18), EAD-NL group (n = 5)]. (G) The correlation of skin IL17A levels with total IgE and SCORAD (n = 18). (H) The mRNA [HS group (n = 8), IAD-L group (n = 10), IAD-NL group (n = 5), EAD-L group (n = 18), EAD-NL group (n = 5)], protein expression level and quantitative analysis [HS group (n = 3), IAD-NL group (n = 3)] of PPARG. NS, no significance, *P < 0.05, **P < 0.01, ***P < 0.001 according to Student’s t-test analysis or one-way ANOVA followed by Tukey’s multiple comparisons.
Figure 3
Figure 3
Cytokine levels in Chinese intrinsic and extrinsic AD patients. (A) Sample cluster analyses based on the expression pattern of DEGs involved in cytokine-cytokine receptor interactions and Staphylococcus aureus infection [HS group (n = 5), IAD-L group (n = 2), IAD-NL group (n = 2), EAD-L group (n = 8), EAD-NL group (n = 8)]. (B, C) The mRNA expression levels of cytokines involved in Th1, Th2, Th22, and Th9 cells in the skin [HS group (n = 8), IAD-L group (n = 10), IAD-NL group (n = 5), EAD-L group (n = 18), EAD-NL group (n = 5)]. *P < 0.05, **P < 0.01, ***P < 0.001 according to one-way ANOVA followed by Tukey’s multiple comparisons.
Figure 4
Figure 4
Aberrant cytokine identification in lesions of AD patients with atopic march. (A) Vann diagram showing the number of AM-associated genes in the red circle. (B) Top 10 enriched KEGG pathways, P < 0.05. (C) Sample cluster analyses based on the expression pattern of DEGs involved in cytokine-cytokine receptor interactions [LNR group (n = 3), LR group (n = 6)]. (D) The expression levels of DEGs enriched in cytokine-cytokine receptor interactions in the microarray of AM [HS group (n = 3), AD group (n = 4), AM group (n = 3)]. (E) The mRNA expression levels of IL17A and IL4R in the skin. (F) The protein expression levels of IL17A and IL4R in the skin and (G) serum [HNR group (n = 5), LNR group (n = 11), LR group (n = 15)]. (H) The correlation of skin IL17A and IL4R with TNSS (n = 11). *P < 0.05, **P < 0.01, ***P < 0.001 according to one-way ANOVA followed by Tukey’s or Dunnett’s multiple comparisons.
Figure 5
Figure 5
Altered expression of genes involved in gland secretion identification in lesions of AD patients with atopic march. (A) The interaction network of salivary and pancreatic secretion and the DEGs involved. (B) Sample cluster analysis based on the expression pattern of the genes enriched in salivary and pancreatic secretion [LNR group (n = 3), LR group (n = 6)]. (C) The expression level of DEGs enriched in gland secretion in the microarray of AM [HS group (n = 3), AD group (n = 4), AM group (n = 3]. (D) The mRNA expression levels of AQP5 and CFTR in the skin [HNR group (n = 5), LNR group (n = 11), LR group (n = 15)]. (E) The protein expression levels and quantitative analysis of AQP5 and CFTR in the skin [HNR group (n = 3), LNR group (n = 3), LR group (n = 3)]. (F) The correlation of AQP5 and CFTR with skin IL17A levels (n = 15). (G) The correlation of AQP5 and CFTR with TNSS (n = 11). *P < 0.05, **P < 0.01, ***P < 0.001 according to one-way ANOVA followed by Tukey’s or Dunnett’s multiple comparisons.

Similar articles

Cited by

References

    1. Czarnowicki T, He H, Krueger JG, Guttman-Yassky E. Atopic dermatitis endotypes and implications for targeted therapeutics. J Allergy Clin Immunol (2019) 143(1):1–11. 10.1016/j.jaci.2018.10.032 - DOI - PubMed
    1. Nomura T, Honda T, Kabashima K. Multipolarity of cytokine axes in the pathogenesis of atopic dermatitis in terms of age, race, species, disease stage and biomarkers. Int Immunol (2018) 30(9):419–28. 10.1093/intimm/dxy015 - DOI - PubMed
    1. Han H, Roan F, Ziegler SF. The atopic march: current insights into skin barrier dysfunction and epithelial cell-derived cytokines. Immunol Rev (2017) 278(1):116–30. 10.1111/imr.12546 - DOI - PMC - PubMed
    1. Hirota T, Takahashi A, Kubo M, Tsunoda T, Tomita K, Sakashita M, et al. . Genome-wide association study identifies eight new susceptibility loci for atopic dermatitis in the Japanese population. Nat Genet (2012) 44(11):1222–6. 10.1038/ng.2438 - DOI - PubMed
    1. Paternoster L, Standl M, Waage J, Baurecht H, Hotze M, Strachan DP, et al. . Multi-ancestry genome-wide association study of 21,000 cases and 95,000 controls identifies new risk loci for atopic dermatitis. Nat Genet (2015) 47(12):1449–56. 10.1038/ng.3424 - DOI - PMC - PubMed

Publication types

MeSH terms