

Systems Biology Guided Gene Enrichment Approaches Improve Prediction of Chronic Post-surgical Pain After Spine Fusion
- PMID: 33868360
- PMCID: PMC8044807
- DOI: 10.3389/fgene.2021.594250
Systems Biology Guided Gene Enrichment Approaches Improve Prediction of Chronic Post-surgical Pain After Spine Fusion
Abstract
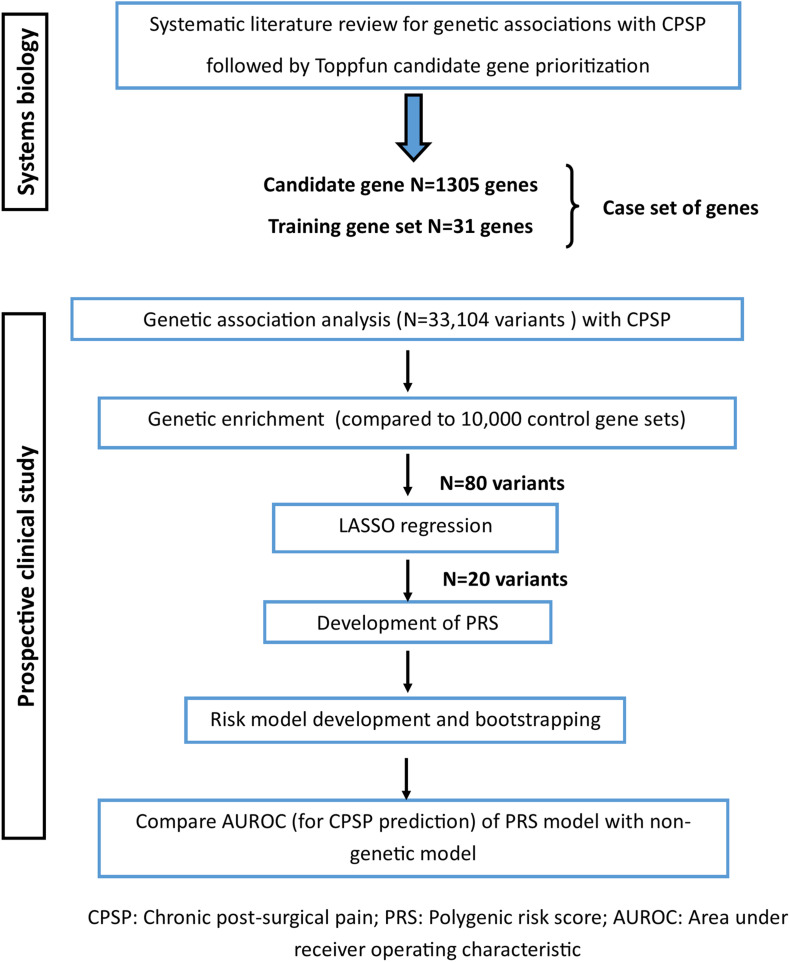
Objectives: Incorporation of genetic factors in psychosocial/perioperative models for predicting chronic postsurgical pain (CPSP) is key for personalization of analgesia. However, single variant associations with CPSP have small effect sizes, making polygenic risk assessment important. Unfortunately, pediatric CPSP studies are not sufficiently powered for unbiased genome wide association (GWAS). We previously leveraged systems biology to identify candidate genes associated with CPSP. The goal of this study was to use systems biology prioritized gene enrichment to generate polygenic risk scores (PRS) for improved prediction of CPSP in a prospectively enrolled clinical cohort.
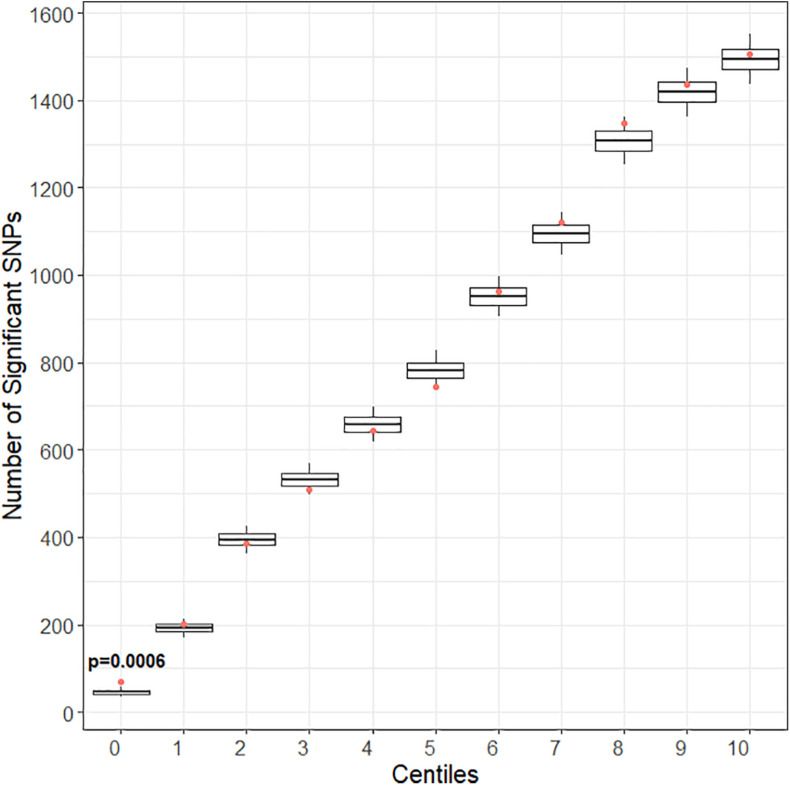
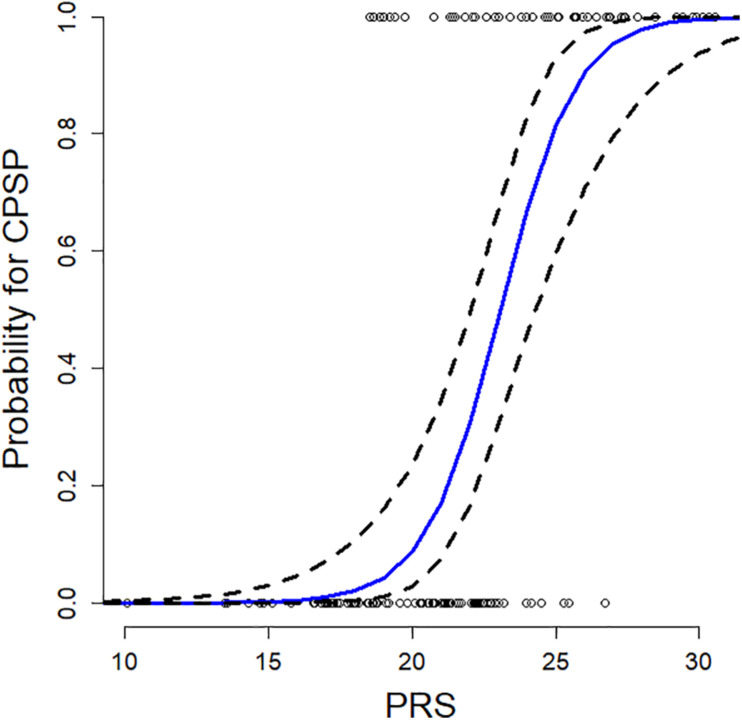
Methods: In a prospectively recruited cohort of 171 adolescents (14.5 ± 1.8 years, 75.4% female) undergoing spine fusion, we collected data about anesthesia/surgical factors, childhood anxiety sensitivity (CASI), acute pain/opioid use, pain outcomes 6-12 months post-surgery and blood (for DNA extraction/genotyping). We previously prioritized candidate genes using computational approaches based on similarity for functional annotations with a literature-derived "training set." In this study, we tested ranked deciles of 1336 prioritized genes for increased representation of variants associated with CPSP, compared to 10,000 randomly selected control sets. Penalized regression (LASSO) was used to select final variants from enriched variant sets for calculation of PRS. PRS incorporated regression models were compared with previously published non-genetic models for predictive accuracy.
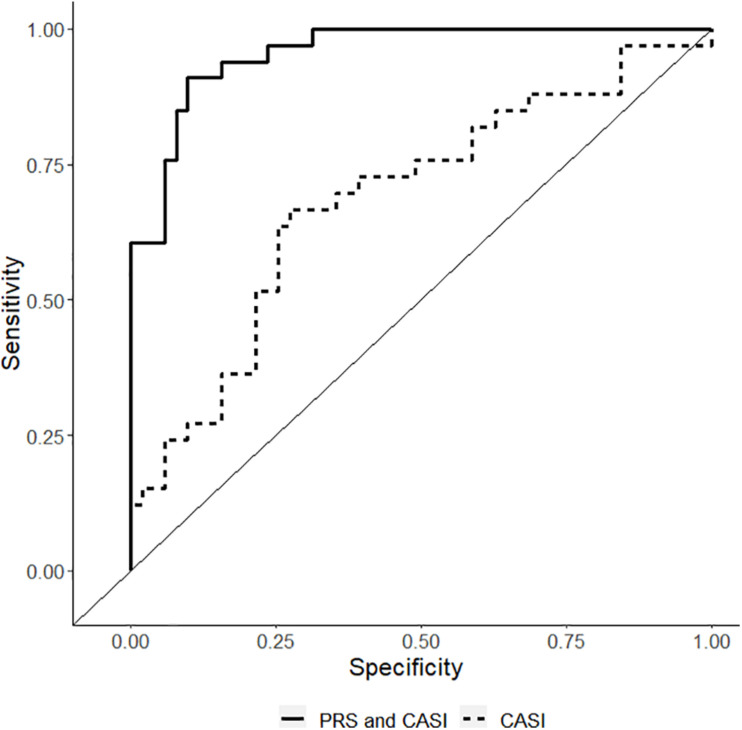
Results: Incidence of CPSP in the prospective cohort was 40.4%. 33,104 case and 252,590 control variants were included for association analyses. The smallest gene set enriched for CPSP had 80/1010 variants associated with CPSP (p < 0.05), significantly higher than in 10,000 randomly selected control sets (p = 0.0004). LASSO selected 20 variants for calculating weighted PRS. Model adjusted for covariates including PRS had AUROC of 0.96 (95% CI: 0.92-0.99) for CPSP prediction, compared to 0.70 (95% CI: 0.59-0.82) for non-genetic model (p < 0.001). Odds ratios and positive regression coefficients for the final model were internally validated using bootstrapping: PRS [OR 1.98 (95% CI: 1.21-3.22); β 0.68 (95% CI: 0.19-0.74)] and CASI [OR 1.33 (95% CI: 1.03-1.72); β 0.29 (0.03-0.38)].
Discussion: Systems biology guided PRS improved predictive accuracy of CPSP risk in a pediatric cohort. They have potential to serve as biomarkers to guide risk stratification and tailored prevention. Findings highlight systems biology approaches for deriving PRS for phenotypes in cohorts less amenable to large scale GWAS.
Keywords: chronic post-surgical pain; gene enrichment; genetics; polygenic risk score; systems biology.
Copyright © 2021 Chidambaran, Pilipenko, Jegga, Geisler and Martin.
Conflict of interest statement
The authors declare that the research was conducted in the absence of any commercial or financial relationships that could be construed as a potential conflict of interest.
Figures
Similar articles
-
Systems biology-based approaches to summarize and identify novel genes and pathways associated with acute and chronic postsurgical pain.J Clin Anesth. 2020 Jun;62:109738. doi: 10.1016/j.jclinane.2020.109738. Epub 2020 Feb 12. J Clin Anesth. 2020. PMID: 32058259 Free PMC article.
-
Enrichment of Genomic Pathways Based on Differential DNA Methylation Associated With Chronic Postsurgical Pain and Anxiety in Children: A Prospective, Pilot Study.J Pain. 2019 Jul;20(7):771-785. doi: 10.1016/j.jpain.2018.12.008. Epub 2019 Jan 9. J Pain. 2019. PMID: 30639570 Free PMC article.
-
The role of cytokines in acute and chronic postsurgical pain after major musculoskeletal surgeries in a quaternary pediatric center.Brain Behav Immun. 2024 Nov;122:596-603. doi: 10.1016/j.bbi.2024.08.056. Epub 2024 Aug 31. Brain Behav Immun. 2024. PMID: 39222726
-
Screening Tools for Chronic Post-Surgical Pain [Internet].Ottawa (ON): Canadian Agency for Drugs and Technologies in Health; 2021 Jan. Ottawa (ON): Canadian Agency for Drugs and Technologies in Health; 2021 Jan. PMID: 34185450 Free Books & Documents. Review.
-
Systematic Review and Meta-Analysis of Genetic Risk of Developing Chronic Postsurgical Pain.J Pain. 2020 Jan-Feb;21(1-2):2-24. doi: 10.1016/j.jpain.2019.05.008. Epub 2019 May 23. J Pain. 2020. PMID: 31129315 Free PMC article.
Cited by
-
Genetic and epigenetic mechanisms influencing acute to chronic postsurgical pain transitions in pediatrics: Preclinical to clinical evidence.Can J Pain. 2022 May 10;6(2):85-107. doi: 10.1080/24740527.2021.2021799. eCollection 2022. Can J Pain. 2022. PMID: 35572362 Free PMC article. Review.
-
Genome-wide association study on chronic postsurgical pain in the UK Biobank.Br J Anaesth. 2025 Mar;134(3):783-792. doi: 10.1016/j.bja.2024.12.008. Epub 2025 Jan 25. Br J Anaesth. 2025. PMID: 39863470 Free PMC article.
-
Predictors of Chronic Postsurgical Pain in Elderly Patients Undergoing Hip Arthroplasty: A Multi-Center Retrospective Cohort Study.Int J Gen Med. 2021 Nov 10;14:7885-7894. doi: 10.2147/IJGM.S337170. eCollection 2021. Int J Gen Med. 2021. PMID: 34785937 Free PMC article.
-
Genome-wide association study on chronic postsurgical pain after abdominal surgeries in the UK Biobank.Anaesthesia. 2025 May;80(5):499-510. doi: 10.1111/anae.16528. Epub 2024 Dec 29. Anaesthesia. 2025. PMID: 39734325 Free PMC article.
-
Genetically modified mesenchymal stem cells promote spinal fusion through polarized macrophages.Lab Invest. 2022 Mar;102(3):312-319. doi: 10.1038/s41374-021-00693-4. Epub 2021 Nov 11. Lab Invest. 2022. PMID: 34764437 Free PMC article.
References
-
- Abecasis G. R., Cherny S. S., Cookson W. O. C., Cardon L. R. (2001). GRR: graphical representation of relationship errors. Bioinform. Appl. Note 17 742–743. - PubMed
-
- Andersen A. M., Pietrzak R. H., Kranzler H. R., Ma L., Zhou H., Liu X., et al. (2017). Polygenic scores for major depressive disorder and risk of alcohol dependencepolygenic risk score analysis for depression and alcohol dependencepolygenic risk score analysis for depression and alcohol dependence. JAMA Psychiatry 74 1153–1160. 10.1001/jamapsychiatry.2017.2269 - DOI - PMC - PubMed
-
- Asmundson G. J., Taylor S. (1996). Role of anxiety sensitivity in pain-related fear and avoidance. J. Behav. Med. 19 577–586. - PubMed
Grants and funding
LinkOut - more resources
Full Text Sources
Other Literature Sources