

RRM2B Is Frequently Amplified Across Multiple Tumor Types: Implications for DNA Repair, Cellular Survival, and Cancer Therapy
- PMID: 33868369
- PMCID: PMC8045241
- DOI: 10.3389/fgene.2021.628758
RRM2B Is Frequently Amplified Across Multiple Tumor Types: Implications for DNA Repair, Cellular Survival, and Cancer Therapy
Abstract
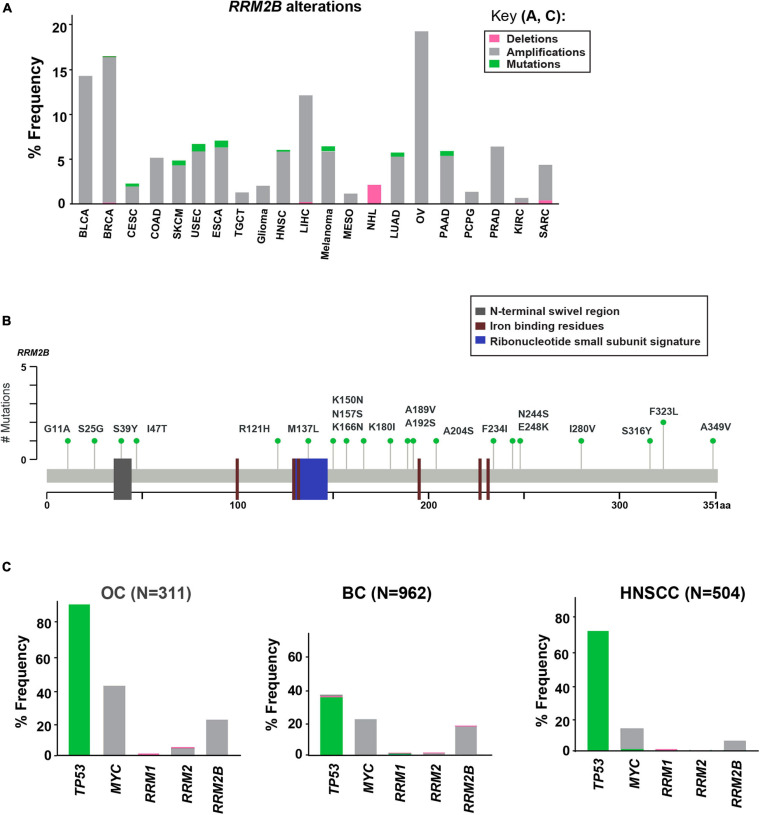
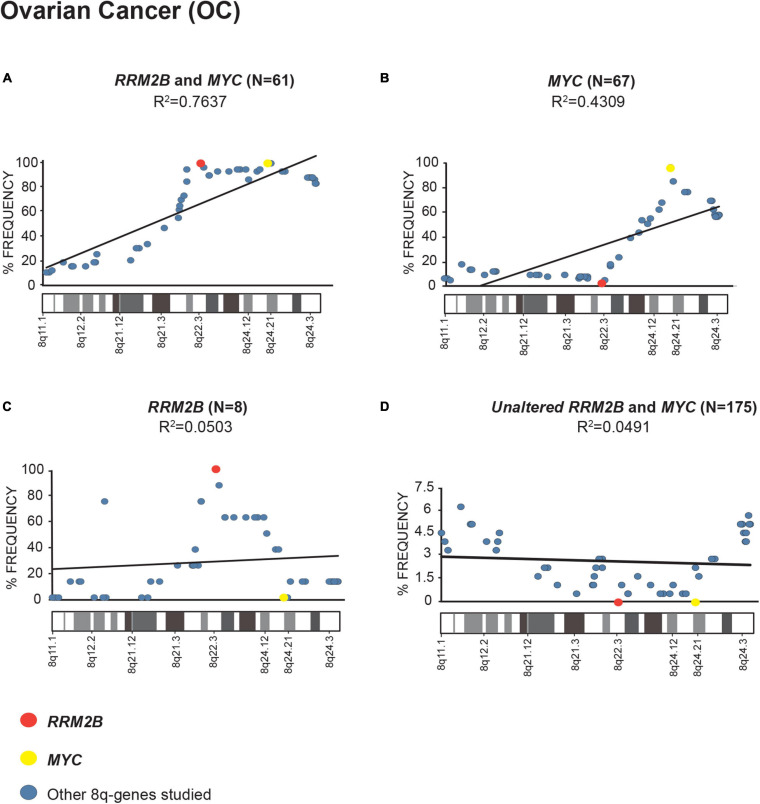
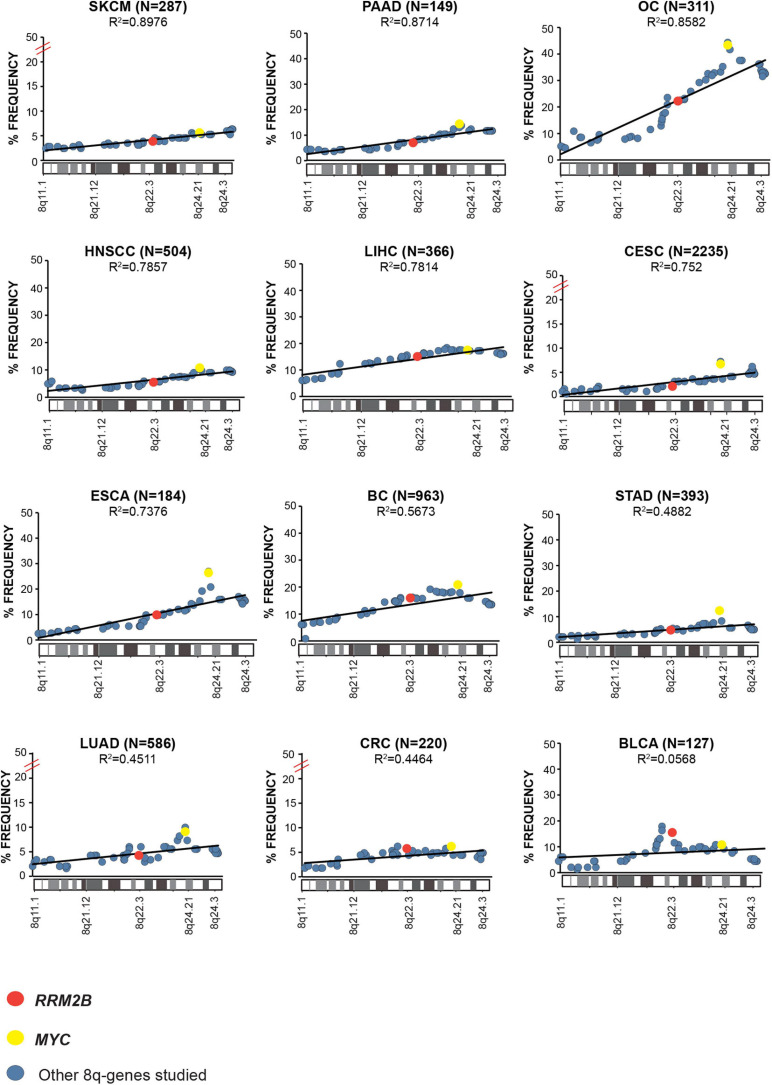
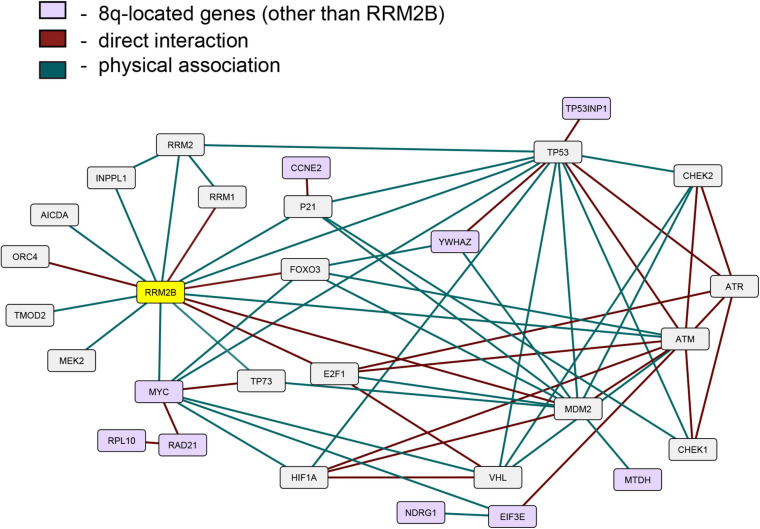
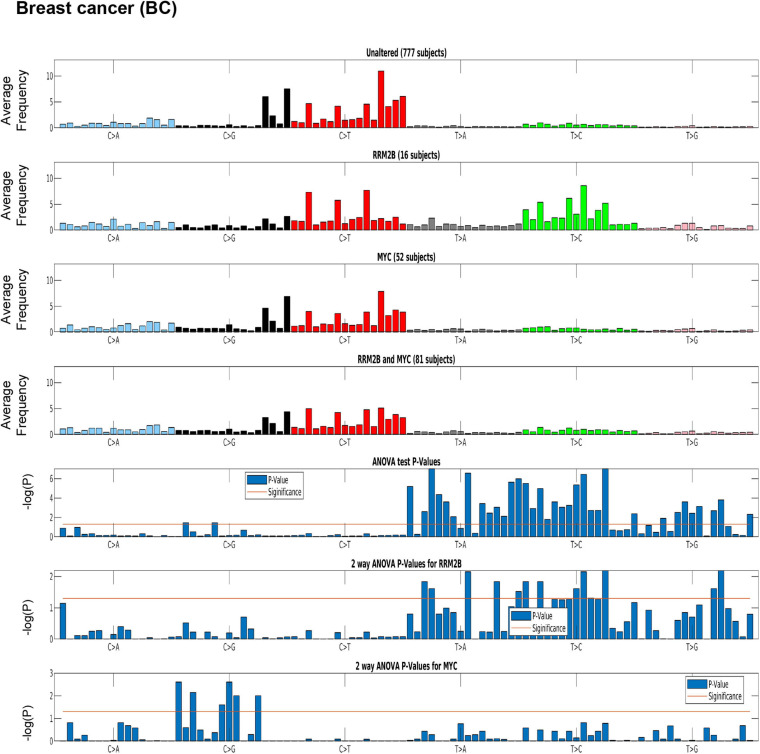
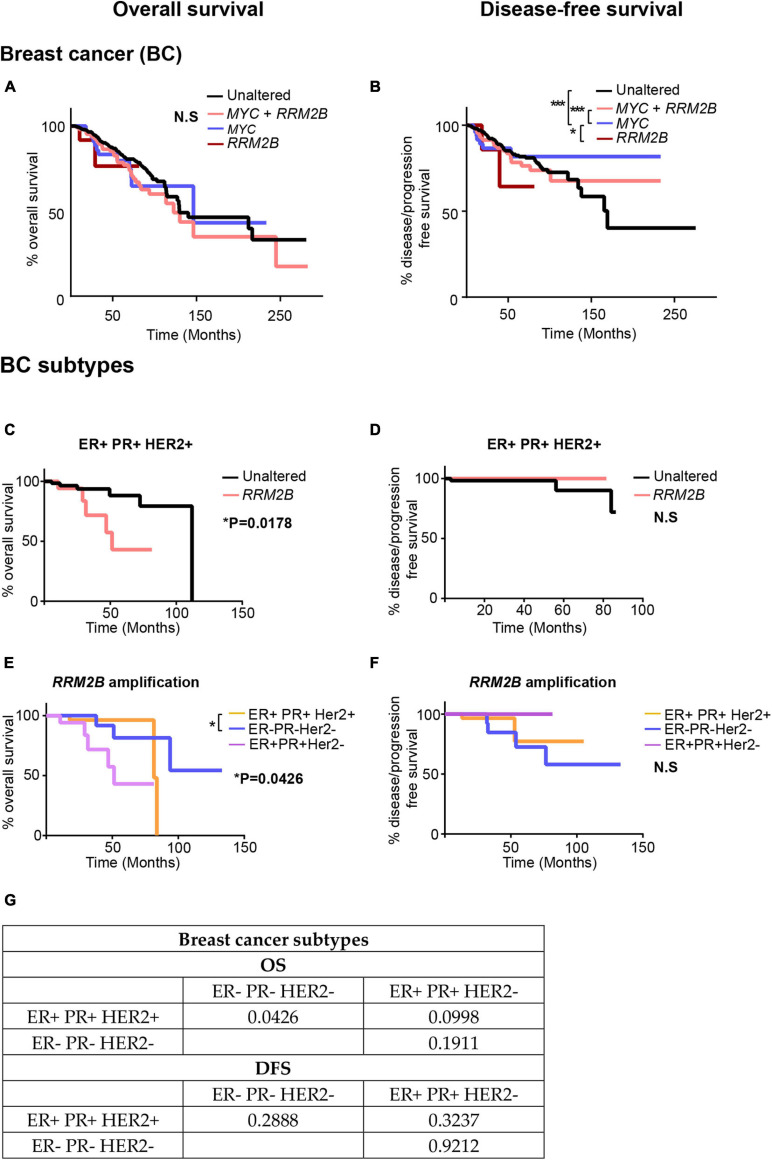
RRM2B plays a crucial role in DNA replication, repair and oxidative stress. While germline RRM2B mutations have been implicated in mitochondrial disorders, its relevance to cancer has not been established. Here, using TCGA studies, we investigated RRM2B alterations in cancer. We found that RRM2B is highly amplified in multiple tumor types, particularly in MYC-amplified tumors, and is associated with increased RRM2B mRNA expression. We also observed that the chromosomal region 8q22.3-8q24, is amplified in multiple tumors, and includes RRM2B, MYC along with several other cancer-associated genes. An analysis of genes within this 8q-amplicon showed that cancers that have both RRM2B-amplified along with MYC have a distinct pattern of amplification compared to cancers that are unaltered or those that have amplifications in RRM2B or MYC only. Investigation of curated biological interactions revealed that gene products of the amplified 8q22.3-8q24 region have important roles in DNA repair, DNA damage response, oxygen sensing, and apoptosis pathways and interact functionally. Notably, RRM2B-amplified cancers are characterized by mutation signatures of defective DNA repair and oxidative stress, and at least RRM2B-amplified breast cancers are associated with poor clinical outcome. These data suggest alterations in RR2MB and possibly the interacting 8q-proteins could have a profound effect on regulatory pathways such as DNA repair and cellular survival, highlighting therapeutic opportunities in these cancers.
Keywords: 8q-amplicon; MYC; RRM2B; cancer; chromosome 8.
Copyright © 2021 Iqbal, Demidova, Serrao, ValizadehAslani, Rosen and Arora.
Conflict of interest statement
The authors declare that the research was conducted in the absence of any commercial or financial relationships that could be construed as a potential conflict of interest.
Figures
Similar articles
-
Frequent MYC coamplification and DNA hypomethylation of multiple genes on 8q in 8p11-p12-amplified breast carcinomas.Oncogenesis. 2014 Mar 24;3(3):e95. doi: 10.1038/oncsis.2014.8. Oncogenesis. 2014. PMID: 24662924 Free PMC article.
-
Integrated genomic analysis of the 8q24 amplification in endometrial cancers identifies ATAD2 as essential to MYC-dependent cancers.PLoS One. 2013;8(2):e54873. doi: 10.1371/journal.pone.0054873. Epub 2013 Feb 5. PLoS One. 2013. PMID: 23393560 Free PMC article.
-
Novel regions of amplification on 8q distinct from the MYC locus and frequently altered in oral dysplasia and cancer.Genes Chromosomes Cancer. 2004 Jan;39(1):93-8. doi: 10.1002/gcc.10294. Genes Chromosomes Cancer. 2004. PMID: 14603447
-
Phenotypic and Genotypic Heterogeneity of RRM2B Variants.Neuropediatrics. 2018 Aug;49(4):231-237. doi: 10.1055/s-0037-1609039. Epub 2017 Dec 14. Neuropediatrics. 2018. PMID: 29241262 Review.
-
Amplification of 8p11.23 in cancers and the role of amplicon genes.Life Sci. 2021 Jan 1;264:118729. doi: 10.1016/j.lfs.2020.118729. Epub 2020 Nov 6. Life Sci. 2021. PMID: 33166592 Review.
Cited by
-
Integrative lactylation and tumor microenvironment signature as prognostic and therapeutic biomarkers in skin cutaneous melanoma.J Cancer Res Clin Oncol. 2023 Dec;149(20):17897-17919. doi: 10.1007/s00432-023-05483-7. Epub 2023 Nov 13. J Cancer Res Clin Oncol. 2023. PMID: 37955686 Free PMC article.
-
The Multifaceted Role of p53 in Cancer Molecular Biology: Insights for Precision Diagnosis and Therapeutic Breakthroughs.Biomolecules. 2025 Jul 27;15(8):1088. doi: 10.3390/biom15081088. Biomolecules. 2025. PMID: 40867533 Free PMC article. Review.
-
RRM2 gene expression depends on BAF180 subunit of SWISNF chromatin remodeling complex and correlates with abundance of tumor infiltrating lymphocytes in ccRCC.Am J Cancer Res. 2021 Dec 15;11(12):5965-5978. eCollection 2021. Am J Cancer Res. 2021. PMID: 35018236 Free PMC article.
-
Integrative proteogenomic characterization of hepatocellular carcinoma across etiologies and stages.Nat Commun. 2022 May 4;13(1):2436. doi: 10.1038/s41467-022-29960-8. Nat Commun. 2022. PMID: 35508466 Free PMC article. Review.
-
RRM2 promotes liver metastasis of pancreatic cancer by stabilizing YBX1 and activating the TGF-beta pathway.iScience. 2024 Aug 31;27(10):110864. doi: 10.1016/j.isci.2024.110864. eCollection 2024 Oct 18. iScience. 2024. PMID: 39398252 Free PMC article.
References
-
- Ballabio S., Craparotta I., Paracchini L., Mannarino L., Corso S., Pezzotta M. G., et al. (2019). Multisite analysis of high-grade serous epithelial ovarian cancers identifies genomic regions of focal and recurrent copy number alteration in 3q26.2 and 8q24.3. Int. J. Cancer 145 2670–2681. 10.1002/ijc.32288 - DOI - PubMed
-
- Benjamini Y., Hochberg Y. (1995). Controlling the false discovery rate: a practical and powerful approach to multiple testing. J. R. Stat. Soc. Series B Stat. Methodol. 57 289–300. 10.1111/j.2517-6161.1995.tb02031.x - DOI
LinkOut - more resources
Full Text Sources
Other Literature Sources