

The European Union Summary Report on Antimicrobial Resistance in zoonotic and indicator bacteria from humans, animals and food in 2018/2019
- PMID: 33868492
- PMCID: PMC8040295
- DOI: 10.2903/j.efsa.2021.6490
The European Union Summary Report on Antimicrobial Resistance in zoonotic and indicator bacteria from humans, animals and food in 2018/2019
Abstract
Data on antimicrobial resistance (AMR) in zoonotic and indicator bacteria from humans, animals and food are collected annually by the EU Member States (MSs), jointly analysed by the EFSA and the ECDC and reported in a yearly EU Summary Report. The annual monitoring of AMR in animals and food within the EU is targeted at selected animal species corresponding to the reporting year. The 2018 monitoring specifically focussed on poultry and their derived carcases/meat, while the monitoring performed in 2019 specifically focused on pigs and calves under 1 year of age, as well as their derived carcases/meat. Monitoring and reporting of AMR in 2018/2019 included data regarding Salmonella, Campylobacter and indicator Escherichia coli isolates, as well as data obtained from the specific monitoring of presumptive ESBL-/AmpC-/carbapenemase-producing E. coli isolates. Additionally, some MSs reported voluntary data on the occurrence of meticillin-resistant Staphylococcus aureus in animals and food, with some countries also providing data on antimicrobial susceptibility. This report provides an overview of the main findings of the 2018/2019 harmonised AMR monitoring in the main food-producing animal populations monitored, in related carcase/meat samples and in humans. Where available, data monitoring obtained from pigs, calves, broilers, laying hens and turkeys, as well as from carcase/meat samples and humans were combined and compared at the EU level, with particular emphasis on multidrug resistance, complete susceptibility and combined resistance patterns to critically important antimicrobials, as well as Salmonella and E. coli isolates possessing ESBL-/AmpC-/carbapenemase phenotypes. The outcome indicators for AMR in food-producing animals such as complete susceptibility to the harmonised panel of antimicrobials in E. coli and the prevalence of ESBL-/AmpC-producing E. coli have been also specifically analysed over the period 2015-2019.
Keywords: ESBL; MRSA; antimicrobial resistance; indicator bacteria; zoonotic bacteria.
© 2021 European Food Safety Authority and European Centre for Disease Prevention and Control. EFSA Journal published by John Wiley and Sons Ltd on behalf of European Food Safety Authority.
Figures


The
MDR analysis of human isolates included the following antimicrobials: ampicillin, cefotaxime/ceftazidime, chloramphenicol, ciprofloxacin/pefloxacin/nalidixic acid, gentamicin, meropenem, sulfonamides/sulfamethoxazole, tetracyclines and trimethoprim/trimethoprim‐sulfamethoxazole (co‐trimoxazole).

AMP : ampicillin;SMX : sulfamethoxazole;TET : tetracycline;CIP : ciprofloxacin;CTX : cefotaxime;CIP /CTX : combined ‘microbiological’ resistance to ciprofloxacin and cefotaxime; N: total number of Salmonella spp. reported byMS s; blue diamond shows resistance at the reportingMS ‐group level. Note: OnlyMS s reporting data for 10 or more isolates are shown in the graph; however, all isolates are included in the calculation of resistance at the reportingMS ‐group level. As only twoMS s reported data on 10 or more Salmonella isolates recovered from calves or their derived carcases, resistance levels for these origins are not presented in Figure 4 (a and b).

The
MDR analysis of carcase isolates included the following antimicrobials: ampicillin, cefotaxime/ceftazidime, chloramphenicol, ciprofloxacin/nalidixic acid, gentamicin, meropenem, sulfamethoxazole, tetracycline, tigecycline and trimethoprim.MDR and complete susceptibility levels are also expressed as a percentage; N: total number of Salmonella spp. reported byMS s and non‐MS s


The
MDR analysis of animal isolates included the following antimicrobials: ampicillin, cefotaxime/ceftazidime, chloramphenicol, ciprofloxacin/nalidixic acid, gentamicin, meropenem, sulfamethoxazole, tetracycline, tigecycline and trimethoprim.MDR and complete susceptibility are expressed as percentages; N: total number of Salmonella spp. reported byMS s and non‐MS s.


n: Total number of Salmonella spp. exhibiting
CIP resistance (MS s only); N: total number of Salmonella spp. reported byMS s. 1In accordance with breakpoints stated in Decision 2013/652/EU . The proportion of isolates showing high‐level resistance is not included with those exhibiting ‘clinical’ or ‘microbiological’ resistance; similarly, the proportion of isolates showing ‘clinical’ resistance is not included with those displaying ‘microbiological’ resistance. Figure 10 excludes one isolate reported from laying hens (by the Republic of North Macedonia), which was ‘microbiologically’ resistant to ciprofloxacin; as well as one isolate reported from pigs (by Switzerland), which showed ‘clinical’ resistance to ciprofloxacin.

n: Total number of tigecycline‐resistant isolates reported by the
MS s; predominant serovars are also expressed as a percentage; * monophasic S. Typhimurium includes antigenic formulas; salmonellas in the legend are listed according to their predominance within all the animal/carcase origins.

n: Total number of colistin‐resistant isolates reported by the
MS s; predominant serovars are expressed as a percentage; * monophasic S. Typhimurium includes antigenic formulas; salmonellas in the legend are listed according to their predominance within all the animal/carcase origins.


Note: For Finland, travel information was missing from the
AMR data while from the case surveillance data, travel‐associated cases were known to account for 78% of Finnish Campylobacter infections in 2019.

N: Total number of isolates reported.


GEN : gentamicin,STR : streptomycin,TET : tetracyclineCIP : ciprofloxacin,ERY : erythromycin,CIP /ERY : combined ‘microbiological’ resistance to ciprofloxacin and erythromycin. N: Total number of isolates reported by all Member States (MS s). Blue diamond:EU level.


N: Total number of isolates reported by the
EU MS s. Complete susceptibility is defined as susceptibility to ciprofloxacin/nalidixic acid, erythromycin, gentamicin and tetracycline.MDR is defined as resistance to at least three antimicrobial substances (panel of antimicrobial tested: ciprofloxacin, nalidixic acid, erythromycin, gentamicin, tetracycline).

CIP : ciprofloxacin;ERY : erythromycin;STR : streptomycin;TET : tetracycline. Arrows indicate significant increasing (up) or decreasing (down) significant trend over the entire period. Please note that between‐year fluctuation in the occurrence resistance (%) may not be captured in the overall evaluation of the trend for the entire period (2009–2019).


N: Total number of C. jejuni or C. coli isolates exhibiting erythromycin resistance.
ERY : erythromycin.ERY resistance in C. jejuni isolates: 4 mg/L <MIC < 128 mg/L.ERY resistance in C. coli isolates: 8 mg/L <MIC < 128 mg/L.


N: Total number of isolates reported by Member States (
MS s) and non‐Member States (non‐MS s);AMP : ampicillin,SMX : sulfamethoxazole,TET : tetracycline,CIP : ciprofloxacin,CTX : cefotaxime,CIP /CTX : combined ‘microbiological’ resistance to ciprofloxacin and cefotaxime; blue diamond:EU level of resistance; horizontal line in the box plot: the median.


(↑)/(↓): indicates statistically significant trends over the period 2015–2019.

(↑)/(↓): indicates statistically significant trends over the period 2015–2019. Data from Croatia was not included in the calculation of the Total (MSs) as data for calves (<1 year) was not reported for the year 2015.

(↑)/(↓): indicates statistically significant trends over the period 2015–2019.

(↑)/(↓): indicates statistically significant trends over the period 2015–2019.


(↑)/(↓): indicates statistically significant trends over the period 2015–2019. The upper bounds of the 95% confidence interval of the occurrence of complete susceptibility are also indicated.

(↑)/(↓): indicates statistically significant trends over the period 2014–2018. The upper bounds of the 95%
CI are also shown.


Blue diamonds show the assessed prevalence at the
MS ‐group level.


The upper bounds of the 95% confidence interval of the prevalence of
ESBL ‐ and/or AmpC‐producing E. coli are also indicated.

The upper bounds of the 95% confidence interval of the prevalence of
ESBL ‐ and/or AmpC‐producing E. coli are also indicated. Please note the different scales used for the x‐axis in the sub‐figures to improve the visibility of the variations among countries.
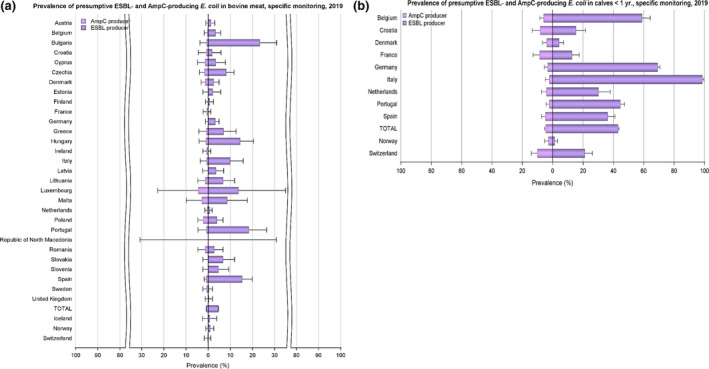
The upper bounds of the 95% confidence interval of the prevalence of
ESBL ‐ and/or AmpC‐producing E. coli are also indicated. Please note the different scales used for the x‐axis in the sub‐figures to improve the visibility of the variations among countries.

The upper bounds of the 95% confidence interval of the prevalence of
ESBL ‐ and/or AmpC‐producing E. coli are also indicated. Please note the different scales used for the x‐axis in the sub‐figures to improve the visibility of the variations among countries (a, 0–100%; b‐c, 0–30%). (↑)/(↓): indicates statistically significant decreasing/increasing trends over the 2015–2019 period. Rates of change are shown only for the statistically significant decreasing/increasing trends observed.

The upper bounds of the 95% confidence interval of the prevalence of
ESBL ‐ and/or AmpC‐producing E. coli are also indicated. (↑)/(↓): indicates statistically significant decreasing/increasing trends over the 2015–2019 period. Rates of change are shown only for the statistically significant decreasing/increasing trends observed.


N: Total number of sample units tested;
AT : Austria;CH : Switzerland;DE : Germany;NL : the Netherlands. * spa‐types not reported. 1: spa‐types: t008ST 8 (1 isolate), t011 (2), t127ST 1 (2), t2346 (1). The t008 isolate wasPVL ‐positive; the two t127 isolates werePVL ‐negative. 2: spa‐types were not reported; however, both isolates were confirmed to belong toCC 398 using the sau1‐hsdS1CC 398PCR reaction (Stegger et al., 2011). 3: spa‐types: t002ST 5 (1 isolate), t003ST 3944 (1), t008ST 8 (1), t011 (22), t011ST 398 (1), t034 (12), t127ST 1 (2), t321ST 5050 (1), t843ST 130 (1), t899 (5), t1451 (2), t1456 (1). The t002 and t008 isolates werePVL ‐positive. The two t127 isolates, as well as the single t003 and t321 isolates werePVL ‐negative. The t843 isolate was reported to carry the mecC gene. 4: spa‐type was not reported; however, the isolate was confirmed to belong toCC 398 using the sau1‐hsdS1CC 398PCR reaction (Stegger et al., 2011). 5: spa‐types: t011 (2 isolates), t034 (1). 6: spa‐types: t034CC 398 (1 isolate), t1430 (1), t571CC 398 (1), t13177 (1). 7: spa‐type : t011 (1 isolate).

Inferred
MRSA types in (a) were recovered from broiler meat (7 isolates) and turkey meat (1 isolate); inferredMRSA types in (b) were recovered from cattle meat (8 isolates) and pig meat (51 isolates).

N: Total number of sample units tested;
BE : Belgium;CH : Switzerland;DE : Germany;DK : Denmark;NL : the Netherlands;NO : Norway;PT : Portugal.CHC : controlled housing conditions. * spa‐types not reported. † These comprised multiplier herds. 1: spa‐types were not reported; however, all 11 isolates were confirmed to belong toCC 398 using the sau1‐hsdS1CC 398PCR reaction (Stegger et al., 2011). 2: spa‐types: t011CC 398 (1 isolate), t034CC 398 (8), t779CC 398 (1), t1580CC 398 (1). 3: spa‐types: t011CC 398 (65 isolates), t034CC 398 (8), t1451CC 398 (1), t1580CC 398 (2), t3423CC 398 (1), t3479CC 398 (1), t9433CC 398 (1). 4: spa‐types: t011CC 398 (5 isolates), t1451CC 398 (1), t223 (2), t223ST 22 (1). All three t223 isolates werePVL ‐negative. One t223 isolate was confirmed to belong toST 22, harbour the tst gene andIEC genes (chp, sak and scn) fromWGS data. 5: spa‐types: t127CC 1 (1 isolate), t843CC 130 (1). The t127 isolate wasPVL ‐negative, as well as negative for the humanIEC gene scn. spa‐type t843 was confirmed to carry the mecC gene. 6: spa‐types: t034 (7 isolates), t267CC 97 (1). 7: spa‐types: t011CC 398 (8 isolates), t034CC 398 (1), t223 (3), t1257 (1). The t223 isolates werePVL ‐negative;TSST status was not determined. ThePVL status of the t1257 isolate was not reported. 8: spa‐types: t011CC 398 (3), unspecified (168). 9: spa‐type: t034CC 398 (1 isolate). 10: spa‐types were not reported; however, 159/160 isolates were confirmed to belong toCC 398 using the sau1‐hsdS1CC 398PCR reaction (Stegger et al., 2011). The remaining isolate did not survive cryo‐conservation; therefore, typing could not be performed. 11: spa‐types: t011CC 398 (67 isolates), t034CC 398 (11), t1451CC 398 (2), t1457CC 398 (1), t2346CC 398 (1), t2370CC 398 (2), t2383CC 398 (1), t3041CC 398 (1), t3119CC 398 (1), unspecified (18). 12: spa‐types: t011CC 398 (22 isolates), t034CC 398 (85), t571CC 398 (3), t898CC 398 (1), t2383CC 398 (1), t2974CC 398 (1), t3423CC 398 (1), t4652CC 398 (1), t9266CC 398 (1). 13: spa‐types: t011CC 398 (4 isolates), t034CC 398 (15), t588CC 398 (1), t1456CC 398 (1). 14: spa‐types: t011CC 398 (57 isolates), t034CC 398 (18), t108CC 398 (2), t779CC 398 (1), t2346CC 398 (1), t2582CC 398 (1), t2922CC 398 (1), t3119CC 398 (2). 15: spa‐types: t011CC 398 (10 isolates), t034CC 398 (57), t1928CC 398 (1), t4652CC 398 (1). 16: spa‐types: t011CC 398 (6 isolates), t034CC 398 (24), t1250CC 398 (2), t1793CC 398 (1), t3171CC 398 (1). 17: spa‐types: t011CC 398 (4 isolates), t034CC 398 (6), t1451CC 398 (1), t843CC 130 (1), t3256CC 130 (1). spa‐types t843 and t3256 were confirmed to carry the mecC gene. 18: spa‐types: t011CC 398 (3 isolates), t034CC 398 (6), t843CC 130 (1). spa‐type t843 was confirmed to carry the mecC gene. 19: spa‐types: t011CC 398 (2 isolates), t034CC 398 (2). 20: spa‐types: t011CC 398 (6 isolates), t034CC 398 (19), t571CC 398 (1), t588CC 398 (1), t1456CC 398 (1), t1457CC 398 (2), t13790CC 1 (1).

Inferred
MRSA types in (a) 2018 were recovered from pigs (171 isolates), cattle (109 isolates), laying hens (4 isolates), mink (31 isolates) and horses (10 isolates) at the herd/flock/farm/stable level; inferredMRSA types in (b) 2019 were recovered from pigs (243 isolates), cattle (13 isolates) and horses (13 isolates) at the herd/slaughter batch/stable level, as well as individual fattening pigs (159 isolates) and calves at slaughter (11 isolates).

CH : Switzerland;DE : Germany;NL : the Netherlands. The 2‐S method of isolation was used byCH andDE from 2011–2018; while the 1‐S method was used by theNL from 2018–2019, as well asCH in 2019. * spa‐types not reported. 1: In 2019, spa‐types were not reported; however, both isolates were confirmed to belong toCC 398 using the sau1‐hsdS1CC 398PCR reaction (Stegger et al., 2011). 2: In 2017, spa‐type: t011 (1 isolate), t002 (1).PVL status of the t002 isolate was not reported. In 2019, spa‐type was not reported; however, the isolate was confirmed to belong toCC 398 using the sau1‐hsdS1CC 398PCR reaction (Stegger et al., 2011). 3: In 2016, spa‐types: t034 (3 isolates), t153 (1), t1430 (3), t2123 (2).PVL status of the t153 isolate was not reported. In 2018, spa‐types: t034CC 398 (1 isolate), t1430 (1), t571CC 398 (1), t13177 (1).

BE : Belgium;CH : Switzerland;DK : Denmark. The 2‐S method of isolation was used byBE andCH from 2012–2018; while the 1‐S method was used byDK from 2018–2019, as well asCH in 2019. * spa‐types not reported. 1: In 2012, spa‐types: t011 (40 isolates), t1451 (3), t1456 (1), t1985 (3), t3423 (1), untypable (1). In 2015, spa‐types: t011 (64 isolates), t034 (15), t037 (8), t044 (3), t1451 (3), t1580 (7), t1985 (8), t2287 (2), t3423 (5), untypable (1). The t044 isolates werePVL ‐negative. In 2018, spa‐types: t011CC 398 (65 isolates), t034CC 398 (8), t1451CC 398 (1), t1580CC 398 (2), t3423CC 398 (1), t3479CC 398 (1), t9433CC 398 (1). 2: In 2015, spa‐types: t011 (11 isolates), t034 (6) and t008 (2). The t008 isolates werePVL ‐positive. In 2017, spa‐types: t011 (14 isolates), t034 (7), t127 (1), t17339 (2).PVL status of the t127 isolate was not reported. In 2019, spa‐types were not reported; however, all 11 isolates were confirmed to belong toCC 398 using the sau1‐hsdS1CC 398PCR reaction (Stegger et al., 2011). 3: In 2012, spa‐types: t011 (8 isolates), t037 (1), t388 (1), t1456 (1), t6228 (2), untypable (1). In 2015, t011 (4 isolates), t034 (1), t1580 (1), t1985 (2), t2383 (1), untypable (1). In 2018, spa‐types: t011CC 398 (8 isolates), t034CC 398 (1), t223 (3), t1257 (1). The t223 isolates werePVL ‐negative;TSST status was not determined. ThePVL status of the t1257 isolate was not reported. 4: In 2018, spa‐types: t034 (7 isolates), t267CC 97 (1). In 2019, spa‐types: t127CC 1 (1 isolate), t843CC 130 (1). The t127 isolate wasPVL ‐negative, as well as negative for the humanIEC gene scn. spa‐type t843 was confirmed to carry the mecC gene. 5: In 2012, spa‐types: t011 (16 isolates), t121 (1), t1456 (1), t1985 (1). In 2015, spa‐types: t011 (9 isolates), t034 (2), t1451 (1), t1580 (2), t2287 (1), t3423 (1). In 2018, spa‐types: t011CC 398 (5 isolates), t1451CC 398 (1), t223 (2), t223ST 22 (1). All three t223 isolates werePVL ‐negative. One t223 isolate was confirmed to belong toST 22, harbour the tst gene andIEC genes (chp, sak and scn) fromWGS data.

BE : Belgium;CH : Switzerland;DE : Germany;DK : Denmark;NO : Norway. The 2‐S method of isolation was used byBE andDE from 2016–2019, as well asDK in 2016,CH from 2010–2017 andNO from 2014–2017. The 1‐S method was used byCH in 2019 andDK in 2018, as well asNO from 2018–2019. * spa‐types not reported. † Prevalence data for fattening pig herds (not raised under controlled housing conditions) from 2018 are not included. 1: In 2010, spa‐types: t034ST 398 (17 isolates), t011ST 398 (1), t208ST 49 (5). In 2011, spa‐types: t034ST 398 (19 isolates), t011ST 398 (1), t208ST 49 (1), t2279ST 1 (1). In 2012, spa‐types: t034CC 398 (61 isolates), t011CC 398 (9), t208ST 49 (2). In 2013, spa‐types: t034 (63 isolates), t011 (10). In 2014, spa‐types: t034 (57 isolates), t011 (19), t208 (1), t899 (1), t2741 (1). In 2015, spa‐types: t034 (48 isolates), t011 (23), t032 (1), t571 (1), t899 (1), t1145 (1), t1250 (1), t4475 (1). In 2017, spa‐types: t034 (63 isolates), t011 (61), t899 (2), t1451 (3), t2330 (1), t2876 (1). In 2019, spa‐types were not reported; however, 159/160 isolates were confirmed to belong toCC 398 using the sau1‐hsdS1CC 398PCR reaction (Stegger et al., 2011). The remaining isolate did not survive cryo‐conservation, therefore typing could not be performed. 2: In 2016, spa‐types: t011CC 398 (71 isolates), t1451 (1), t1456 (1), t1456CC 398 (1), t1580 (5), t1985 (8), t1985CC 398 (3), t034 (7), t034CC 398 (2), t037 (1), t898 (1), unspecified (11). In 2019, spa‐types: t011CC 398 (67 isolates), t034CC 398 (11), t1451CC 398 (2), t1457CC 398 (1), t2346CC 398 (1), t2370CC 398 (2), t2383CC 398 (1), t3041CC 398 (1), t3119CC 398 (1), unspecified (18). 3: In 2016, spa‐types not reported. In 2018, spa‐types: t011CC 398 (22 isolates), t034CC 398 (85), t571CC 398 (3), t898CC 398 (1), t2383CC 398 (1), t2974CC 398 (1), t3423CC 398 (1), t4652CC 398 (1), t9266CC 398 (1). 4: In 2016, spa‐types: t011CC 398 (55 isolates), t1451 (2), t1456 (1), t1456CC 398 (3), t1580 (1), t1985 (5), t1985CC 398 (1), t034 (1), t034CC 398 (4), t4659CC 398 (1), unspecified (17). In 2019, spa‐types: t011CC 398 (57 isolates), t034CC 398 (18), t108CC 398 (2), t779CC 398 (1), t2346CC 398 (1), t2582CC 398 (1), t2922CC 398 (1), t3119CC 398 (2). 5: In 2016, spa‐types not reported. In 2018, spa‐types: t011CC 398 (6 isolates), t034CC 398 (24), t1250CC 398 (2), t1793CC 398 (1), t3171CC 398 (1). 6: In 2014, spa‐type: t011CC 398 (1). In 2015, spa‐type: t034CC 398 (2), t177CC 1 (2). In 2016, spa‐type: t034CC 398 (1). In 2017, spa‐types: t091CC 7 (1 isolate), t843CC 130 (1), t6292CC 425 (1). The t091 isolate wasPVL ‐negative, spa‐types t843 and t6292 were confirmed to carry the mecC gene. In 2019, spa‐type: t034CC 398 (1).

N: Number of
MRSA isolates reported/tested;AT : Austria;CH : Switzerland. *Susceptibility data are also included for four isolates recovered from additional ad hoc sampling. All isolates were tested againstGEN : gentamicin;KAN : kanamycin;STR : streptomycin;CHL : chloramphenicol;RIF : rifampicin;CIP : ciprofloxacin;ERY : erythromycin;CLI : clindamycin; Q/D: quinupristin/dalfopristin;TIA : tiamulin;MUP : mupirocin;FUS : fusidic acid;SMX : sulfamethoxazole;TMP : trimethoprim;TET : tetracycline. AllMRSA isolates were resistant to penicillin and cefoxitin, as expected. All isolates were susceptible to vancomycin and linezolid.

N: Number of
MRSA isolates reported/tested;SHM : slaughterhouse monitoring;BE : Belgium;CH : Switzerland. All isolates were tested againstGEN : gentamicin;KAN : kanamycin;STR : streptomycin;CHL : chloramphenicol;RIF : rifampicin;CIP : ciprofloxacin;ERY : erythromycin;CLI : clindamycin; Q/D: quinupristin/dalfopristin;TIA : tiamulin;MUP : mupirocin;FUS : fusidic acid;SMX : sulfamethoxazole;TMP : trimethoprim;TET : tetracycline. AllMRSA isolates were resistant to penicillin and cefoxitin, as expected. All isolates were susceptible to vancomycin and linezolid.
N: Number of
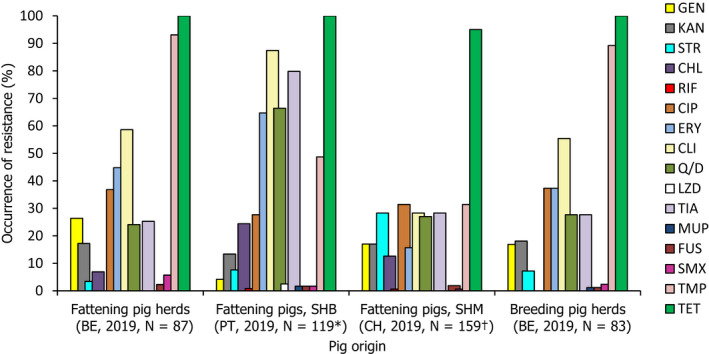
MRSA isolates reported/tested;SHB : slaughterhouse batch;SHM : slaughterhouse monitoring;BE : Belgium;CH : Switzerland;PT : Portugal. *Susceptibility data for a further 52 isolates recovered from batches of fattening pigs at slaughter were not reported. †Susceptibility data for one isolate recovered from a fattening pig was not available; the isolate did not survive cryo‐conservation. All isolates were tested againstGEN : gentamicin;KAN : kanamycin;STR : streptomycin;CHL : chloramphenicol;RIF : rifampicin;CIP : ciprofloxacin;ERY : erythromycin;CLI : clindamycin; Q/D: quinupristin/dalfopristin;LZD : linezolid;TIA : tiamulin;MUP : mupirocin;FUS : fusidic acid;SMX : sulfamethoxazole;TMP : trimethoprim;TET : tetracycline. AllMRSA isolates were resistant to penicillin and cefoxitin, as expected. All isolates were susceptible to vancomycin.

n: Total number of
MDR S. Kentucky isolates exhibiting high‐level ciprofloxacin resistance.NB : The single S. Kentucky isolate recovered from a pig carcase in 2019, which also displayed high‐level ciprofloxacin resistance, additionally showed resistance toAMP ‐GEN ‐NAL ‐SMX ‐TET .


n: Total number of Salmonella isolates exhibiting high‐level ciprofloxacin resistance; ns: number of isolates by serovar exhibiting high‐level ciprofloxacin resistance; * serovar unspecified; salmonellas in the legend are listed according to their predominance within all the animal/carcase origins; in addition, a single S. Kentucky isolate displaying high‐level ciprofloxacin resistance was recovered from a pig carcase in 2019.

* Monophasic S. Typhimurium includes antigenic formulas; serovars in the legend are listed according to their predominance within all the carcase origins. From calf carcases, S. Dublin and S. London were joint fourth most frequently reported.

N: Total number of Salmonella spp. or total number of particular serovars recovered from the carcase monitoring; * monophasic S. Typhimurium includes antigenic formulas.

* Monophasic S. Typhimurium includes antigenic formulas; serovars in the legend are listed according to their predominance within all the animal origins. From calves, S. Anatum and S. Meleagridis were the joint third most frequently reported; S. Enteritidis and S. Mbandaka were the joint fourth most frequently reported.

* monophasic S. Typhimurium includes antigenic formulas. N: Total number of Salmonella spp. or total number of particular serovars recovered from the monitoring of animals.

n: Total number of Salmonella isolates exhibiting
MDR ; serovars contributing the highest levels ofMDR to overallMDR levels in Salmonella spp. are illustrated with a percentage; * monophasic S. Typhimurium includes antigenic formulas.

*
EUCAST has changed the definitions ofSIR from 2019 (EUCAST , 2019 ‐http://www.eucast.org/newsiandr/ ). For I, the new definition ‘susceptible, increased exposure’ is used when there is a high likelihood of therapeutic success because exposure to the agent is increased by adjusting the dosing regimen or by its concentration at the site of infection.

N: Total number of isolates reported by
MS s.

N: Total number of isolates reported by
MS s.NB . S. Enteritidis was not reported from turkey carcases.

N: Total number of isolates reported by
MS s.

N: Total number of isolates reported by
MS s.

N: Total number of isolates reported by
MS s.

N: Total number of isolates reported by
MS s.NB : The S. Derby isolate reported from calves was completely susceptible to all of the 14 antimicrobials tested in the harmonised panel.

Statistically significant increase (↑) or decrease (↓) indicated (p ≤ 0.05). Data from Croatia was not included in the calculation of the Total (MSs) as data for calves (<1 year) was not reported for the year 2015.

Statistically significant increase (↑) or decrease (↓) indicated (p ≤ 0.05).

Statistically significant increase (↑) or decrease (↓) indicated (p ≤ 0.05).

Note: this graph includes four isolates recovered from additional ad hoc sampling carried out by Austria in 2019.
References
-
- Alba P, Feltrin F, Cordaro G, Porrero MC, Kraushaar B, Argudín MA, Nykäsenoja S, Monaco M, Stegger M, Aarestrup FM, Butaye P, Franco A and Battisti A, 2015. Livestock‐associated methicillin resistant and methicillin susceptible Staphylococcus aureus sequence type (CC)1 in European farmed animals: high genetic relatedness of isolates from Italian cattle herds and humans. PLoS ONE, 10, e0137143. 10.1371/journal.pone.0137143 - DOI - PMC - PubMed
-
- Aviv G, Tsyba K, Steck N, Salmon‐Divon M, Cornelius A, Rahav G, Grassl GA and Gal‐Mor O, 2014. A unique megaplasmid contributes to stress tolerance and pathogenicity of an emergent Salmonella enterica serovar Infantis strain. Environmental Microbiology, 16, 977–994. 10.1111/1462-2920.12351 - DOI - PubMed
-
- Bai L, Du P, Du Y, Sun H, Zhang P, Wan Y, Lin Q, Fanning S, Cui S and Wu Y, 2019. Detection of plasmid‐mediated tigecycline‐resistant gene tet(X4) in Escherichia coli from pork, Sichuan and Shandong Provinces, China, February 2019. Euro Surveillance, 24, 4. 10.2807/1560-7917.es.2019.24.25.1900340 - DOI - PMC - PubMed
LinkOut - more resources
Full Text Sources
Other Literature Sources