. 2018 Aug 31;11(9):5025-5048.
doi: 10.5194/amt-11-5025-2018. Epub 2018 Sep 5.

Development and characterization of a high-efficiency, aircraft-based axial cyclone cloud water collector

Affiliations

Development and characterization of a high-efficiency, aircraft-based axial cyclone cloud water collector

Ewan Crosbie et al. Atmos Meas Tech. .

Abstract

A new aircraft-mounted probe for collecting samples of cloud water has been designed, fabricated, and extensively tested. Following previous designs, the probe uses inertial separation to remove cloud droplets from the airstream, which are subsequently collected and stored for offline analysis. We report details of the design, operation, and modelled and measured probe performance. Computational fluid dynamics (CFD) was used to understand the flow patterns around the complex interior geometrical features that were optimized to ensure efficient droplet capture. CFD simulations coupled with particle tracking and multiphase surface transport modelling provide detailed estimates of the probe performance across the entire range of flight operating conditions and sampling scenarios. Physical operation of the probe was tested on a Lockheed C-130 Hercules (fuselage mounted) and de Havilland Twin Otter (wing pylon mounted) during three airborne field campaigns. During C-130 flights on the final field campaign, the probe reflected the most developed version of the design and a median cloud water collection rate of 4.5 mL min-1 was achieved. This allowed samples to be collected over 1-2 min under optimal cloud conditions. Flights on the Twin Otter featured an inter-comparison of the new probe with a slotted-rod collector, which has an extensive airborne campaign legacy. Comparison of trace species concentrations showed good agreement between collection techniques, with absolute concentrations of most major ions agreeing within 30 %, over a range of several orders of magnitude.


Conflict of interest statement

Competing interests. The authors declare that they have no conflict of interest.

Figures

Figure 1.
Figure 1.
Probe schematic showing main components and key dimensions (see Table 1).
Figure 2.
Figure 2.
Optimization of stator blade angles. (a) Schematic of blade geometry and associated wake (W) and jet (J) structure, (b) stator performance as a function of blade angle (see text for details), and (c) optimum blade angle using method shown in panel (b) calculated over a range of droplet diameters (dashed line indicates low confidence of applicability of theoretical model).
Figure 3.
Figure 3.
(a) Profiles of axial and tangential velocity ratio at seven stations across the stator, and (b) axial dependence of total loss coefficient (K) and swirl number (S). The shaded region indicates the extent of the blade chord and a scale is indicated above the first profile.
Figure 4.
Figure 4.
CFD derived azimuthally averaged streamline pattern downstream of the stator blades with contours of tangential velocity showing (a) an axisymmetric slice of the collection zone, and (b) a close-up of the collection zone bounded by the dashed box in panel (a). Flow streamlines indicate a region of separation followed by reattachment on the outer wall (green streamline) and a broad recirculation zone (red streamline).
Figure 5.
Figure 5.
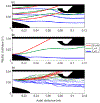
Capture zone droplet trajectories showing (a) variation of droplet trajectory with diameter and radial position with droplets in equilibrium with upstream flow, (b) trajectories of droplets shed at the blade trailing edge with zero initial momentum, and (c) effect of flow turbulence on an ensemble of trajectories, released as per panel (a) in the middle location.
Figure 6.
Figure 6.
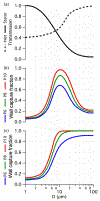
Statistics of trajectory ensembles across a range of droplet diameter. Panel(a) shows the transmission computed for the inlet and stator, which are unaffected by the pipe position. In panels (b) and (c) the fraction of droplets that migrate to the outer walls is compared between three pipe positions for (b) droplets at equilibrium with the upstream flow and (c) droplets shed from the blade trailing edge with zero initial momentum.
Figure 7.
Figure 7.
Evaporation losses from (a) droplets migrating to the wall (ηevap), and (b) water on the walls (δevap). Loss calculations correspond to nominal flight conditions for the C-130 (or equivalent) aircraft with true airspeed 115 m s−1 and a static pressure 850 hPa. Interpolation is acceptable for static temperature lying within the bounds shown in panel (a), and changes in static pressure (within 500–1000 hPa) can be assumed to have negligible impact on evaporation. The transition from solid to dotted curves reflects the lower bound for activated droplets for purposes of the design. In panel (b), the right axis is shown as an illustration of the effect of wall evaporation in the context of TCE (see text for details).
Figure 8.
Figure 8.
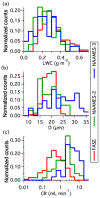
Campaign histograms showing the variability of (a) LWC, (b) effective diameter (D), and (c) collection rate (CR).
Figure 9.
Figure 9.
Bulk performance estimate across the NAAMES-2, FASE and NAAMES-3 campaigns. Markers represent median (50 %) statistics, while bars represent the 25 % to 75 % range. Top and bottom axes are scaled for Stokes number similarity between corresponding airspeeds on the C-130 and Twin Otter (T/O) platforms. Data are grouped into bins of effective diameter based on the range of conditions encountered in each campaign. Model predicted performance is shown for the P10 case together with the model predicted maximum performance based solely on inlet transmission (see text for details).
Figure 10.
Figure 10.
Flight tracks and cloud water sample locations during cold air outbreak case flown during NAAMES-3. Inset MODIS visible images correspond to selected cloud water cases and highlight the range of cloud conditions.
Figure 11.
Figure 11.
Comparison of instantaneous collection rate (CR) time series with observed cloud liquid water content (LWC) derived from the CDP for the three cases identified in Fig. 10.
Figure 12.
Figure 12.
Pseudo-time series of selected chemical species concentration (a–c) and ratios (d–f) observed during the intercomparison between AC3 and the slotted rod (SR) as part of the FASE campaign.

References

    1. Andreae MO, Rosenfeld D, Artaxo P, Costa AA, Frank GP, Longo KM, and Silva-Dias MAF: Smoking rain clouds over the Amazon, Science, 303, 1337–1342, 10.1126/science.1092779, 2004. - DOI - PubMed
    1. Barth MC, Cantrell CA, Brune WH, Rutledge SA, Crawford JH, Huntrieser H, Carey LD, MacGorman D, Weisman M, Pickering KE, Bruning E, Anderson B, Apel E, Biggerstaff M, Campos T, Campuzano-Jost P, Cohen R, Crounse J, Day DA, Diskin G, Flocke F, Fried A, Garland C, Heikes B, Honomichl S, Hornbrook R, Gregory Huey L, Jimenez JL, Lang T, Lichtenstern M, Mikoviny T, Nault B, O’Sullivan D, Pan LL, Peischl J, Pollack I , Richter D, Riemer D, Ryerson T, Schlager H, St. Clair J , Walega J, Weibring P, Weinheimer A, Wennberg P, Wisthaler A, Wooldridge PJ, and Ziegler C: The deep convective clouds and chemistry (DC3) field campaign, B. Am. Meteorol. Soc, 96, 1281–1310, 10.1175/BAMS-D-13-00290.1, 2015. - DOI
    1. Bator A and Collett JL: Cloud chemistry varies with drop size, J. Geophys. Res.-Atmos, 102, 28071–28078, 10.1029/97JD02306, 1997. - DOI
    1. Benedict KB, Lee T, and Collett JL: Cloud water composition over the southeastern Pacific Ocean during the VOCALS regional experiment, Atmos. Environ, 46, 104–114, 10.1016/j.atmosenv.2011.10.029, 2012. - DOI
    1. Bernardin JD, Mudawar I, Walsh CB, and Franses EI: Contact angle temperature dependence for water droplets on practical aluminum surfaces, Int. J. Heat Mass Tran, 40, 1017–1033, 10.1016/0017-9310(96)00184-6, 1997. - DOI

LinkOut - more resources