. 2021 Mar 31:2021:6610603.
doi: 10.1155/2021/6610603. eCollection 2021.

Liraglutide, a TFEB-Mediated Autophagy Agonist, Promotes the Viability of Random-Pattern Skin Flaps

Affiliations

Liraglutide, a TFEB-Mediated Autophagy Agonist, Promotes the Viability of Random-Pattern Skin Flaps

Xuwei Zhu et al. Oxid Med Cell Longev. .

Abstract

Random skin flaps are commonly used in reconstruction surgery. However, distal necrosis of the skin flap remains a difficult problem in plastic surgery. Many studies have shown that activation of autophagy is an important means of maintaining cell homeostasis and can improve the survival rate of flaps. In the current study, we investigated whether liraglutide can promote the survival of random flaps by stimulating autophagy. Our results show that liraglutide can significantly improve flap viability, increase blood flow, and reduce tissue oedema. In addition, we demonstrated that liraglutide can stimulate angiogenesis and reduce pyroptosis and oxidative stress. Through immunohistochemistry analysis and Western blotting, we verified that liraglutide can enhance autophagy, while the 3-methylladenine- (3MA-) mediated inhibition of autophagy enhancement can significantly reduce the benefits of liraglutide described above. Mechanistically, we showed that the ability of liraglutide to enhance autophagy is mediated by the activation of transcription factor EB (TFEB) and its subsequent entry into the nucleus to activate autophagy genes, a phenomenon that may result from AMPK-MCOLN1-calcineurin signalling pathway activation. Taken together, our results show that liraglutide is an effective drug that can significantly improve the survival rate of random flaps by enhancing autophagy, inhibiting oxidative stress in tissues, reducing pyroptosis, and promoting angiogenesis, which may be due to the activation of TFEB via the AMPK-MCOLN1-calcineurin signalling pathway.


Conflict of interest statement

The authors have declared that no competing interest exists.

Figures

Figure 1
Figure 1
Liraglutide increases the survival rate of random flaps, reduces tissue oedema, and stimulates angiogenesis in flaps. (a) Images of the degree of flap necrosis in the control and LIR groups on the 3rd and 7th days after surgery (scale bar: 0.5 cm). (b) Histogram of the survival area percentage of the flaps on day 7 after surgery. (c) Laser Doppler blood flow scanning (scale bar: 0.5 cm) on the 7th day after surgery. (d) Histogram showing the intensity of the blood flow signal. (e) Haematoxylin and eosin (H&E) staining shows blood vessels in area II of skin flaps in each group (magnification: 200x; scale bar: 50 μm). (f) Histogram of the mean vascular density (MVD) quantified from the H&E images. (g) Images of tissue oedema in each group on the 7th day after surgery (scale bar: 0.5 cm). (h) Histogram of the water content percentage of each tissue. (i, m, and q) Immunohistochemistry analysis of CD34-positive blood vessels and expression of vascular endothelial growth factor (VEGF) and cadherin 5 protein in flap area II for each group (magnification: 200x; scale bar: 50 μm). (j, n, and r) Histogram of CD34-positive blood vessel density and the optical density values of VEGF and cadherin 5 from the immunohistochemistry results. (k, o, and s) Western blotting was used to detect the expression of VEGF, cadherin 5, and matrix metalloproteinase 9 (MMP9) in the control and LIR groups. (l, p, and t) ImageJ was used to quantitatively analyse the optical density values of VEGF, cadherin 5, and MMP9 in each flap group. The data are presented as the means ± standard error, n = 6 for each group. p < 0.05 and ∗∗p < 0.01.
Figure 2
Figure 2
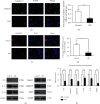
LIR reduces oxidative stress in random flaps. (a) Immunohistochemistry (IHC) was used to assess superoxygen dismutase 1 (SOD1) expression in each group (magnification: 200x; scale bar: 50 μm). (b) Histogram of SOD1 absorbance. (c–e) The expression of SOD1, haem oxidase 1 (HO1), and endothelial nitric oxide synthase (eNOS) was determined by Western blotting. (f–h) ImageJ was used to quantitatively analyse the optical density of SOD1, HO1, and eNOS in each group. The data are presented as the means ± standard error, n = 6 for each group. p < 0.05 and ∗∗p < 0.01.
Figure 3
Figure 3
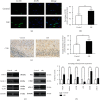
LIR inhibits pyroptosis in flap tissue. (a) Immunofluorescence (IF) assays were performed to evaluate caspase-1 levels in flaps from the control and LIR groups (scale bar: 10 μm). (b) Histogram of the optical density value of caspase-1. (c) Immunofluorescence detection at the gasdermin D-N-terminal domain (GSDMD-N) level in the flap (scale bar: 10 μm). (d) Histogram of GSDMD-N optical density values. (e) Western blot analysis of ASC, interleukin-18 (IL-18), interleukin-1β (IL-1β), caspase-1, GSDMD-N, and nucleotide binding oligomerization segment-like receptor family 3 (NLRP3) expression. (f) ImageJ was used to quantitatively analyse the optical density values of ASC, caspase-1, GSDMD-N, IL-1β, IL-18, and NLRP3 in each group. The data are presented as the means ± standard error, n = 6 for each group. p < 0.05 and ∗∗p < 0.01.
Figure 4
Figure 4
LIR activates autophagy in random flap tissue. (a) LC3II expression in flap tissues was detected by immunofluorescence analysis, and autophagosomes are shown (green) (scale bar: 10 μm). (b) Histogram of the percent of LC3II-positive cells. (c) Immunohistochemical detection of CTSD expression in each group (magnification: 200x; scale bar: 50 μm). (d) ImageJ was used to quantitatively analyse the CTSD optical density values for each group. (e) Western blot analysis of VPS34, Beclin-1, LC3II, P62, CTSD, and ATG-5. (f) ImageJ was used to quantitatively analyse the optical density values of VPS34, Beclin-1, LC3II, P62, CTSD, and ATG-5 in each group. The data are presented as the means ± standard error, n = 6 for each group. p < 0.05 and ∗∗p < 0.01.
Figure 5
Figure 5
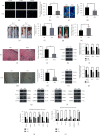
3MA reverses the effect of LIR in random flaps. (a) LC3II expression in flap tissues was detected by immunofluorescence analysis, and autophagosomes are shown (green) (scale bar: 10 μm). (b) Histogram of LC3II-positive cell percentage. (c) Laser Doppler blood flow scanning (scale bar: 0.5 cm) on the 7th day after surgery. (d) Histogram showing the intensity of the blood flow signal. (e) The degree of flap necrosis in the LIR and LR+3MA groups on the 3rd and 7th days after surgery (scale bar: 0.5 cm). (f) Histogram of the survival area percentage of the flaps on day 7 after surgery. (g) Images of tissue oedema in each group on the 7th day after surgery (scale bar: 0.5 cm). (h) Histogram of the water content percentage of each tissue. (i) Haematoxylin and eosin (H&E) staining showing blood vessels in area II of skin flaps in each group (magnification: 200x; scale bar: 50 μm). (j) A histogram of the mean vascular density (MVD) in H&E images was quantitatively analysed. (k and o) Western blots of cadherin 5, VEGF, MMP9, SOD1, HO1, and eNOS in the LIR and LIR+3MA groups. (i and p) ImageJ was used to quantitatively analyse the optical density values of cadherin 5, VEGF, MMP9, SOD1, HO1, and eNOS in each group. (m) Immunohistochemistry analysis of CD34-positive blood vessels in flap area II of each group (magnification 200x; scale, 50 μm). (n) CD34-positive blood vessel density histograms. (q and r) Western blots were used to detect the autophagy indices for VPS34, Beclin-1, LC3II, P62, CTSD, and ATG-5 in each group and the pyroptosis indices ASC, caspase-1, GSDMD-N, IL-1 inhibitor, IL-18, and NLRP3. (s and t) ImageJ was used to quantitatively analyse the histogram of optical density values of autophagy and pyroptosis indicators in each group. The data are presented as the means ± standard error, n = 6 for each group. ns stands for nonsignificance, p < 0.05 and ∗∗p < 0.01.
Figure 6
Figure 6
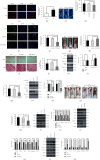
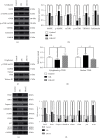
LIR promotes autophagy by activating TFEB activity. (a) On the 7th day after surgery, specimens were taken from the LIR, LIR+scramble, and LIR+TFEB shRNA groups for evaluation. Immunofluorescence analysis showed TFEB (red) nuclear translocation in the dermal cells of the flap (scale bar: 10 μm). (b) Histogram of the TFEB-positive cell percentage. (c) Laser Doppler blood flow scanning (scale bar: 0.5 cm) on the 7th day after surgery. (d) Histogram of blood flow signal intensity. (e) Expression of LC3II in flap tissues was detected by immunofluorescence analysis, and autophagosomes are shown (green) (scale bar: 10 μm). (f) Histogram of the LC3II-positive cell percentage. (g) Images of tissue oedema in each group on the 7th day after surgery (scale bar: 0.5 cm). (h) Histogram of the water content percentage of each tissue. (i) Immunohistochemistry analysis showing CD34-positive blood vessels in flap area II of each group, and haematoxylin and eosin (H&E) staining showing blood vessels in flap area II of each group (magnification 200x; scale bar: 50 μm). (j and m) Quantitative analysis of CD34-positive vascular density and histograms of the mean vascular density (MVD) in H&E images. (k and n) Western blot analysis of cytoplasmic TFEB levels and nuclear TFEB expression. (l and o) Histogram of the optical density values of cytoplasmic TFEB nuclear TFEB in each group. (p) Images of the degree of flap necrosis in each group on the 3rd and 7th days after surgery (scale bar: 0.5 cm). (q) Histogram of the survival area percentage of skin flaps on day 7 after surgery. (r) Western blots of the autophagy-related proteins VPS34, p62, Beclin-1, CTSD, and LC3II. (s) ImageJ was used to quantitatively analyse the optical density of VPS34, p62, Beclin-1, CTSD, and LC3II in each group. (t) Western blots of the oxidative stress-related proteins SOD1, eNOS, and HO1 and the angiogenesis-related proteins MMP9, cadherin 5, and VEGF. (u) The optical density values of SOD1, eNOS, HO1, MMP9, cadherin 5, and VEGF in each flap. (v) Western blots of pyroptosis-related proteins ASC, IL-18, IL-1β, caspase-1, GSDMD-N, and NLRP3. (W) Quantitative analysis of the optical density values of ASC, IL-18, IL-1β, caspase-1, GSDMD-N, and NLRP3 in each group. The data are presented as the means ± standard error, n = 6 for each group. p < 0.05 and ∗∗p < 0.01.
Figure 7
Figure 7
Liraglutide activates the AMPK-MCOLN1-calcineurin-TFEB signalling pathway. (a) On the 7th day after surgery, specimens were taken from the control, LIR, and LIR+CC groups for evaluation. Western blotting results showing AMPK, p-AMPK (ser485), mTOR, p-mTOR (ser2448), TRPML1 (MCOLN1), and calcineurin levels after internal GAPDH correction. (b) Histogram showing a quantitative comparison of AMPK, p-AMPK (ser485), mTOR, p-mTOR (ser2448), TRPML1 (MCOLN1), and calcineurin. (c) Western blotting results showing the level of cytoplasmic p-TFEB (ser221) after internal GAPDH correction, and the level of nuclear TFEB, which are corrected by histone H3. (d) Histogram showing the quantitative comparison of cytoplasmic p-TFEB (ser221) and nuclear TFEB levels between each group. (e) Western blot results revealing the protein levels of VEGF, SOD1, caspase-1, GSDMD-N, NLRP3, CTSD, p62, and LC3II corrected for GAPDH. (f) Histograms showing the quantified levels of VEGF, SOD1, caspase-1, GSDMD-N, NLRP3, CTSD, P62, and LC3II between each group. The data are presented as the means ± standard error, n = 6 for each group. p < 0.05 and ∗∗p < 0.01.
Figure 8
Figure 8
Mechanistic pathways by which liraglutide promotes flap survival through TFEB-mediated autophagy. Liraglutide activates the MCOLN1 channel (also known as TRPML1 channels) on lysosomes by stimulating AMPK, thereby releasing large amounts of Ca2+ and activating calcineurin. Calcineurin dephosphorylates TFEB, which then becomes activated and translocates into the nucleus, thereby stimulating autophagy. Upregulated autophagy inhibits oxidative stress and pyroptosis in flap tissues while stimulating angiogenesis.

Similar articles

Cited by

References

    1. Hashimoto I., Abe Y., Ishida S., et al. Development of skin flaps for reconstructive surgery: random pattern flap to perforator flap. The Journal of Medical Investigation. 2016;63(3.4):159–162. doi: 10.2152/jmi.63.159. - DOI - PubMed
    1. Ji C., Li R., Shen G., Zhang J., Liang W. Multiple pedicled flaps cover for large defects following resection of malignant tumors with partition concept. Medicine (Baltimore) 2017;96(27, article e7455) doi: 10.1097/MD.0000000000007455. - DOI - PMC - PubMed
    1. Blume P. A., Donegan R., Schmidt B. M. The role of plastic surgery for soft tissue coverage of the diabetic foot and ankle. Clinics in Podiatric Medicine and Surgery. 2014;31(1):127–150. doi: 10.1016/j.cpm.2013.09.006. - DOI - PubMed
    1. Campbell S. P., Moss M. L., Hugo N. E. When does a random flap die? Plastic and Reconstructive Surgery. 1992;89(4):718–721. doi: 10.1097/00006534-199204000-00023. - DOI - PubMed
    1. Chehelcheraghi F., Chien S., Bayat M. Mesenchymal stem cells improve survival in ischemic diabetic random skin flap via increased angiogenesis and VEGF expression. Journal of Cellular Biochemistry. 2019;120(10):17491–17499. doi: 10.1002/jcb.29013. - DOI - PubMed

LinkOut - more resources