

Subtypes identification on heart failure with preserved ejection fraction via network enhancement fusion using multi-omics data
- PMID: 33868594
- PMCID: PMC8039555
- DOI: 10.1016/j.csbj.2021.03.010
Subtypes identification on heart failure with preserved ejection fraction via network enhancement fusion using multi-omics data
Abstract
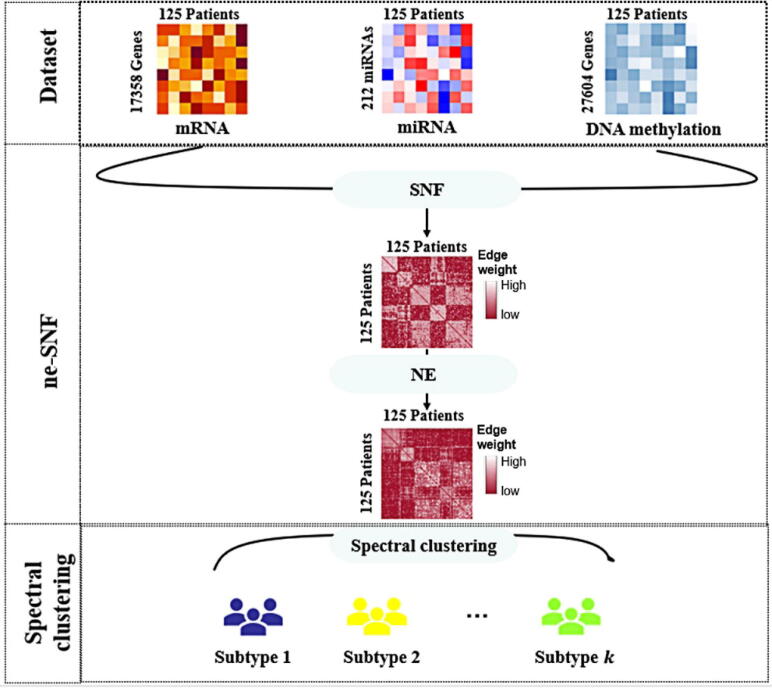
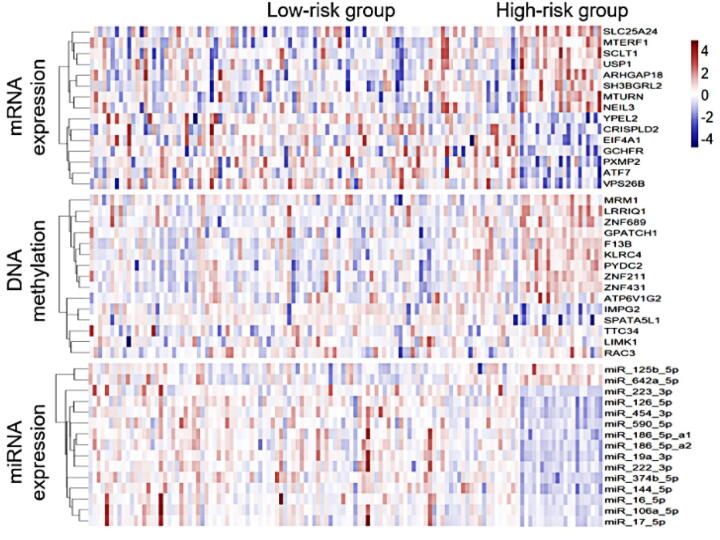
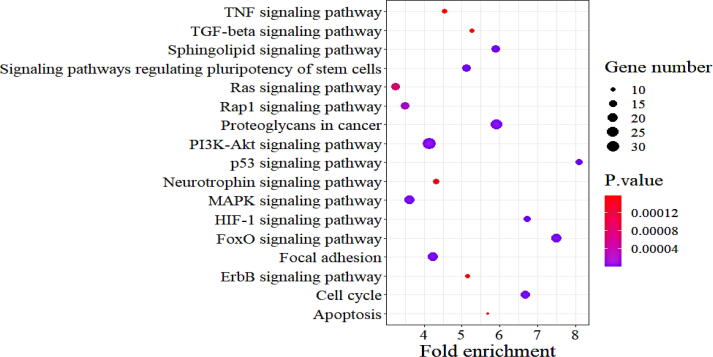
Heart failure with preserved ejection fraction (HFpEF) is associated with multiple etiologic and pathophysiologic factors. HFpEF leads to significant cardiovascular morbidity and mortality. There are various reasons that fail to identify effective therapeutic interventions for HFpEF, primarily due to its clinical heterogeneity causing significant difficulties in determining physiologic and prognostic implications for this syndrome. Thus, identifying clinical subtypes using multi-omics data has great implications for efficient treatment and prognosis of HFpEF patients. Here we proposed to integrate mRNA, DNA methylation and microRNA (miRNA) expression data of HFpEF with a similarity network fusion (SNF) method following a network enhancement (ne-SNF) denoising technique to form a fused network. A spectral clustering method was then used to obtain clusters of patient subtypes. Experiments on HFpEF datasets demonstrated that ne-SNF significantly outperforms single data subtype analysis and other integrated methods. The identified subgroups were shown to have statistically significant differences in survival. Two HFpEF subtypes were defined: a high-risk group (16.8%) and a low-risk group (83.2%). The 5-year mortality rates were 63.3% and 33.0% for the high- and low-risk group, respectively. After adjusting for the effects of clinical covariates, HFpEF patients in the high-risk group were 2.43 times more likely to die than the low-risk group. A total of 157 differentially expressed (DE) mRNAs, 2199 abnormal methylations and 121 DE miRNAs were identified between two subtypes. They were also enriched in many HFpEF-related biological processes or pathways. The ne-SNF method provides a novel pipeline for subtype identification in integrated analysis of multi-omics data.
Keywords: Biomarkers; HFpEF; Multi-omics data integration; Subtypes identification; ne-SNF.
© 2021 The Authors. Published by Elsevier B.V. on behalf of Research Network of Computational and Structural Biotechnology.
Conflict of interest statement
The authors declare that they have no known competing financial interests or personal relationships that could have appeared to influence the work reported in this paper.
Figures


Similar articles
-
A metagene based similarity network fusion approach for multi-omics data integration identified novel subtypes in renal cell carcinoma.Brief Bioinform. 2024 Sep 23;25(6):bbae606. doi: 10.1093/bib/bbae606. Brief Bioinform. 2024. PMID: 39562162 Free PMC article.
-
Multi-omics data integration for subtype identification of Chinese lower-grade gliomas: A joint similarity network fusion approach.Comput Struct Biotechnol J. 2022 Jul 2;20:3482-3492. doi: 10.1016/j.csbj.2022.06.065. eCollection 2022. Comput Struct Biotechnol J. 2022. PMID: 35860412 Free PMC article.
-
Morphometric, Hemodynamic, and Multi-Omics Analyses in Heart Failure Rats with Preserved Ejection Fraction.Int J Mol Sci. 2020 May 9;21(9):3362. doi: 10.3390/ijms21093362. Int J Mol Sci. 2020. PMID: 32397533 Free PMC article.
-
Heart Failure with Reduced Ejection Fraction (HFrEF) and Preserved Ejection Fraction (HFpEF): The Diagnostic Value of Circulating MicroRNAs.Cells. 2019 Dec 16;8(12):1651. doi: 10.3390/cells8121651. Cells. 2019. PMID: 31888288 Free PMC article. Review.
-
How do patients with heart failure with preserved ejection fraction die?Eur J Heart Fail. 2013 Jun;15(6):604-13. doi: 10.1093/eurjhf/hft062. Epub 2013 Apr 21. Eur J Heart Fail. 2013. PMID: 23610137 Review.
Cited by
-
A metagene based similarity network fusion approach for multi-omics data integration identified novel subtypes in renal cell carcinoma.Brief Bioinform. 2024 Sep 23;25(6):bbae606. doi: 10.1093/bib/bbae606. Brief Bioinform. 2024. PMID: 39562162 Free PMC article.
-
Regulatory mechanism of fibrosis-related genes in patients with heart failure.Front Genet. 2022 Oct 17;13:1032572. doi: 10.3389/fgene.2022.1032572. eCollection 2022. Front Genet. 2022. PMID: 36324504 Free PMC article.
-
Myocardial RNA Sequencing Reveals New Potential Therapeutic Targets in Heart Failure with Preserved Ejection Fraction.Biomedicines. 2023 Jul 28;11(8):2131. doi: 10.3390/biomedicines11082131. Biomedicines. 2023. PMID: 37626628 Free PMC article.
-
Prognostic and predictive microRNA panels for heart failure patients with reduced or preserved ejection fraction: a meta-analysis of Kaplan-Meier-based individual patient data.BMC Med. 2025 Jul 7;23(1):409. doi: 10.1186/s12916-025-04238-0. BMC Med. 2025. PMID: 40624658 Free PMC article.
-
Identifying novel subgroups in heart failure patients with unsupervised machine learning: A scoping review.Front Cardiovasc Med. 2022 Jul 22;9:895836. doi: 10.3389/fcvm.2022.895836. eCollection 2022. Front Cardiovasc Med. 2022. PMID: 35935639 Free PMC article.
References
-
- Redfield M.M. Heart failure with preserved ejection fraction. N Engl J Med. 2016;375(19):1868–1877. - PubMed
-
- Zile M.R., Brutsaert D.L. New concepts in diastolic dysfunction and diastolic heart failure: part I-diagnosis, prognosis, and measurements of diastolic function. Circulation. 2002;105(11):1387–1393. - PubMed
LinkOut - more resources
Full Text Sources
Other Literature Sources