. 2021 Apr 1:11:593587.
doi: 10.3389/fonc.2021.593587. eCollection 2021.

A Nomogram Combining a Four-Gene Biomarker and Clinical Factors for Predicting Survival of Melanoma

Affiliations

A Nomogram Combining a Four-Gene Biomarker and Clinical Factors for Predicting Survival of Melanoma

Chuan Zhang et al. Front Oncol. .

Abstract

Background: Currently there is no effective prognostic indicator for melanoma, the deadliest skin cancer. Thus, we aimed to develop and validate a nomogram predictive model for predicting survival of melanoma.

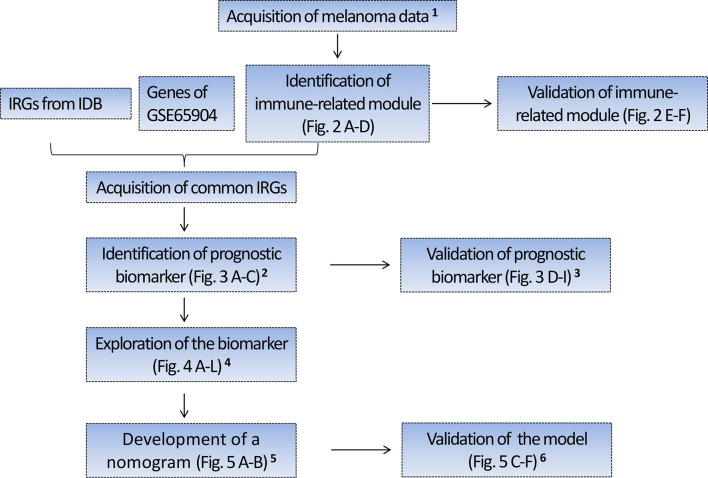
Methods: Four hundred forty-nine melanoma cases with RNA sequencing (RNA-seq) data from TCGA were randomly divided into the training set I (n = 224) and validation set I (n = 225), 210 melanoma cases with RNA-seq data from Lund cohort of Lund University (available in GSE65904) were used as an external test set. The prognostic gene biomarker was developed and validated based on the above three sets. The developed gene biomarker combined with clinical characteristics was used as variables to develop and validate a nomogram predictive model based on 379 patients with complete clinical data from TCGA (Among 470 cases, 91 cases with missing clinical data were excluded from the study), which were randomly divided into the training set II (n = 189) and validation set II (n = 190). Area under the curve (AUC), concordance index (C-index), calibration curve, and Kaplan-Meier estimate were used to assess predictive performance of the nomogram model.

Results: Four genes, i.e., CLEC7A, CLEC10A, HAPLN3, and HCP5 comprise an immune-related prognostic biomarker. The predictive performance of the biomarker was validated using tROC and log-rank test in the training set I (n = 224, 5-year AUC of 0.683), validation set I (n = 225, 5-year AUC of 0.644), and test set I (n = 210, 5-year AUC of 0.645). The biomarker was also significantly associated with improved survival in the training set (P < 0.01), validation set (P < 0.05), and test set (P < 0.001), respectively. In addition, a nomogram combing the four-gene biomarker and six clinical factors for predicting survival in melanoma was developed in the training set II (n = 189), and validated in the validation set II (n = 190), with a concordance index of 0.736 ± 0.041 and an AUC of 0.832 ± 0.071.

Conclusion: We developed and validated a nomogram predictive model combining a four-gene biomarker and six clinical factors for melanoma patients, which could facilitate risk stratification and treatment planning.

Keywords: immune genes; melanoma; microenvironment; nomogram; prognostic biomarker.


Conflict of interest statement

The authors declare that the research was conducted in the absence of any commercial or financial relationships that could be construed as a potential conflict of interest.

Figures

Figure 1
Figure 1
Flow chart depicting the protocol. 1 Four hundred forty-nine melanoma cases with RNA sequencing (RNA-seq) data from TCGA were randomly divided into the training set I (n = 224) and validation set I (n = 225), 210 melanoma cases with RNA-seq data from Lund cohort of Lund University (available in GSE65904) were used as an external test set. The above three sets were used to identify and validate a prognostic gene biomarker. 2 Based on the training set I, we identified a four-gene biomarker from 56 IRGs using the univariate Cox regression analysis and LASSO regression analysis. 3 The predictive performance of the four-gene biomarker was validated in the training set I, validation set I, and an external test set (GSE65904). 4 Exploration of the biomarker includes the association of the four-gene biomarker with the patient’s survival, immune score, clinical stage, tissue pathological type, tumor-infiltrating immune cells, and KEGG pathway. 5 Four hundred seventy melanoma cases with clinical data were obtained from TCGA and 91 cases with missing clinical data were excluded from the study. Three hundred seventy-nine cases with complete clinical data were subsequently randomly assigned to the training group II (n = 189) and validation group II (n = 190), which were used to develop and validate the nomogram predictive model. In developing the nomogram, the four-gene biomarker and clinical characteristics were used as variables. 6 The predictive power of nomogram combining the four-gene biomarker and clinical characteristics was assessed in the training set II and validation set II. IRGs, immune-related genes; IDB, the InnateDB database.
Figure 2
Figure 2
Identification and validation of immune-related modules (A, B) Analysis of network topology for various soft-thresholding powers. (A) This panel shows the scale-free fit index as a function of the soft-thresholding power. (B) This panel displays the mean connectivity as a function of the soft-thresholding power. (C) Clustering dendrogram of genes, with dissimilarity based on topological overlap, together with assigned merged module colors and the original module colors. Each color represents a module. (D) Module-trait association. Each row represents a module, and each column represents a trait. Each cell contains the corresponding correlation and P value. Module Black (MEblack) is the most immune score-related (P = 3e-155, R = 0.89). (E) The top 10 categories are all immune-related in GO enrichment analysis based on genes in Module Black, supporting genes in Module Black are indeed immune-related. (F) Most of the top 15 KEGG pathways are also immune-related, underscoring genes of Module Black are related to immunity.
Figure 3
Figure 3
Identification and validation of four-gene biomarker (A) Univariate Cox regression were used to screen for genes that were significantly correlated with overall survival in the training set I (n = 224). Twelve genes with P value less than 0.05 were significantly associated with overall survival, as shown in the forest plot. (B–C) LASSO regression was used to further eliminate redundant genes. The resulting four genes of CLEC7A, CLEC10A, HAPLN3, and HCP5 were used to develop a four-gene biomarker based on multivariate Cox regression model. (B) Tuning parameter (λ) selection in the LASSO model used 10-fold cross-validation via minimum criteria. AUC was plotted versus log(λ). (C) Coefficient profiles of the fractions of 12 immune-related genes. (D–F) One-, 3-, and 5-year AUC were calculated for the prognostic four-gene biomarker, showing good predictive performance in the training set I, validation set I, and test set. (G–I) Risk scores of melanoma cases were calculated according to multivariate Cox regression model of the four genes, and grouped into low-risk and high-risk group using median risk score as threshold. Low-risk group has a significant longer survival compared to high-risk group, in the training set I, validation set I, and test set.
Figure 4
Figure 4
Exploration of the four-gene biomarker (A–C) Risk scores of melanoma patients from TCGA cohort were calculated according to the four-gene biomarker, and the association of risk scores with common clinical characteristics were investigated. (A) Risk score was negatively correlated with immune score, consistent with low-risk patients who had a prolonged survival in melanoma. (B) There was a marked difference in risk score between stage I and stage II, as well as between stage II and stage III, implying qualitative change occurred after stage II. (C) The numbers of M1 macrophage, NK, CD4+, and CD8+ T cells were critically elevated in the low-risk group (the blue dot indicates TIICs whose counts are increased in the low-risk group, while the yellow dot indicates TIICs whose counts are increased in the high-risk group). (D) KEGG pathway analysis by GSEA displayed significantly differentially enriched pathways between the low-risk and high-risk groups. Each blue dot represents a significantly enriched pathway in the low-risk group, while yellow dot represents that in the high-risk group. (E–H) Four genes, CLEC7A, CLEC10A, HAPLN3, and HCP5, had a significant relevance with respect to survival; this is indicative of their anti-tumoral roles in melanoma. (I–L) The top four pathways in the low-risk group were all immune-related, indicating more active immune function in low-risk group compared to in the high-risk group.
Figure 5
Figure 5
Development and validation of a predictive nomogram for predicting survival probability. (A, B) Development of a predictive nomogram combing the four-gene biomarker and clinical factors in melanoma based on the training set II. (A) Univariate Cox regression were used to screen for clinical factors that were significantly correlated with overall survival in the training set II (n = 189), as shown in the forest plot. Seven factors including the four-gene biomarker were significantly associated with overall survival. (B) A nomogram combing the four-gene biomarker and clinical factors for predicting 3- and 5-year overall survival for melanoma patients. Cancer status represents personal cancer status (with tumor/tumor-free), which is one of the clinical characteristics for melanoma patients. (C–F) Four criteria were utilized to assess the predictive performance in the training set II and validation set II. (C) AUC and C-index were calculated for the nomogram prognostic models in the training set (n = 189) and validation set (n = 190). AUC of the nomogram was 0.862 ± 0.062 and 0.832 ± 0.071, and C-index was 0.853 ± 0.024 and 0.736 ± 0.041, in the training group and validation group, respectively. (D) Calibration curves of nomograms in training set and validation set. X-axis represents predicted probability and Y-axis represents true probability. Each point in the plot represents a subgroup of patients. Error bars represent 95% confidence intervals. 45° represents perfect prediction, and the actual performances of our nomogram are very well. (E, F) The resulting nomogram prognostic model was utilized to calculate risk score of cases in the training set and validation set. Low risk score subgroup had a significantly improved survival compared to high risk score (grouped according to median risk score value), in training set and validation set. The findings support the predictive power of the proposed nomogram.

Similar articles

Cited by

References

    1. Gershenwald JE, Guy GP, Jr. Stemming the Rising Incidence of Melanoma: Calling Prevention to Action. J Natl Cancer Inst (2016) 108(1):djv381. 10.1093/jnci/djv381 - DOI - PMC - PubMed
    1. Tripp MK, Watson M, Balk SJ, Swetter SM, Gershenwald JE. State of the science on prevention and screening to reduce melanoma incidence and mortality: The time is now. CA Cancer J Clin (2016) 66:460–80. 10.3322/caac.21352 - DOI - PMC - PubMed
    1. Rastrelli M, Tropea S, Rossi CR, Alaibac M. Melanoma: epidemiology, risk factors, pathogenesis, diagnosis and classification. In Vivo (2014) 28:1005–11. - PubMed
    1. Watts CG, Madronio C, Morton RL, Goumas C, Armstrong BK, Curtin A, et al. . Clinical Features Associated With Individuals at Higher Risk of Melanoma: A Population-Based Study. JAMA Dermatol (2017) 153:23–9. 10.1001/jamadermatol.2016.3327 - DOI - PubMed
    1. Yan Y, Leontovich AA, Gerdes MJ, Desai K, Dong J, Sood A, et al. . Understanding heterogeneous tumor microenvironment in metastatic melanoma. PloS One (2019) 14:e0216485. 10.1371/journal.pone.0216485 - DOI - PMC - PubMed

LinkOut - more resources