. 2021 Mar 29:11:592842.
doi: 10.3389/fcimb.2021.592842. eCollection 2021.

Preoperative Microbiomes and Intestinal Barrier Function Can Differentiate Prodromal Alzheimer's Disease From Normal Neurocognition in Elderly Patients Scheduled to Undergo Orthopedic Surgery

Affiliations

Preoperative Microbiomes and Intestinal Barrier Function Can Differentiate Prodromal Alzheimer's Disease From Normal Neurocognition in Elderly Patients Scheduled to Undergo Orthopedic Surgery

Mei Duan et al. Front Cell Infect Microbiol. .

Abstract

Objective: Emerging evidence links perturbations in the microbiome to neurodegeneration in amnestic mild cognitive impairment (aMCI) and Alzheimer's disease (AD) and to surgical stress. In this study, we attempted to identify preoperative differences intestinal microbiota (IM) and barrier function between pAD [prodromal AD: Subjective cognitive decline (SCD) and aMCI] patients and normal neurocognition (NC) patients. Additionally, the potential associations between IM and barrier function, inflammation, and the clinical characteristics of pAD were evaluated.

Design: Eighty elderly patients scheduled to undergo orthopedic surgery were consecutively enrolled and grouped as NC, SCD, and aMCI following neuropsychological assessment. IM was determined by 16S rRNA MiSeq sequencing, and PICRUSt was used to predict functional shifts in IM. Furthermore, we investigated the association between IM and plasma claudin-1, occludin, LPS, systemic inflammatory cytokines, neuropsychological assessment, and clinical characteristics.

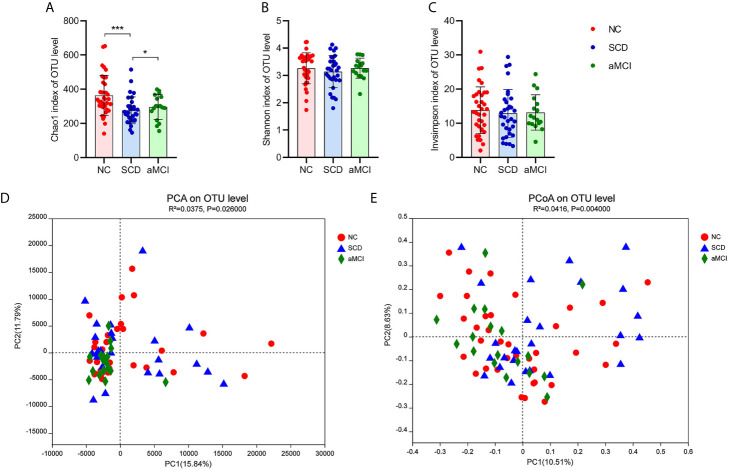
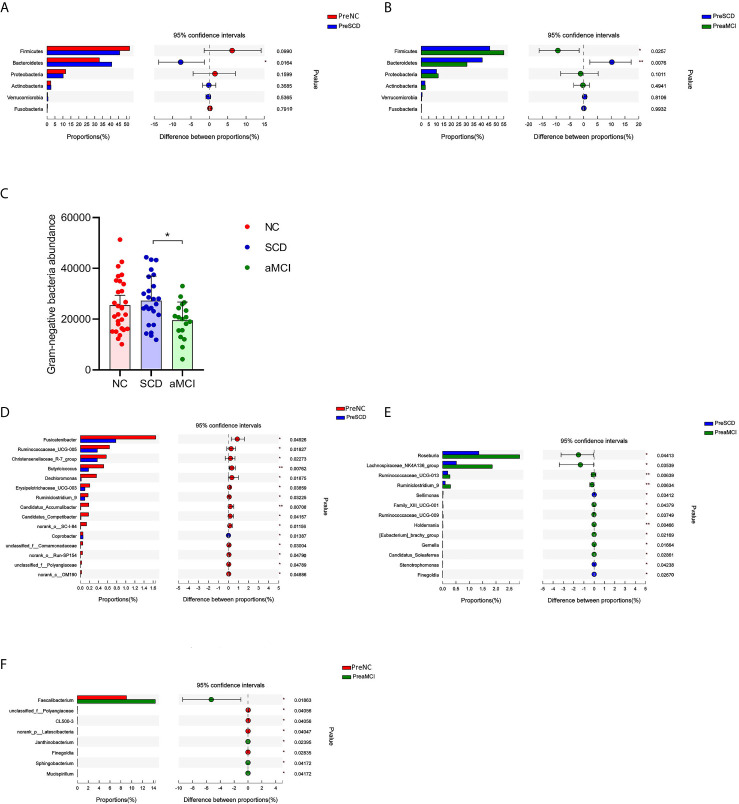
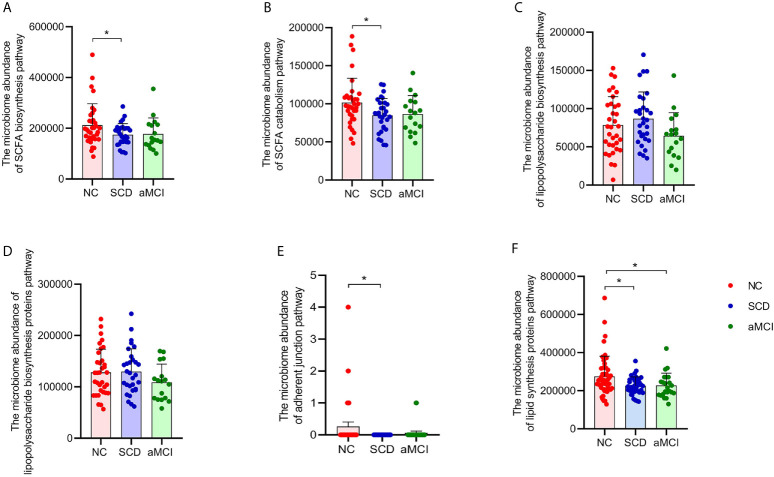
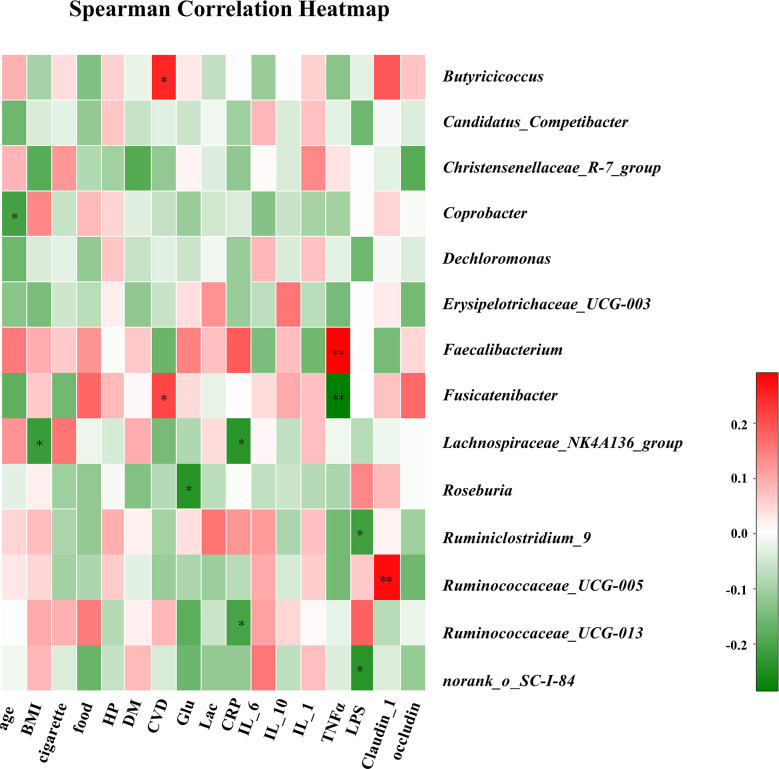
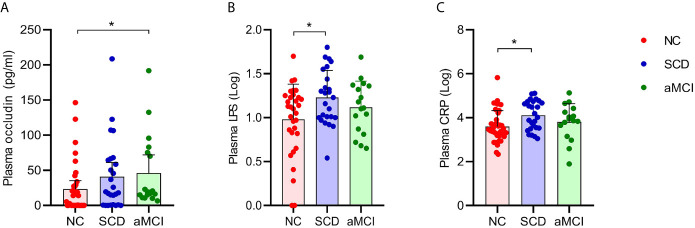
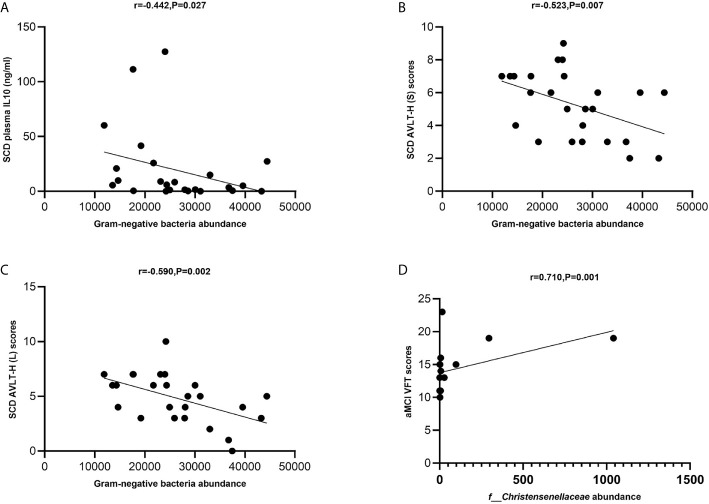
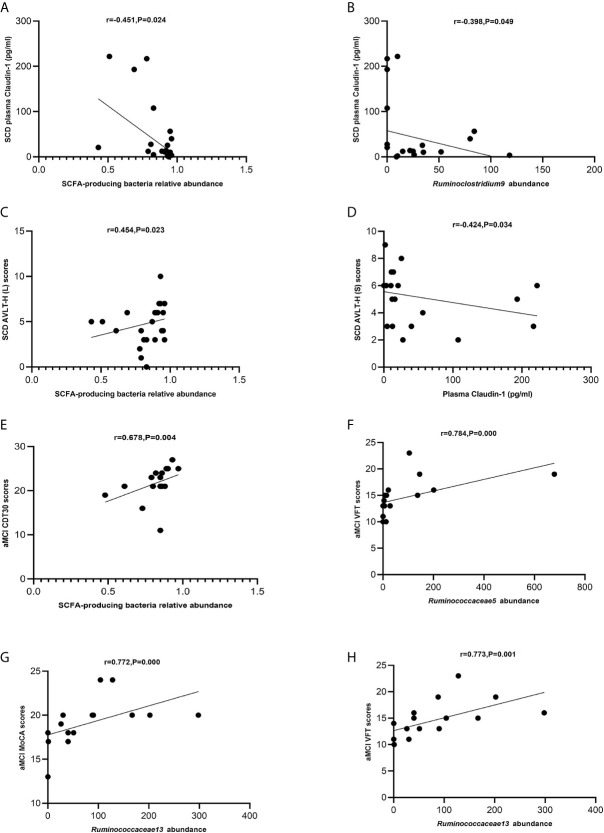
Results: There was a lower Chao1 index in the SCD group (P = 0.004) and differences in beta diversity among the three groups (PCA: P = 0.026, PCoA: P= 0.004). The relative abundance of Bacteroidetes was higher in the SCD group (P = 0.016, P = 0.008), and Firmicutes were more enriched in the aMCI group than in the SCD group (P= 0.026). At the family level, the total abundance of Gram-negative bacteria was higher in the SCD group than in the aMCI group (P = 0.047), and the Christensenellaceae family was detected at lower levels in the SCD and aMCI groups than in the NC group (P= 0.039). At the genus level, the eleven short-chain fatty acid (SCFA)-producing bacteria exhibited differences among the three groups. PICRUSt analysis showed that the pathways involved in SCFA catabolism, biosynthesis, and adherent junctions were reduced in SCD patients, and lipid synthesis proteins were reduced in pAD patients. Meanwhile, elevated plasma LPS and CRP were observed in SCD patients, and higher plasma occludin in aMCI patients. The IM was correlated with plasma claudin-1, LPS, inflammatory factors, neuropsychological assessment, and clinical characteristics.

Conclusion: The intestines of SCD and aMCI patients preoperatively exhibited IM dysbiosis and barrier dysfunction, and elevated plasma LPS and CRP were observed in SCD patients.

Keywords: elderly patients; intestinal barrier dysfunction; intestinal microbial dysbiosis; orthopedic surgery; preoperative period; prodromal Alzheimer’s disease; systemic inflammation.


Conflict of interest statement

The authors declare that the research was conducted in the absence of any commercial or financial relationships that could be construed as a potential conflict of interest.

Figures

Figure 1
Figure 1
(A–E) Alpha and Beta diversity analysis in intestinal flora between different cognitive groups. (A–C) The X axis and the Y axis represent the groups and alpha diversity indices respectively. And the error bar means the standard deviation. Wilcoxon rank-sum test showed that the differences in chao1 index among the three groups were significant at the OTU level (*P-value < 0.05, ***P-value < 0.005, Wilcoxon rank sum test), which meant that the species richness of intestinal flora in the SCD group was lower than in the other two groups. Shannon and inverse Simpson indices were not different significantly among three groups, which indicated that the species evenness of intestinal flora was not obvious different between three groups (P-value > 0.05, Wilcoxon rank sum test). (D, E) The X axis and the Y axis represent two selected principal coordinate axes, and the percentage represent the interpretation value of the principal coordinate axis for the difference in sample composition. Each point represents a sample, whereas red circle, blue triangle, and green square represent the NC, SCD, and aMCI groups respectively. The closer the two sample points are, the more similar the species composition of the two samples is. Beta-diversity analysis results showed that the species composition in three groups was obvious different from each other. PCA and PCoA analysis both indicated that ANOSIM test results had a significant P value (PCA analysis: R2 = 0.0375, P = 0.026; PCoA analysis: R2 = 0.0416, P = 0.004).
Figure 2
Figure 2
(A–F) Relative bacterial abundance and differences from phylum down to genus levels between different cognitive groups (A–B) The vertical axis is the different bacteria phyla and the horizontal axis is the proportion of phyla in the sample. The columns with red, blue, and green colors represent the NC, SCD, and aMCI groups, whereas the length of the columns represents the proportion of the phyla. And the interval between the left and the right bar represents the 95% confidence intervals. There were more bacteroidetes in the SCD group than in the other two groups, and less Firmicutes than in the aMCI group (*P-value < 0.05, **P-value < 0.01, Wilcoxon rank sum test). (C) The horizontal axis is the cognitive groups and the vertical axis is the abundance of Gram-negative bacteria at the family level. The columns with red, blue, and green colors represent the NC, SCD, and aMCI groups respectively. Wilcoxon rank sum test showed that the abundance of Gram-negative bacteria at the family level was higher in the SCD group than that in the aMCI group (*P-value = 0.047, Wilcoxon rank sum test). (D–F) The vertical axis is the different bacteria genera and the horizontal axis is the proportion of genera in the sample. The columns with red, blue, and green colors represent the NC, SCD, and aMCI groups, whereas the length of the columns represents the proportion of the genera. And the interval between the left and the right bar represents the 95% confidence intervals. Wilcoxon rank-sum test shows that the differences in relative abundance of gut bacteria among the three groups were significant at the genus level (*P-value < 0.05, **P-value < 0.01, ***P-value < 0.005, Wilcoxon rank sum test).
Figure 3
Figure 3
(A–F) Prediction analysis in intestinal flora between different cognitive groups. PICRUST compared the KEGG database to get the microbiome abundance of each metabolic pathway at KEGG pathway level 3. The Y axis and the X axis represent the intestinal abundance of each metabolic pathway at KEGG pathway level 3 and groups respectively, and the error bar means the standard deviation. The columns with red, blue, and green colors represent the NC, SCD, and aMCI groups respectively. Wilcoxon rank sum test showed that there were higher abundance of three metabolic pathways in NC group than those in SCD group (*P-value < 0.05, Wilcoxon rank sum test), including short-chain fatty acid biosynthesis (KEGG pathway id: ko00061; (A) and catabolism (KEGG pathway id: ko00071; (B) and adherent junction (KEGG pathway id: ko04520; (E). There was insignificant difference between three cognitive groups in lipopolysaccharide biosynthesis (KEGG pathway id: ko00540; (C) and lipopolysaccharide biosynthesis proteins (KEGG pathway id: ko00541; (D) (*P-value < 0.05, Wilcoxon rank sum test). And Lipid biosynthesis proteins (KEGG pathway id: ko00537; (F) were lower in SCD and aMCI group compared with NC group (P = 0.018 and 0.027; Wilcoxon rank sum test).
Figure 4
Figure 4
Correlation analysis of clinical parameters and gut microbiota. The association between 17 clinical parameters and significant bacterial genera with altered abundances among the three groups is estimated using the heat map of Spearman’s correlation analysis. Color intensity represents the magnitude of correlation. Red, positive correlations; Green, negative correlations. P-value < 0.05, **P-value < 0.01.
Figure 5
Figure 5
(A–C) Analysis of plasma factors levels between NC and pAD patients. The Y axis represents the concentration of plasma occludin, Log10LPS, and Log10CRP. The X axis represents the groups and the error bar means standard deviation. Wilcoxon rank sum test shows a significant difference in the plasma occludin levels between the aMCI group and the NC group (A) (*P-value < 0.05, Wilcoxon rank sum test). Wilcoxon rank sum test shows that the plasma Log10LPS and Log10CRP levels in the SCD group are significantly higher than those in the NC groups (B, C).
Figure 6
Figure 6
(A–D) Spearman’s correlation analysis between Gram-negative bacteria and inflammatory factors and neuropsychological assessment of pAD groups. (A) Spearman’s correlation analysis outcome shows that the levels of total Gram-negative bacteria were negatively correlated with plasma IL-10 level in the SCD group (Spearman correlation r = −0.442, P = 0.027; Linear regression equation: Y = −0.001195*X + 49.42, P = 0.1235). (B, C) The levels of total Gram-negative bacteria were negatively correlated with AVLT-H (S) and AVLT-H (L) respectively in the SCD group (Spearman correlation r = −0.523, P = 0.007 and r = −0.590, P = 0.002; Linear regression equation: Y = −9.806e-005*X + 7.872 and Y = −0.0001264*X + 8.162, P = 0.0244 and 0.0079). (D) The abundance of the Christensenellaceae family was positively with VFT in the aMCI group (Spearman correlation r = 0.710, P = 0.001; Linear regression equation: Y = 0.006150*X + 13.75, P = 0.0811).
Figure 7
Figure 7
(A–H) Spearman’s correlation analysis between SCFA-producing bacteria and tight junction proteins and neuropsychological assessment of pAD groups. (A) Spearman’s correlation analysis outcome shows that the concentration of plasma claudin-1 was negatively correlated with the relative abundance of the SCFA-producing bacteria in the SCD group (r = −0.451, P = 0.024; Linear regression equation: Y = −224.0*X + 224.5, P = 0.0229). (B) Spearman’s correlation analysis outcome shows that the concentration of plasma claudin-1 was negatively correlated with the relative abundance of the SCFA-producing bacteria Ruminoclostridium9 in the SCD group (r = −0.398, P = 0.049; Linear regression equation: Y = −0.5602*X + 57.64, P = 0.0962). (C) Spearman’s correlation analysis between the relative abundance of SCFA-producing bacteria and AVLT-H (L) scores in the SCD group (r = 0.454, P = 0.023; Linear regression equation: Y = 3.847*X + 1.610, P = 0.2345). (D) Spearman’s correlation analysis between the concentration of plasma caludin-1 and AVLT-H (S) scores in the SCD group (r = 0.424, P = 0.034; Linear regression equation: Y = −0.008021*X + 5.555, P = 0.1623). (E) Spearman’s correlation analysis between the relative abundance of SCFA-producing bacteria and CDT30 in the aMCI group (r = 0.678, P = 0.004; Linear regression equation: Y = 12.68*X + 11.33, P = 0.1302). (F) Spearman’s correlation analysis between the relative abundance of SCFA-producing bacteria Ruminococcaceae5 and VFT scores in the aMCI group (r = 0.784, P= 0.000; Linear regression equation: Y = 0.01098*X + 13.63, P = 0.0359). (G) Spearman’s correlation analysis between the relative abundance of the SCFA-producing bacteria Ruminococcaceae13 and MoCA-B scores in the aMCI group (r = 0.772, P = 0.000; Linear regression equation: Y = 0.01652*X + 17.76, P = 0.0368). (H) Spearman’s correlation analysis between the relative abundance of the SCFA-producing bacteria Ruminococcaceae13 and VFT scores in the aMCI group (r = 0.773, P = 0.001; Linear regression equation: Y = 0.02425*X + 12.65, P = 0.019).

Similar articles

Cited by

References

    1. Baars L. M. A. E., van Boxtel M. P. J., Visser P. J., Verhey F. R. J., Jolles J. (2008). O2-01-03: Is mild cognitive impairment a stable diagnostic entity? Alzheimer’s Dementia 4 (4), T131. 10.1016/j.jalz.2008.05.306 - DOI
    1. Beydoun M. A., Dore G. A., Canas J. A., Liang H., Beydoun H. A., Evans M. K., et al. . (2018). Systemic Inflammation Is Associated With Longitudinal Changes in Cognitive Performance Among Urban Adults. Front. Aging Neurosci. 10, 313. 10.3389/fnagi.2018.00313 - DOI - PMC - PubMed
    1. Bonfili L., Cecarini V., Berardi S., Scarpona S., Suchodolski J. S., Nasuti C., et al. . (2017). Microbiota modulation counteracts Alzheimer’s disease progression influencing neuronal proteolysis and gut hormones plasma levels. Sci. Rep. 7 (1), 2421–2426. 10.1038/s41598-017-02587-2 - DOI - PMC - PubMed
    1. Brown G. C. (2019). The endotoxin hypothesis of neurodegeneration. J. Neuroinflamm. 16 (1), 180. 10.1186/s12974-019-1564-7 - DOI - PMC - PubMed
    1. Calderón-Pérez L., Gosalbes M. J., Yuste S., Valls R. M., Pedret A., Llauradó E., et al. . (2020). Gut metagenomic and short chain fatty acids signature in hypertension: a cross-sectional study. Sci. Rep. 10 (1), 6436. 10.1038/s41598-020-63475-w - DOI - PMC - PubMed

Publication types

Substances