. 2021 Mar 23:11:628327.
doi: 10.3389/fcimb.2021.628327. eCollection 2021.

Salivary Microbiome Variation in Early Childhood Caries of Children 3-6 Years of Age and Its Association With Iron Deficiency Anemia and Extrinsic Black Stain

Affiliations

Salivary Microbiome Variation in Early Childhood Caries of Children 3-6 Years of Age and Its Association With Iron Deficiency Anemia and Extrinsic Black Stain

Rui Han et al. Front Cell Infect Microbiol. .

Abstract

ECC is a common clinical manifestation of the oral cavity in childhood and Iron deficiency-anemia (IDA) is a high-risk factor but extrinsic black stain on the tooth surface is a protective factor for caries. There is limited information about oral microecological change in early children who suffer from ECC with IDA and extrinsic black stain (BS). This study enrolled 136 children aged 3-6 years. Dental caries and teeth BS were examined. Saliva was collected for 16S rRNA gene and fingertip blood were for Hemoglobin test. There are 93 ECC including 13 with IDA (IDA ECC) and 80 without IDA (NIDA ECC) and 43 caries free (CF) including 17 with BS (BSCF) and 26 without BS (NBS CF). Statistical analysis of microbiota data showed differences of the oral flora in different groups. The oral flora of the IDA ECC group had a high diversity, while the BSCF group had a low diversity. The bacterial genera Bacillus, Moraxella, and Rhodococcus were enriched in the IDA ECC while Neisseria was enriched in the NIDA ECC. Neisseria only exhibited high abundance in the BSCF, and the remaining genera exhibited high abundance in the NBSCF. Interestingly, the BSCF had the same trend as the NIDA ECC, and the opposite trend was observed with IDA ECC. We established random forest classifier using these biomarkers to predict disease outcomes. The random forest classifier achieved the best accuracy in predicting the outcome of caries, anemia and black stain using seven, one and eight biomarkers, respectively; and the accuracies of the classifiers were 93.35%, 94.62% and 95.23%, respectively. Our selected biomarkers can achieve good prediction, suggesting their potential clinical implications.

Keywords: children 3-6 years of age; early childhood caries (ECC); extrinsic black stain (BS); iron deficiency anemia (IDA); salivary microbiome variation.


Conflict of interest statement

The authors declare that the research was conducted in the absence of any commercial or financial relationships that could be construed as a potential conflict of interest.

Figures
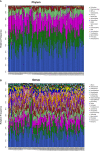
Figure 1
Figure 1
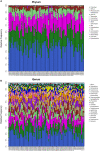
(A) The composition of phyla with ECC (including IDA ECC and NIDA ECC) and CF (including BSCF and NBSCF). Bar plot of percentage abundance at the phylum level in every sample. The horizontal axis is the name of each sample. They are ECC (including IDA ECC 1-13 and NIDA ECC 1-80) and CF (including BSCF 1-17 and NBSCF 1-26). (B) The composition of genera with ECC (including IDA ECC and NIDA ECC) and CF (including BSCF and NBSCF). Bar plot of percentage abundance at the genus level in every sample. The horizontal axis is the name of each sample. They are ECC (including IDA ECC 1-13 and NIDA ECC 1-80) and CF (including BSCF 1-17 and NBSCF 1-26).
Figure 2
Figure 2
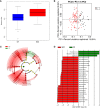
(A) Alpha diversity measurements using a Shannon index analysis indicated that ECC samples had higher genus diversity than CF samples. p.shannon ≤ 0.001. (B) Unweighted UnifracPCoA analysis. For each sample, the first two principal coordinates (PCo1 and PCo2) from the principal coordinate analysis of weighted UniFrac are plotted. The variance as calculated by PCoA is indicated in parentheses on the axes. ECC (black dots): saliva samples from ECC subjects. CF (red dots): saliva samples from CF subjects. (C) Cladogram of taxonomic biomarkers between the ECC and CF groups as identified by LEfSe. Green and red indicate data from the CF and ECC groups, respectively. (D) LDA score bar plot of taxonomic biomarkers between the ECC and CF groups as identified by LEfSe. Green represents the CF group. Genus of bacteria with high content. Red represents the ECC group. Genus of bacteria with high content.
Figure 3
Figure 3
(A) The composition of phyla with NIDA ECC and IDA ECC. Bar plot of percentage abundance at the phylum level in every sample. The horizontal axis is the name of each sample. They are NIDA ECC1-80 and IDA ECC1-13. (B) The composition of genera with NIDA ECC and IDA ECC. Bar plot of percentage abundance at the genus level in every sample. The horizontal axis is the name of each sample. they are NIDA ECC1-80 and IDA ECC1-13.
Figure 4
Figure 4
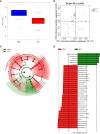
(A) Alpha diversity measurements using Simpson index analysis indicated that IDA ECCs had higher genus diversity than NIDA ECCs (p.simpson = 0.024 <0.05). (B) Unweighted UnifracPCoA analysis. For each sample, the first two principal coordinates (PCo1 and PCo2) from the principal coordinate analysis of weighted UniFrac are plotted. The variance as calculated by PCoA is indicated in parentheses on the axes. NIDA ECC (black dots): saliva samples from IDA-free ECC subjects. IDA ECC (red dots): saliva samples from IDA ECC subjects. (C) Cladogram of taxonomic biomarkers between the IDA ECC and NIDA ECC groups as identified by LEfSe. Green and red indicate data from the IDA ECC and NIDA ECC groups, respectively. (D) LDA score bar plot of taxonomic biomarkers between the IDA ECC and NIDA ECC groups as identified by LEfSe. Green represents the IDA ECC group. Genus of bacteria with high content. Red represents the NIDA ECC group. Genus of bacteria with high content.
Figure 5
Figure 5
(A) The composition of phyla with NBSCF and BSCF. Bar plot of percentage abundance at the phylum level in every sample. The horizontal axis is the name of each sample. They are NBSCF1-26 and BSCF1-17. (B) The composition of genera with NBSCF and BSCF. Bar plot of percentage abundance at the genus level in every sample. The horizontal axis is the name of each sample. They are NBSCF1-26 and BSCF1-17.
Figure 6
Figure 6
(A) Alpha diversity measurements using a Shannon index analysis indicated that NBSCF samples had higher genus diversity than BSCF samples. p.shannon = 0.00002 < 0.05. (B) Unweighted UnifracPCoA analysis. For each sample, the first two principal coordinates (PCo1 and PCo2) from the principal coordinate analysis of weighted UniFrac are plotted. The variance as calculated by PCoA is indicated in parentheses on the axes. NBSCF (black dots): saliva samples from NBSCF subjects. BSCF (red dots): saliva samples from BSCF subjects. (C) Cladogram of taxonomic biomarkers between the nonblack stain caries-free (NBSCF) and black stain caries-free (BSCF) groups as identified by LEfSe. Green and red indicate data from the BSCF and NBSCF groups, respectively. (D) LDA score bar plot of taxonomic biomarkers between nonblack stain caries-free (NBSCF) and black stain caries-free (BSCF) groups as identified by LEfSe. Green represents the BSCF group genus of bacteria with high content. Red represents the NBSCF group genus of bacteria with high content.

Similar articles

Cited by

References

    1. (2016. b). Policy on Early Childhood Caries (ECC): Classifications, Consequences, and Preventive Strategies. Pediatr. Dent. 38 (6), 52–54. - PubMed
    1. Bansal K., Goyal M., Dhingra R. (2016). Association of severe early childhood caries with iron deficiency anemia. J. Indian Soc. Pedod. Prev. Dent. 34 (1), 36–42. 10.4103/0970-4388.175508 - DOI - PubMed
    1. Caporaso J. G., Kuczynski J., Stombaugh J., Bittinger K., Bushman F. D., Costello E. K., et al. . (2010). QIIME allows analysis of high-throughput community sequencing data. Nat. Methods 7 (5), 335–336. 10.1038/nmeth.f.303 - DOI - PMC - PubMed
    1. Chen X., Zhan J. Y., Lu H. X., Ye W., Zhang W., Yang W. J., et al. . (2014). Factors associated with black tooth stain in Chinese preschool children. Clin. Oral. Investig. 18 (9), 2059–2066. 10.1007/s00784-013-1184-z - DOI - PubMed
    1. Chen K. J., Gao S. S., Duangthip D., Lo E. C. M., Chu C. H. (2019). Early childhood caries and oral health care of Hong Kong preschool children. Clin. Cosmet. Investig. Dent. 11, 27–35. 10.2147/ccide.s190993 - DOI - PMC - PubMed

Publication types