. 2021 Apr 1:9:650748.
doi: 10.3389/fcell.2021.650748. eCollection 2021.

Urea as a By-Product of Ammonia Metabolism Can Be a Potential Serum Biomarker of Hepatocellular Carcinoma

Affiliations

Urea as a By-Product of Ammonia Metabolism Can Be a Potential Serum Biomarker of Hepatocellular Carcinoma

Changsen Bai et al. Front Cell Dev Biol. .

Abstract

Hepatocellular carcinoma (HCC) is highly malignant; nearly half of the new cases and deaths are in China. The poor prognosis of HCC is mainly due to late diagnosis; many new biomarkers have been developed for HCC diagnosis. However, few markers are quickly translated into clinical practice; early and differential diagnosis of HCC from cirrhosis and/or hepatitis is still a clinical challenge. Metabolomics and biochemical methods were used to reveal specific serum biomarkers of HCC. Most of the elevated metabolites in HCC and HBV patients were overlapped compared with controls. Urea was the specifically elevated serum biomarker of HCC patients. Moreover, urea combined with AFP and CEA can improve the sensitivity of HCC diagnosis. The plasma ammonia of HCC patients was significantly higher than healthy controls. Co-culture cell model revealed normal liver cells cooperated with cancer cells to metabolize ammonia into urea. The urea metabolism in cancer cells marginally depended on the expression of CPS1. However, the expression of CPS1 did not change with ammonium chloride, which might regulate the urea cycle through enzyme activity. The urea cycle could detoxify high concentrations of ammonia to promote cancer cell proliferation. Therefore, urea was a by-product of ammonia metabolism and could be a potential serum biomarker for HCC. The combined application of metabolomics and biochemical methods can discover new biomarkers for the early diagnosis of HCC and be quickly applied to clinical diagnosis.

Keywords: CPS1; ammonia; biomarker; hepatocellular carcinoma; metabolomics; urea.


Conflict of interest statement

The authors declare that the research was conducted in the absence of any commercial or financial relationships that could be construed as a potential conflict of interest.

Figures

FIGURE 1
FIGURE 1
Screening for differential serum metabolites of HCC by targeted metabolomics. (A) Heatmap clustering analysis of differential metabolites in serum of 10 normal controls, 10 HBV and 10 HBV positive HCC patients. (B) Metabolites volcano map of HCC vs control. Compared with the control group, the significantly increased metabolites were shown in red, and the significantly decreased metabolites were shown in green. (C) Metabolites volcano map of HBV vs control. Compared with the control group, the significantly increased metabolites were shown in red, and the significantly decreased metabolites were shown in green. (D) Venn diagram was used to characterize different metabolites of HCC vs control, HBV vs control and HCC vs HBV.
FIGURE 2
FIGURE 2
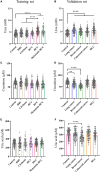
Serum urea was a potential biomarker for HCC. (A,C,E) Scatter plots with bar of urea, creatinine and uric acid of control, HBV, Cirrhosis, HCV, HCC and metastatic HCC patients in training set. (B,D,F) Scatter plots with bar of urea, creatinine and uric acid of control, lung cancer, breast cancer, colorectal cancer and HCC patients in validation set. p < 0.05; ∗∗p < 0.01, ∗∗∗p < 0.001, ****p < 0.0001.
FIGURE 3
FIGURE 3
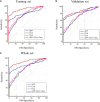
Performance of urea, AFP, and CEA in the diagnosis of HCC. (A–C) Receiver operating characteristic curves of urea, AFP, CEA and AFP + CEA + urea to distinguish HCC from healthy controls in training set, validation set and whole set.
FIGURE 4
FIGURE 4
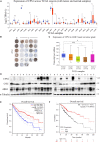
The key enzymes of the urea cycle were often low expressed in HCC patients. (A) UALCAN portal analysis of cancer samples from the TCGA database (http://ualcan.path.uab.edu/). A comparison of CPS1 expression between normal and multiple cancer samples. Tumor tissues were shown in red, and normal tissues were shown in blue. BLCA, Bladder urothelial carcinoma; BRCA, Breast invasive carcinoma; CESC, Cervical squamous cell carcinoma; CHOL, Cholangiocarcinoma; COAD, Colon adenocarcinoma; ESCA, Esophageal carcinoma; GBM, Glioblastoma multiforme; HNSC, Head and Neck squamous cell carcinoma; KICH, Kidney Chromophobe; KIRC, Kidney renal clear cell carcinoma; KIRP, Kidney renal papillary cell carcinoma; LIHC, Liver hepatocellular carcinoma; LUAD, Lung adenocarcinoma; LUSC, Lung squamous cell carcinoma; PAAD, Pancreatic adenocarcinoma; PRAD, Prostate adenocarcinoma; PCPG, Pheochromocytoma and Paraganglioma; READ, Rectum adenocarcinoma; SARC, Sarcoma; SKCM, Skin Cutaneous Melanoma; THYM, Thymoma; STAD, Stomach adenocarcinoma; UCEC, Uterine Corpus Endometrial Carcinoma. (B) Expression of CPS1 of normal liver (N) and HCC (T) samples from The Human Protein Atlas (Human Protein Atlas available from http://www.proteinatlas.org). (C) UALCAN portal analysis of CPS1 expression between normal and different grade HCC samples from the TCGA database. (D) Western blot to detect the expression of CPS1, OTC, ARG1 and GAPDH from 14 pairs of cancer and adjacent tissues of HCC. (E,F) Survival probability between HCC patients with high and low CPS1 expression. The GEPIA database (http://gepia.cancer-pku.cn/) and Kaplan-Meier Plotter (http://kmplot.com/analysis/) were used to conduct survival analyses based on core gene expression. p < 0.05; ∗∗p < 0.01, ∗∗∗p < 0.001, ****p < 0.0001.
FIGURE 5
FIGURE 5
Ammonia is metabolized by normal liver and cancer cells into urea. (A) A schematic to show the metabolism of urea cycle. (B) Scatter plots with bar of plasma ammonia of 20 age and sex matched control and HCC patients. (C) Scatter plots with bar of serum urea of 20 age and sex matched control and HCC patients. (D) Western blot of lysates from HL-7702, MHCC97H, HepG2, Hep3B, PLC/PRF/5, HLE, NCM460, HCT116, HCT8, MCF-7 and A549 cells. (E) Excretion of ammonia to medium from HL-7702, MHCC97H, HepG2, PLC/PRF/5, NCM460, HCT116, MCF-7 and A549 cells. (F) Excretion of urea to medium from HL-7702, MHCC97H, HepG2, PLC/PRF/5, NCM460, HCT116, MCF-7 and A549 cells. (G) Schematic diagram of co-culture cell model. HL-7702, MHCC97H or PLC/PRF/5 were cultured in the lower layer respectively, and the upper layer was HL-7702. (H) Relative urea abundance in the upper medium of the cell lines as indicated. (I) Relative urea abundance in the lower medium of the cell lines as indicated. Values are the means ± SD of three independent experiments. p < 0.05; ∗∗p < 0.01, ∗∗∗p < 0.001, ****p < 0.0001.
FIGURE 6
FIGURE 6
The relationship of urea cycle with ammonia metabolism in cancer cells. (A) Western blot of lysates from HL-7702 cells cultured under 0, 0.5, 2, 5, 10 or 20 mM NH4Cl for 8 h. (B) Western blot of lysates from HepG2, NCM460, HCT116, MHCC97H, HLE, MCF-7, PLC/PRF/5 cells cultured under 0 or 10 mM NH4Cl for 8 h. (C,D) Relative urea excretion from HL-7702 and PLC/PRF/5 cells cultured under 0, 0.5, 2, 5, 10 or 20 mM NH4Cl for 48 h. (E) Western blot confirmed the knockdown of CPS1 in PLC/PRF/5 cells. (F) Relative ammonia excretion in PLC/PRF/5/shScramble, PLC/PRF/5/shCPS1 for 8 hours. (G) Relative urea excretion in PLC/shScr, PLC/shCPS1 for 48 h. (H) Western blot confirmed the over-expression of CPS1 in MHCC97H cells. (I) Relative ammonia excretion in MHCC97H/Vector, MHCC97H/CPS1 for 8 h. (J) Relative urea excretion in MHCC97H/Vector, MHCC97H/CPS1 for 48 h. Values are the means ± SD of three independent experiments. p < 0.05; ∗∗p < 0.01, ∗∗∗p < 0.001, ****p < 0.0001.
FIGURE 7
FIGURE 7
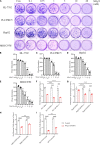
Urea cycle protects cancer cells from high concentrations of ammonia. (A) Colony formation ability of HL-7702, PLC/PRF/5, HepG2 and MHCC97H under different concentrations of NH4Cl. The culture time was 2 weeks. (B–E) Colony number quantification of HL-7702, PLC/PRF/5, HepG2 and MHCC97H under different concentrations of NH4Cl by Image J. (F) Proliferation of PLC/PRF/5/shScr and PLC/PRF/5/shCPS1 cells cultured under control or 10 mM NH4Cl for 3 days. (G) Proliferation of HepG2/shScr and HepG2/shCPS1 cells cultured under control or 10 mM NH4Cl for 3 days. (H) Proliferation of MHCC97H/Vector, MHCC97H/CPS1 cells cultured under control or 10 mM NH4Cl for 3 days. (I) Proliferation of HCT116/Vector, HCT116/CPS1 cells cultured under control or 10 mM NH4Cl for 3 days. Values are the means ± SD of three independent experiments. p < 0.05; ∗∗p < 0.01, ∗∗∗p < 0.001, ****p < 0.0001.

Similar articles

Cited by

References

    1. Ahn J. C., Teng P. C., Chen P. J., Posadas E., Tseng H. R., Lu S. C., et al. (2020). Detection of circulating tumor cells and their implications as a novel biomarker for diagnosis, prognostication, and therapeutic monitoring in hepatocellular carcinoma. Hepatology 73 422–436. 10.1002/hep.31165 - DOI - PMC - PubMed
    1. Banales J. M., Iñarrairaegui M., Arbelaiz A., Milkiewicz P., Muntané J., Muñoz-Bellvis L., et al. (2019). Serum metabolites as diagnostic biomarkers for cholangiocarcinoma. Hepatocell. Carcinoma Prim. Scleros. Cholang. 70 547–562. - PMC - PubMed
    1. Biswas S. K., Allavena P., Mantovani A. (2013). Tumor-associated macrophages: functional diversity, clinical significance, and open questions. Semin. Immunopathol. 35 585–600. 10.1007/s00281-013-0367-7 - DOI - PubMed
    1. Braissant O. (2010). Ammonia toxicity to the brain: effects on creatine metabolism and transport and protective roles of creatine. Mol. Genet. Metab. 100(Suppl. 1) S53–S58. - PubMed
    1. Caldwell R. W., Rodriguez P. C., Toque H. A., Narayanan S. P., Caldwell R. B. (2018). Arginase: a multifaceted enzyme important in health and disease. Physiol. Rev. 98 641–665. 10.1152/physrev.00037.2016 - DOI - PMC - PubMed

LinkOut - more resources