. 2021 Apr 1:9:652652.
doi: 10.3389/fcell.2021.652652. eCollection 2021.

M-Cadherin Is a PAX3 Target During Myotome Patterning

Affiliations

M-Cadherin Is a PAX3 Target During Myotome Patterning

Joana Esteves de Lima et al. Front Cell Dev Biol. .

Abstract

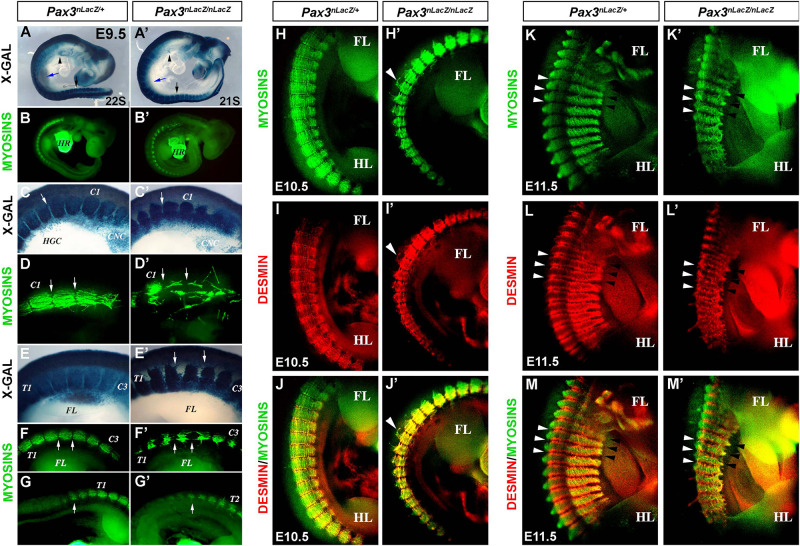
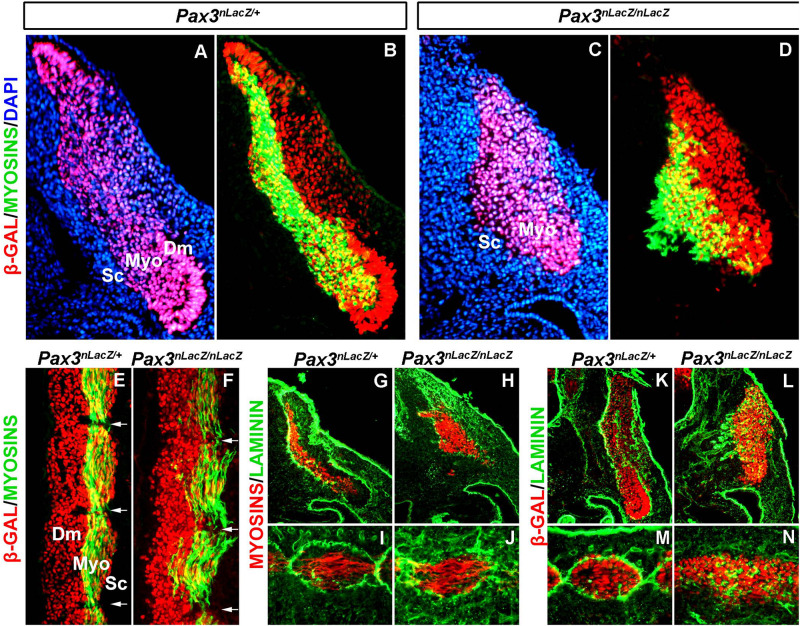
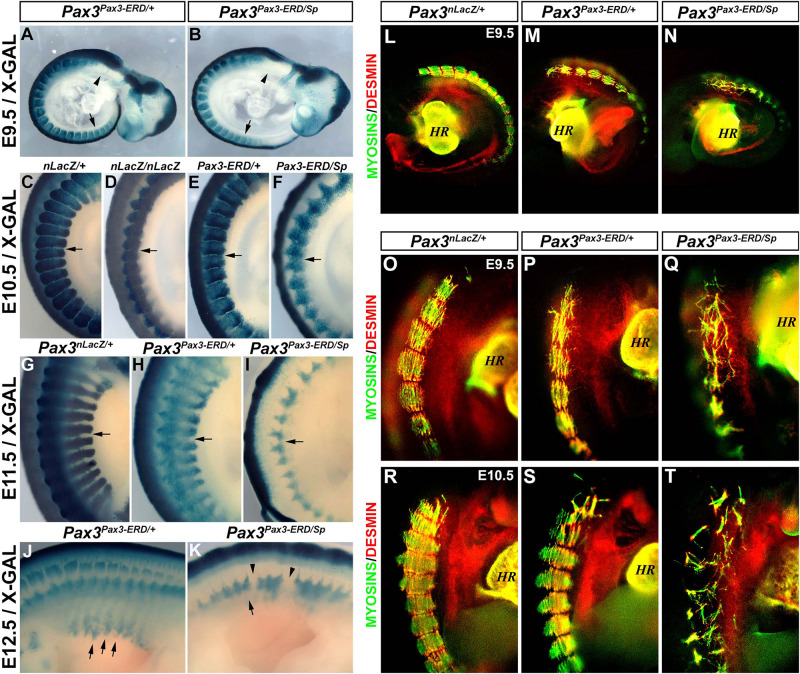
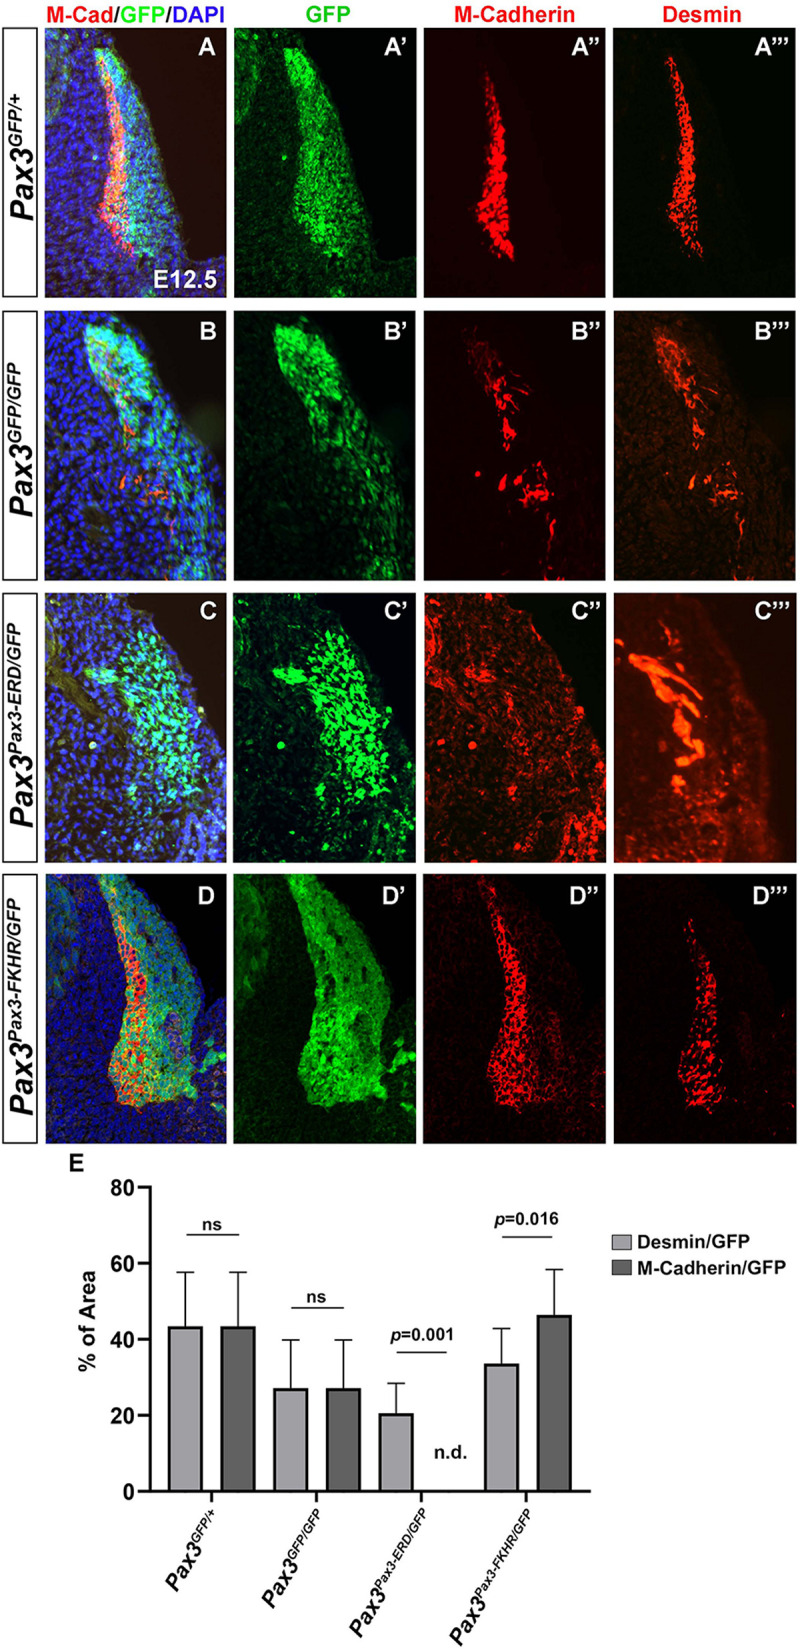
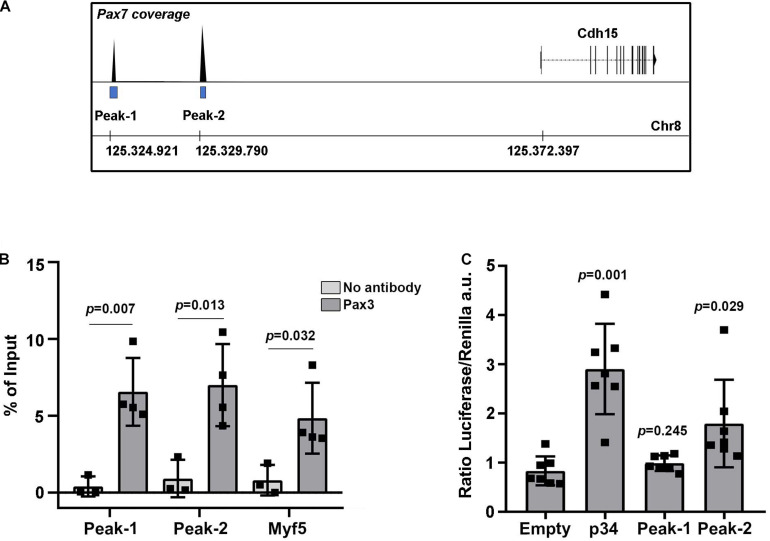
PAX3 belongs to the paired-homeobox family of transcription factors and plays a key role as an upstream regulator of muscle progenitor cells during embryonic development. Pax3-mutant embryos display impaired somite development, yet the consequences for myotome formation have not been characterized. The early myotome is formed by PAX3-expressing myogenic cells that delaminate from the dermomyotomal lips and migrate between the dermomyotome and sclerotome where they terminally differentiate. Here we show that in Pax3-mutant embryos, myotome formation is impaired, displays a defective basal lamina and the regionalization of the structural protein Desmin is lost. In addition, this phenotype is more severe in embryos combining Pax3-null and Pax3 dominant-negative alleles. We identify the adhesion molecule M-Cadherin as a PAX3 target gene, the expression of which is modulated in the myotome according to Pax3 gain- and loss-of-function alleles analyzed. Taken together, we identify M-Cadherin as a PAX3-target linked to the formation of the myotome.

Keywords: CDH15; M-Cadherin; PAX3; myogenesis; myotome.


Conflict of interest statement

The authors declare that the research was conducted in the absence of any commercial or financial relationships that could be construed as a potential conflict of interest.

Figures

FIGURE 1
FIGURE 1
Characterization of the myotome of Pax3-mutant embryos. (A,A′) X-GAL staining of whole-mount control (Pax3nLacZ/+) and Pax3-mutant (Pax3nLacZ/nLacZ) embryos at E9.5 (arrow head, hypoglossal cord; blue arrow, forelimb; black arrow, hindlimb). (B,B′) Whole-mount immunostaining to visualize muscle Myosins in control (Pax3nLacZ/+) and Pax3-mutant (Pax3nLacZ/nLacZ) embryos at E9.5 (HR, heart). (C,C′) High magnification of X-GAL staining of whole-mount control (Pax3nLacZ/+) and Pax3-mutant (Pax3nLacZ/nLacZ) embryos in the cervical region at E9.5 (C1, Cervical Somite 1; HGC, hypoglossal cord; CNC, cardiac neural crest cells; arrow, somite boundary). (D,D′) High magnification of whole-mount immunostaining to visualize muscle Myosins in control (Pax3nLacZ/+) and Pax3-mutant (Pax3nLacZ/nLacZ) embryos at the cervical region at E9.5 (arrows, somite boundaries). (E,E′) High magnification of X-GAL staining of whole-mount control (Pax3nLacZ/+) and Pax3-mutant (Pax3nLacZ/nLacZ) embryos in the thoracic region at E9.5 (T1, Thoracic Somite 1; C3, Cervical Somite 3; arrows, Dorsal root ganglia lacking in the mutant embryo). (F–G′) High magnification of whole-mount immunostaining to visualize muscle Myosins in control (Pax3nLacZ/+) and Pax3-mutant (Pax3nLacZ/nLacZ) embryos in the thoracic region at E9.5 (T1, Thoracic Somite 1; T2, Thoracic Somite 2; C3, Cervical Somite 3; FL, forelimb; arrows, somite boundaries). (H–M′) Whole-mount immunostaining to visualize muscle Myosins (H,H′,K,K′), Desmin (I,I′,L,L′) and the merge (J,J′,M,M′) in control (Pax3nLacZ/+) and Pax3-mutant (Pax3nLacZ/nLacZ) embryos at E10.5 (H–J′) and E11.5 (K–M′) (FL, forelimb; HL, hindlimb; white arrow heads, epaxial somite boundary; black arrow heads, hypaxial somite boundary).
FIGURE 2
FIGURE 2
Characterization of the basal lamina in the myotome of Pax3-mutant embryos. (A–D) Immunostaining on transverse sections at the anterior thoracic level of E11.5 embryos to visualize myosins (green), β-GAL (red) that labels the PAX3 genetic lineage and DAPI to visualize the nuclei (blue) in control (Pax3nLacZ/+) (A,B) and Pax3-mutant (Pax3nLacZ/nLacZ) (C,D) embryos (Dm, dermomyotome; Myo, myotome; Sc, sclerotome). (E,F) Immunostaining on longitudinal sections (thoracic somites) of E11.5 embryos to visualize muscle Myosins (green) and β-GAL (red) that labels cells that have or would have expressed Pax3 in control (Pax3nLacZ/+) (E) and Pax3-mutant (Pax3nLacZ/nLacZ) (F) embryos (Dm, dermomyotome; Myo, myotome; Sc, sclerotome). (G,J) Immunostaining on transverse (G,H) and longitudinal (I,J) sections of E11.5 embryos to visualize muscle Myosins (red) and Laminin (green) in control (Pax3nLacZ/+) (G,I) and Pax3-mutant (Pax3nLacZ/nLacZ) (H,J) embryos. (K,N) Immunostaining on transverse (K,L) and longitudinal (M,N) sections (thoracic somites) of E11.5 embryos to visualize β-GAL that labels the PAX3 genetic lineage (red) and Laminin (green) in control (Pax3nLacZ/+) (K,M) and Pax3-mutant (Pax3nLacZ/nLacZ) (L,N) embryos.
FIGURE 3
FIGURE 3
Characterization of the myotome of Pax3Pax3– ERD/+ and Pax3Pax3– ERD/Sp embryos. (A,K) X-GAL staining of whole-mount control (Pax3nLacZ/+) (C,G), Pax3-mutant (Pax3nLacZ/nLacZ) (D), Pax3Pax3– ERD/+ (A,E,H,J), and Pax3Pax3– ERD/Sp (B,F,I,K) embryos at E9.5 (A,B), E10.5 (C–F), E11.5 (G–I), and E12.5 (J,K). (L–T) Whole-mount immunostaining to visualize muscle Myosins (green) and Desmin (red) in control (Pax3nLacZ/+) (L,O,R), Pax3Pax3– ERD/+ (M,P,S) and Pax3Pax3– ERD/Sp (N,Q,T) embryos at E9.5 (L–Q) and E10.5 (R–T) (HR, heart).
FIGURE 4
FIGURE 4
Characterization of M-Cadherin expression in the myotome of embryos with different Pax3 alleles. (A–D) Immunostaining on transverse sections of E12.5 embryos to visualize M-Cadherin (red), GFP (green) that labels the PAX3 genetic lineage, Desmin (far-red and represented in red in the panels A″′,B″′,C″′,D″′) and DAPI to visualize the nuclei (blue) in control (Pax3GFP/+) (A), Pax3-mutant (Pax3GFP/GFP) (B), Pax3Pax3– ERD/GFP (C), and Pax3Pax3– FKHR/GFP (D) embryos. (A′,B′,C′,D′) Immunostaining to visualize GFP (green) that labels the PAX3 lineage (same section as in A–D), in control (Pax3GFP/+) (A′), Pax3-mutant (Pax3GFP/GFP) (B′), Pax3Pax3– ERD/GFP (C′), and Pax3Pax3– FKHR/GFP (D′) embryos. (A″,B″,C″,D″) Immunostaining to visualize M-Cadherin (red) (same section as in A–D) in control (Pax3GFP/+) (A″), Pax3-mutant (Pax3GFP/GFP) (B″), Pax3Pax3– ERD/GFP (C″), and Pax3Pax3– FKHR/GFP (D″) embryos. (A″′,B″′,C″′,D″′) Immunostaining to visualize Desmin (red) (same section as in A–D) in control (Pax3GFP/+) (A″′), Pax3-mutant (Pax3GFP/GFP) (B″′), Pax3Pax3– ERD/GFP (C″′), and Pax3Pax3– FKHR/GFP (D″′) embryos. (E) Quantification of the percentage of the surface area of M-Cadherin vs. GFP and Desmin vs. GFP in the different Pax3 alleles. Graph represents the mean with standard deviations. The p-value was calculated with a two-tailed paired t-test.
FIGURE 5
FIGURE 5
Identification of M-Cadherin as a direct target of PAX3. (A) Schematic representation of the detected peaks bound by PAX7 from Soleimani et al. (2012) upstream of the M-Cadherin gene (Cdh15) locus. (B) ChIP-RT-qPCR for PAX3 on Peak-1 and Peak-2 and on the positive control at −57 kb upstream of Myf5. Graph represents the mean with standard deviations. The p-value was calculated with a two-tailed paired t-test. (C) Quantification in arbitrary units of the ratio between luciferase and renilla (transfection control) in the presence of an expression vector for PAX3 and a plasmid containing the luciferase gene under the control of the p34 sequence, as a positive control, the Peak-1 sequence, the Peak-2 sequence or no potential PAX3 binding sequence (empty). Graph represents the mean with standard deviations. The p-value was calculated with a two-tailed paired t-test.

References

    1. Auerbach R. (1954). Analysis of the developmental effects of a lethal mutation in the house mouse. J. Exp. Zool. 127 305–329. 10.1002/jez.1401270206 - DOI
    1. Bajanca F., Luz M., Raymond K., Martins G. G., Sonnenberg A., Tajbakhsh S., et al. (2006). Integrin α6β1-laminin interactions regulate early myotome formation in the mouse embryo. Development 133 1635–1644. 10.1242/dev.02336 - DOI - PubMed
    1. Bajard L., Relaix F., Lagha M., Rocancourt D., Daubas P., Buckingham M. E. (2006). A novel genetic hierarchy functions during hypaxial myogenesis: pax3 directly activates Myf5 in muscle progenitor cells in the limb. Genes Dev. 20 2450–2464. 10.1101/gad.382806 - DOI - PMC - PubMed
    1. Bober E., Franz T., Arnold H. H., Gruss P., Tremblay P. (1994). Pax-3 is required for the development of limb muscles: a possible role for the migration of dermomyotomal muscle progenitor cells. Dev. Camb. Engl. 120 603–612. - PubMed
    1. Borycki A. G., Li J., Jin F., Emerson C. P., Epstein J. A. (1999). Pax3 functions in cell survival and in pax7 regulation. Dev. Camb. Engl. 126 1665–1674. - PubMed