. 2021 Apr 1:9:659177.
doi: 10.3389/fcell.2021.659177. eCollection 2021.

Targeting of CAT and VCAM1 as Novel Therapeutic Targets for DMD Cardiomyopathy

Affiliations

Targeting of CAT and VCAM1 as Novel Therapeutic Targets for DMD Cardiomyopathy

Bin Li et al. Front Cell Dev Biol. .

Abstract

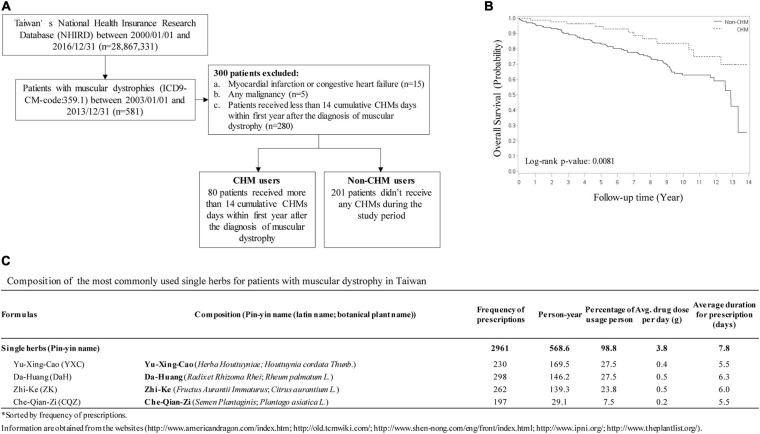
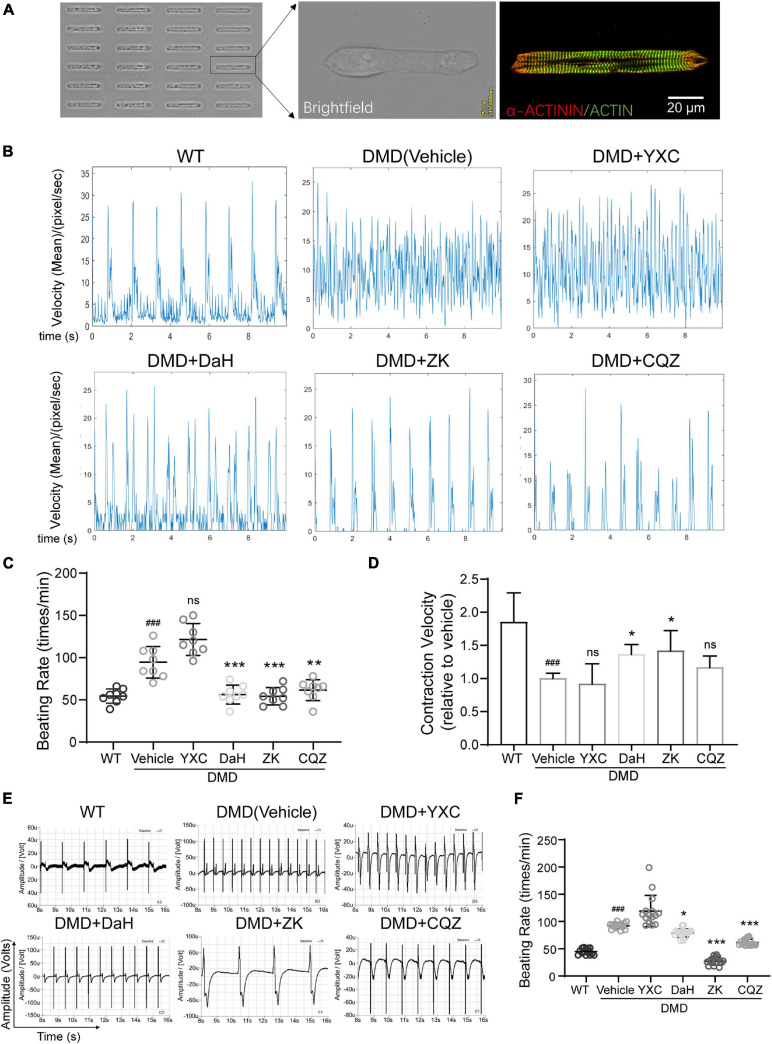
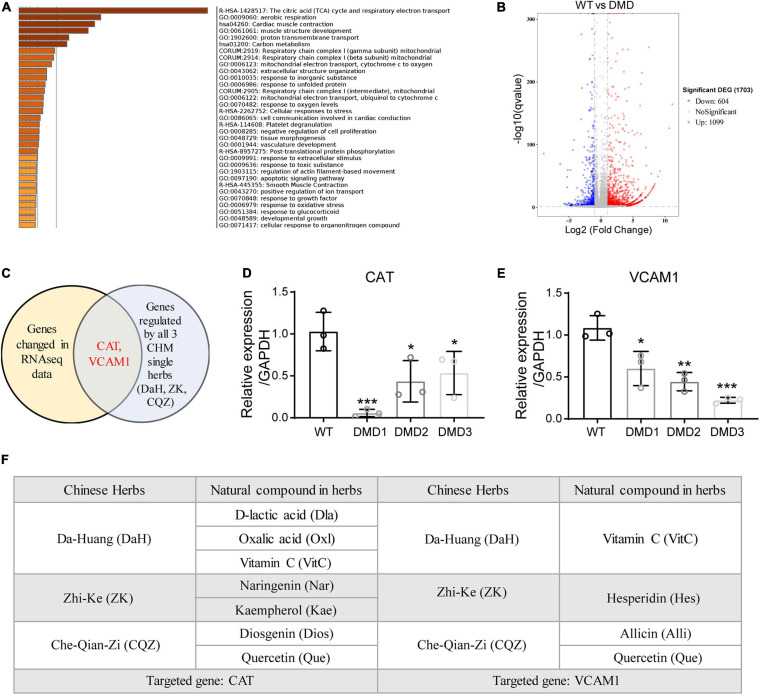
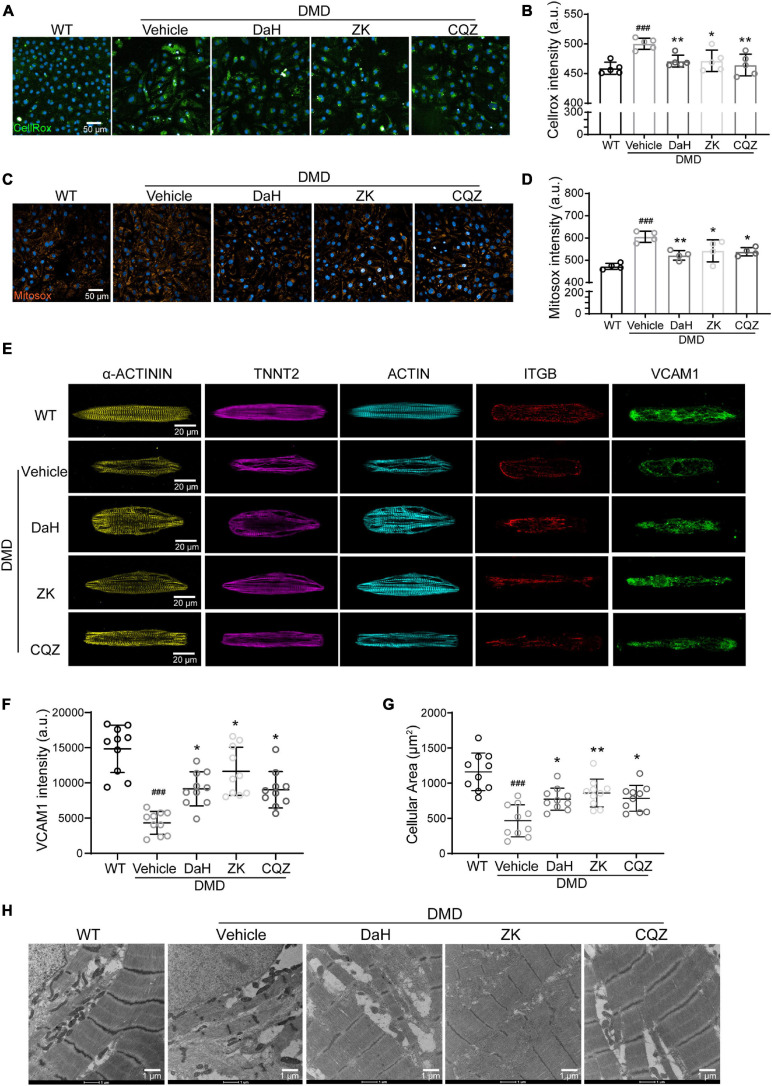
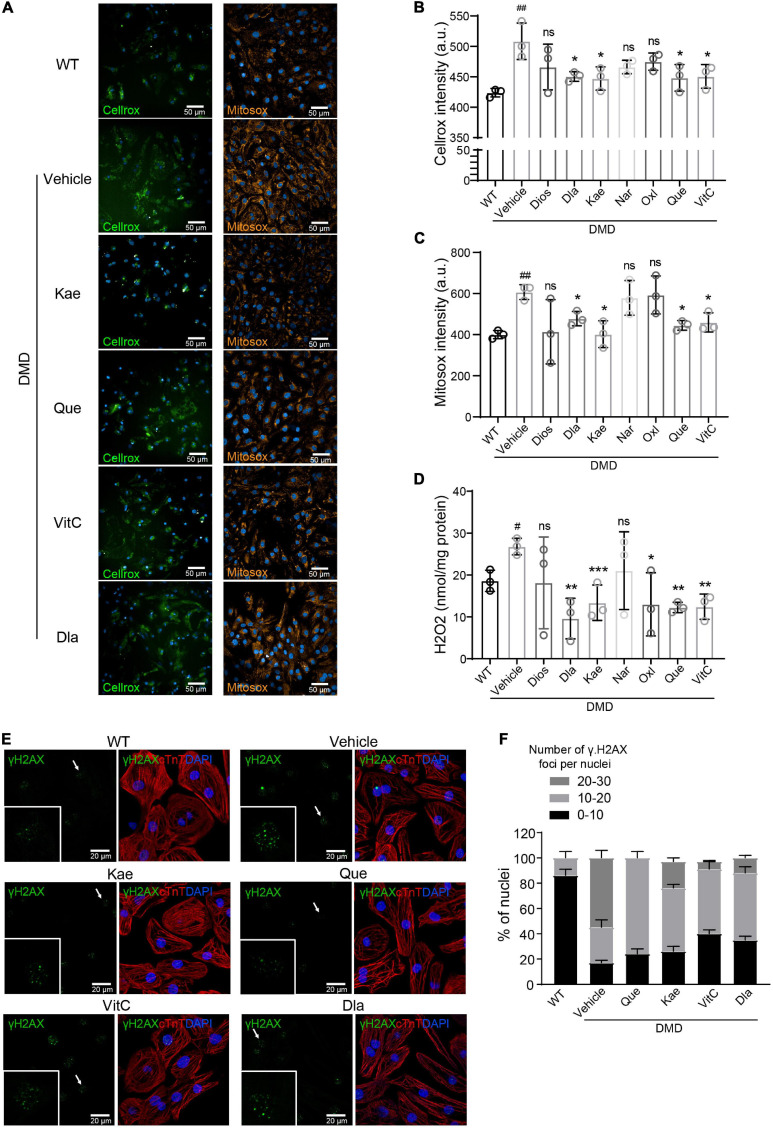
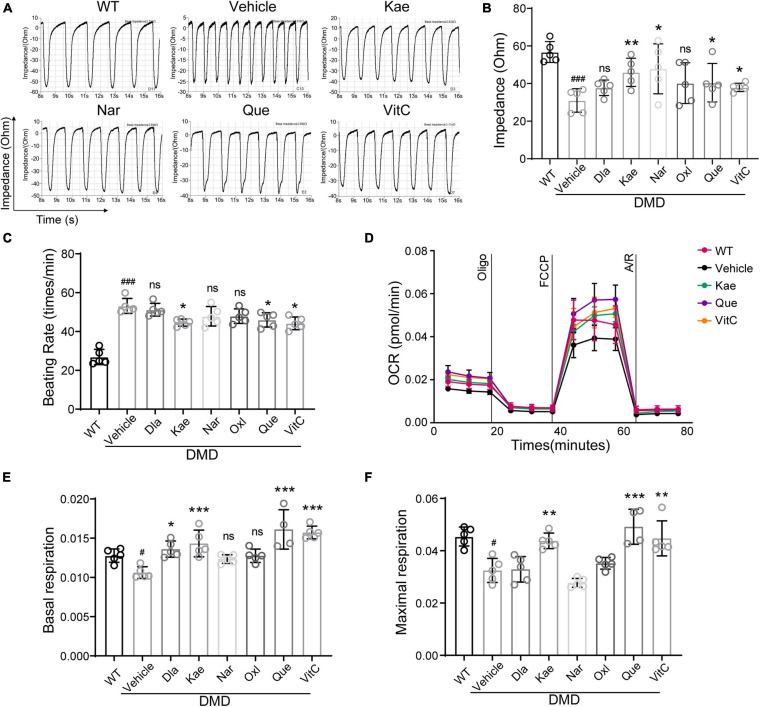
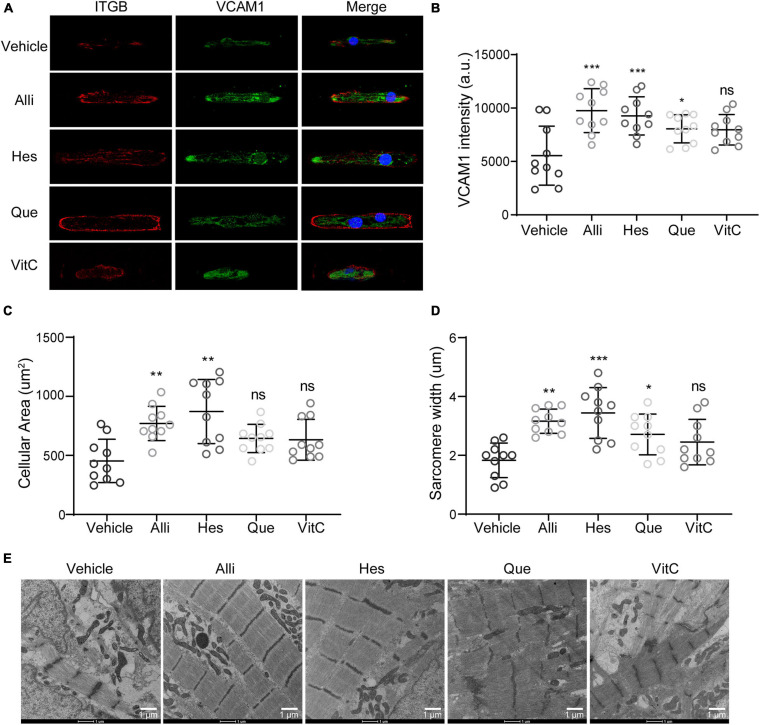
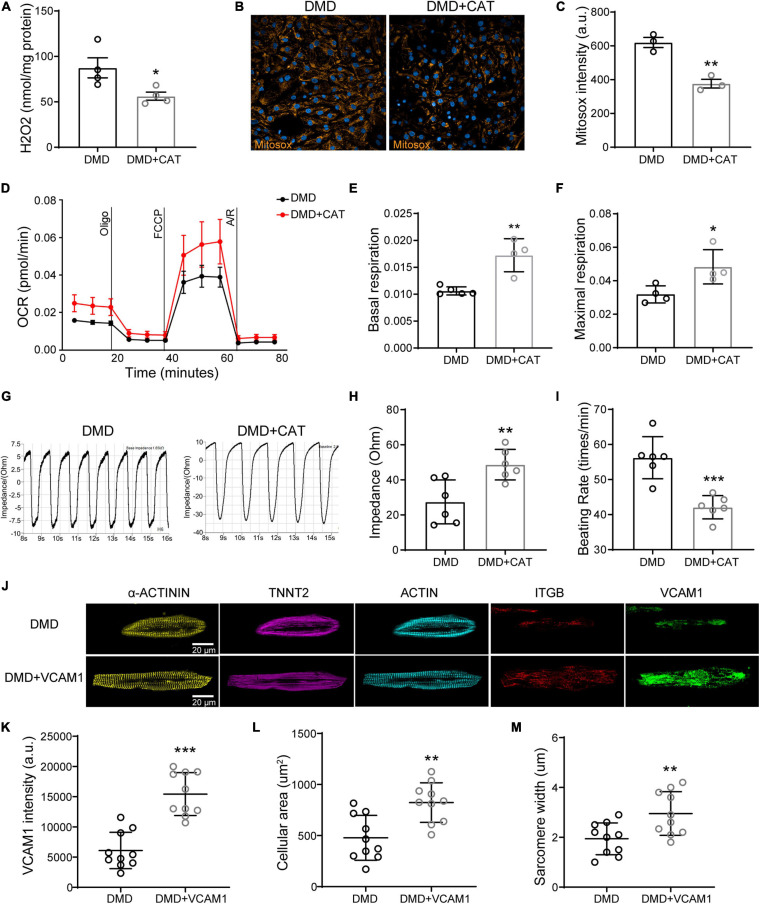
Duchenne muscular dystrophy (DMD) related cardiomyopathy is the leading cause of early mortality in DMD patients. There is an urgent need to gain a better understanding of the disease molecular pathogenesis and develop effective therapies to prevent the onset of heart failure. In the present study, we used DMD human induced pluripotent stem cells (DMD-hiPSCs) derived cardiomyocytes (CMs) as a platform to explore the active compounds in commonly used Chinese herbal medicine (CHM) herbs. Single CHM herb (DaH, ZK, and CQZ) reduced cell beating rate, decreased cellular ROS accumulation, and improved structure of DMD hiPSC-CMs. Cross-comparison of transcriptomic profiling data and active compound library identified nine active chemicals targeting ROS neutralizing Catalase (CAT) and structural protein vascular cell adhesion molecule 1 (VCAM1). Treatment with Quecetin, Kaempferol, and Vitamin C, targeting CAT, conferred ROS protection and improved contraction; treatment with Hesperidin and Allicin, targeting VCAM1, induced structure enhancement via induction of focal adhesion. Lastly, overexpression of CAT or VCAM1 in DMD hiPSC-CMs reconstituted efficacious effects and conferred increase in cardiomyocyte function. Together, our results provide a new insight in treating DMD cardiomyopathy via targeting of CAT and VCAM1, and serves as an example of translating Bed to Bench back to Bed using a muti-omics approach.

Keywords: CAT; CHM herbs; DMD cardiomyopathy; VCAM1; hiPSC-CMs; natural compounds.


Conflict of interest statement

The authors declare that the research was conducted in the absence of any commercial or financial relationships that could be construed as a potential conflict of interest.

Figures

FIGURE 1
FIGURE 1
CHM usage among muscular dystrophy patients in Taiwan. (A) Selection workflow identifying CHM and non-CHM muscular dystrophic cohort in Taiwan. CHM, Chinese herbal medicine. (B) The cumulative incidence of overall survival in CHM users versus non-CHM users. (C) Identification of the most commonly used single herbs for patients with muscular dystrophy in Taiwan.
FIGURE 2
FIGURE 2
Effect of DaH, ZK, and CQZ treatment on DMD cardiomyocyte function. (A) Representative image of micropatterned hiPSC-CMs, showing single cell with aligned sarcomere. (B) Representative motion tracing of single wild type (WT) hiPSC-CMs and DMD hiPSC-CMs. (C) Beating rate and (D) contraction velocity of single DMD hiPSC-CMs treated with YXC, DaH, ZK, CQZ, or Vehicle (n = 8). ###P < 0.001 versus WT; *P < 0.05, **P < 0.01, and ***P < 0.001 versus vehicle. (E) Representative extracellular field potential (EFP) traces and (F) quantification of monolayer DMD hiPSC-CMs treated with YXC, DaH, ZK, CQZ, or Vehicle. WT hiPSC-CMs served as healthy control (n = 12). ###P < 0.001 versus WT; *P < 0.05, **P < 0.01, and ***P < 0.001 versus vehicle; ns = no statistical significance.
FIGURE 3
FIGURE 3
Identification of CAT and VCAM1 as therapeutic targets for DaH, ZK, and CQZ. (A) GO term analysis of differentially expressed genes between WT and DMD hiPSC-CMs. Top enrichment clusters were shown, discrete color scale represented statistical significance. (B) Volcano plot of differentially expressed genes between WT and DMD hiPSC-CMs. (C) Venn diagram showing overlapping genes between differentially expressed gene list and CHM target genes. Relative expression of (D) CAT and (E) VCAM1 were measured by RT-qPCR (n = 3). *P < 0.05, **P < 0.01, and ***P < 0.001. (F) Summary of active compounds in DaH, ZK, and CQZ targeting CAT and VCAM1, respectively.
FIGURE 4
FIGURE 4
DaH, ZK, and CQZ treatments decreased ROS accumulation and improved cytoskeletal structure of DMD hiPSC-CMs. (A) Representative micrographs of WT and DMD hiPSC-CMs treated with DaH, ZK, CQZ or vehicle stained for cellular ROS (Cellrox). (B) Intracellular ROS levels were determined by measuring the level of fluorescent Cellrox (n = 5). ###P < 0.001 versus WT; *P < 0.05, **P < 0.01 versus vehicle. (C) Representative micrographs of WT and DMD hiPSC-CMs treated with DaH, ZK, CQZ or vehicle stained for mitochondrial ROS (Mitosox). (D) Mitochondrial ROS levels were determined by measuring the level of fluorescent Mitosox (n = 4). ###P < 0.001 versus WT; *P < 0.05, **P < 0.01 versus vehicle. (E) Immunofluorescence micrographs of focal adhesion related proteins. (F) Quantification of total VCAM1 levels and (G) cell size of WT and DMD hiPSC-CMs (n = 10). ###P < 0.001 versus WT; *P < 0.05, **P < 0.01 versus vehicle. (H) Representative transmission electron microscopy images of WT and DMD hiPSC-CMs.
FIGURE 5
FIGURE 5
Active compounds from DaH, ZK, and CQZ decreased intracellular ROS levels and protect cells from oxidative DNA damage. (A) Representative micrographs of WT and DMD hiPSC-CMs treated with active compounds or vehicle stained for cellular ROS (Cellrox) and mitochondrial ROS (Mitosox). (B) Intracellular ROS levels (Cellrox), (C) mitochondrial ROS levels (Mitosox), and (D) H2O2 levels in WT and DMD hiPSC-CMs were measured (n = 3). #P < 0.05, ##P < 0.01 versus WT; *P < 0.05, **P < 0.01, and ***P < 0.001 versus vehicle; ns = no statistical significance. (E) Representative images of γH2A.X staining in WT and DMD hiPSC-CMs treated with active compounds or vehicle, only active compounds showing statistical significance were shown. (F) Quantification of percentage of γH2A.X foci per nucleus in hiPSC-CMs.
FIGURE 6
FIGURE 6
Active compounds from DaH, ZK, and CQZ increased DMD hiPSC-CMs contractility and mitochondrial respiration. (A) Representative impedance (IMP) traces of monolayer DMD hiPSC-CMs treated with active compounds or vehicle. (B) Quantification of the IMP and (C) beating rate of monolayer DMD hiPSC-CMs treated with active compounds or vehicle. WT hiPSC-CMs served as healthy control. (D) Real-time mitochondrial respiration measurements of hiPSC-CMs. (E) Quantification of basal mitochondrial respiration and (F) maximal respiration of WT and DMD hiPSC-CMs treated with active compounds or vehicle (n = 5). #P < 0.05 versus WT; ###P < 0.001 versus WT; *P < 0.05, **P < 0.01, and ***P < 0.001 versus vehicle; ns = no statistical significance.
FIGURE 7
FIGURE 7
Active compounds from DaH, ZK, and CQZ improved cytoskeletal structure of DMD hiPSC-CMs. (A) Representative immunofluorescence micrographs of ITGB and VCAM1 protein in DMD hiPSC-CMs treated with active compounds. Quantification of (B) VCAM1 levels, (C) cell size, and (D) sarcomere lengths of DMD hiPSC-CMs treated with Alli, Hes, Que, VitC, or vehicle (n = 10). *P < 0.05, **P < 0.01, and ***P < 0.001; ns = no statistical significance. (E) Representative transmission electron microscopy images of DMD hiPSC-CMs treated with Alli, Hes, Que, VitC, or vehicle.
FIGURE 8
FIGURE 8
Overexpression of CAT or VCAM1 in DMD hiPSC-CMs. (A) H2O2 levels, (B) Mitosox, and (C) mitochondrial ROS levels were quantified in DMD hiPSC-CMs overexpressing CAT. (D) Mitochondrial respiration was measured in CAT overexpressing DMD hiPSC-CMs. (E) Quantification of basal respiration and (F) maximal respiration. (G) Representative impedance traces of monolayer DMD hiPSC-CMs treated with CAT lentivirus or control and quantification of the (H) impedance and (I) beating rate (n = 6). **P < 0.01 and ***P < 0.001. (J) Immunofluorescence micrographs of focal adhesion related proteins and VCAM1. Quantification of (K) VCAM1 levels, (L) cell size, and (M) sarcomere length in DMD hiPSC-CMs treated with CAT lentivirus or control (n = 10). *P < 0.05, **P < 0.01, and ***P < 0.001.

References

    1. Anders S., Huber W. (2010). Differential expression analysis for sequence count data. Genome Biol. 11:R106. 10.1186/gb-2010-11-10-r106 - DOI - PMC - PubMed
    1. Angelini C. (2007). The role of corticosteroids in muscular dystrophy: a critical appraisal. Muscle Nerve 36 424–435. 10.1002/mus.20812 - DOI - PubMed
    1. Angelini C., Peterle E. (2012). Old and new therapeutic developments in steroid treatment in Duchenne muscular dystrophy. Acta Myol. 31 9–15. - PMC - PubMed
    1. Bertero E., Maack C. (2018). Calcium signaling and reactive oxygen species in mitochondria. Circ. Res. 122 1460–1478. 10.1161/circresaha.118.310082 - DOI - PubMed
    1. Birnkrant D. J., Bushby K., Bann C. M., Apkon S. D., Blackwell A., Brumbaugh D., et al. (2018). Diagnosis and management of Duchenne muscular dystrophy, part 1: diagnosis, and neuromuscular, rehabilitation, endocrine, and gastrointestinal and nutritional management. Lancet Neurol. 17 251–267. 10.1016/s1474-4422(18)30024-3 - DOI - PMC - PubMed